| Research article |
|


|
|
|
| Linkage between precipitation isotopes and water vapor sources in the monsoon margin: Evidence from arid areas of Northwest China |
CHEN Fenli1,2, ZHANG Qiuyan1,2, WANG Shengjie1,2,*( ), CHEN Jufan1,2, GAO Minyan1,2, Mohd Aadil BHAT3 ), CHEN Jufan1,2, GAO Minyan1,2, Mohd Aadil BHAT3 |
1College of Geography and Environmental Science, Northwest Normal University, Lanzhou 730000, China
2Key Laboratory of Resource Environment and Sustainable Development of Oasis of Gansu Province, Northwest Normal University, Lanzhou 730000, China
3School of Ocean and Earth Science, Tongji University, Shanghai 200092, China |
|
|
|
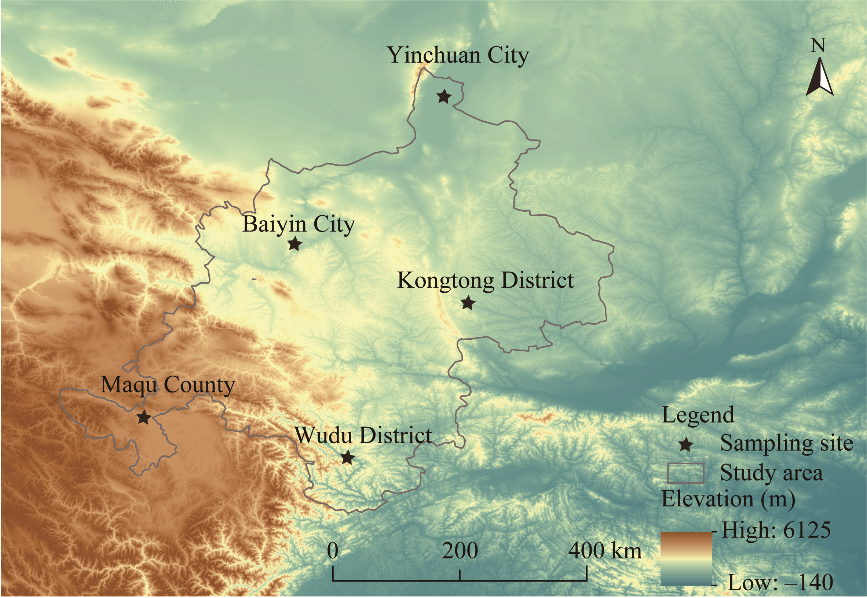
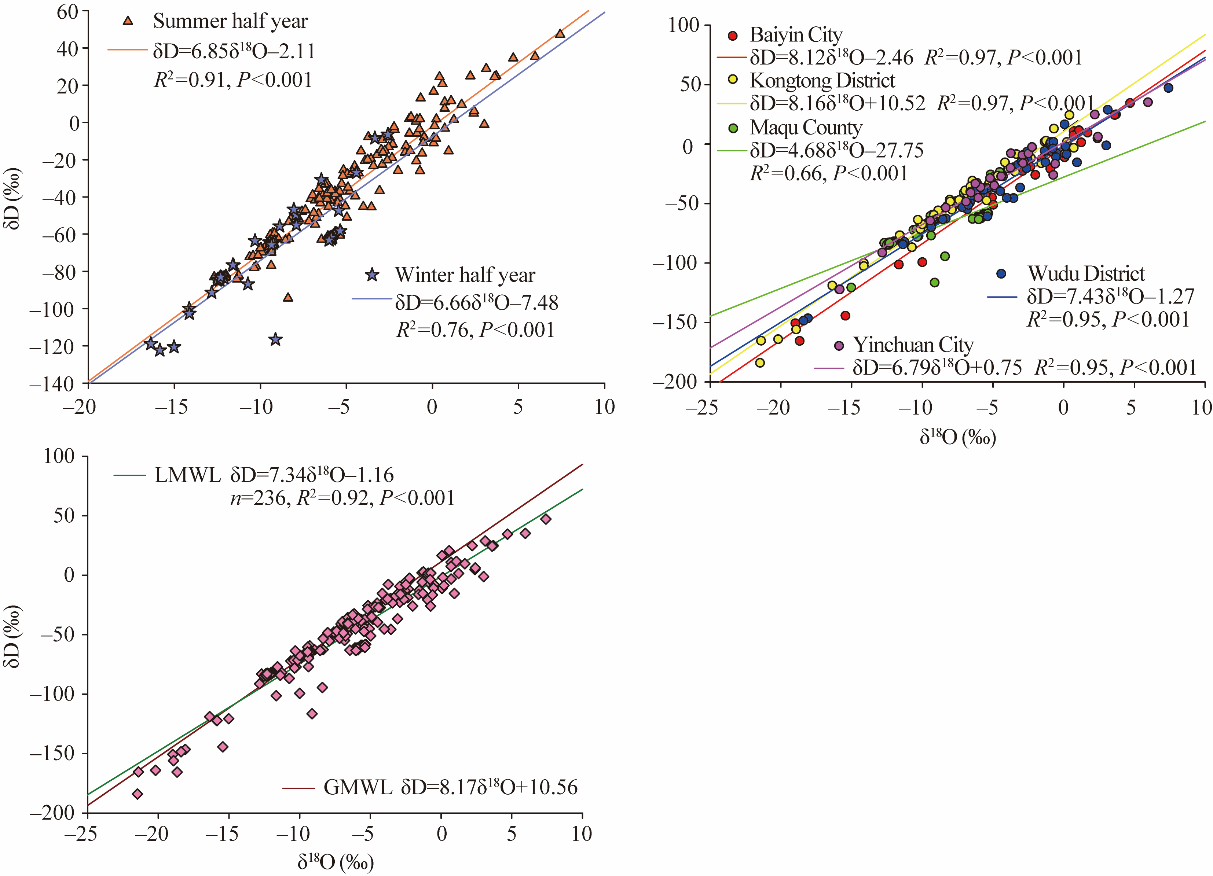
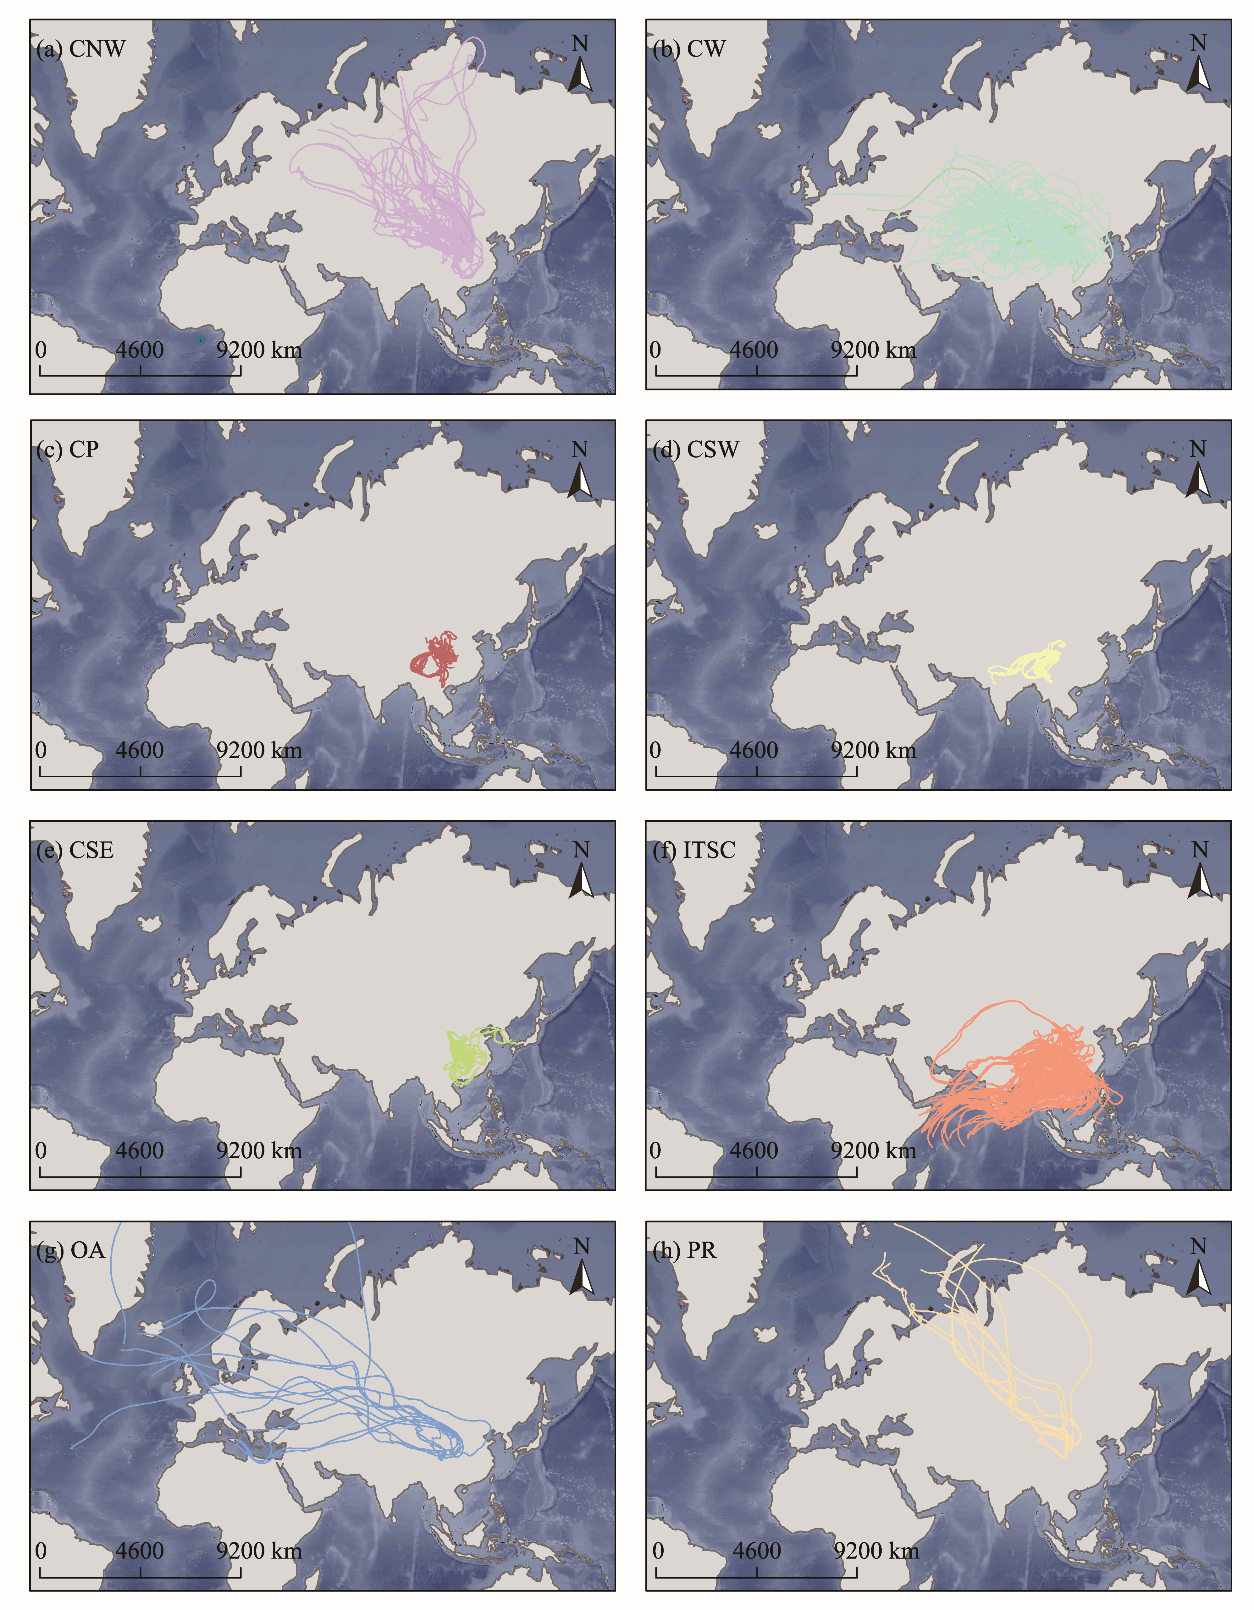
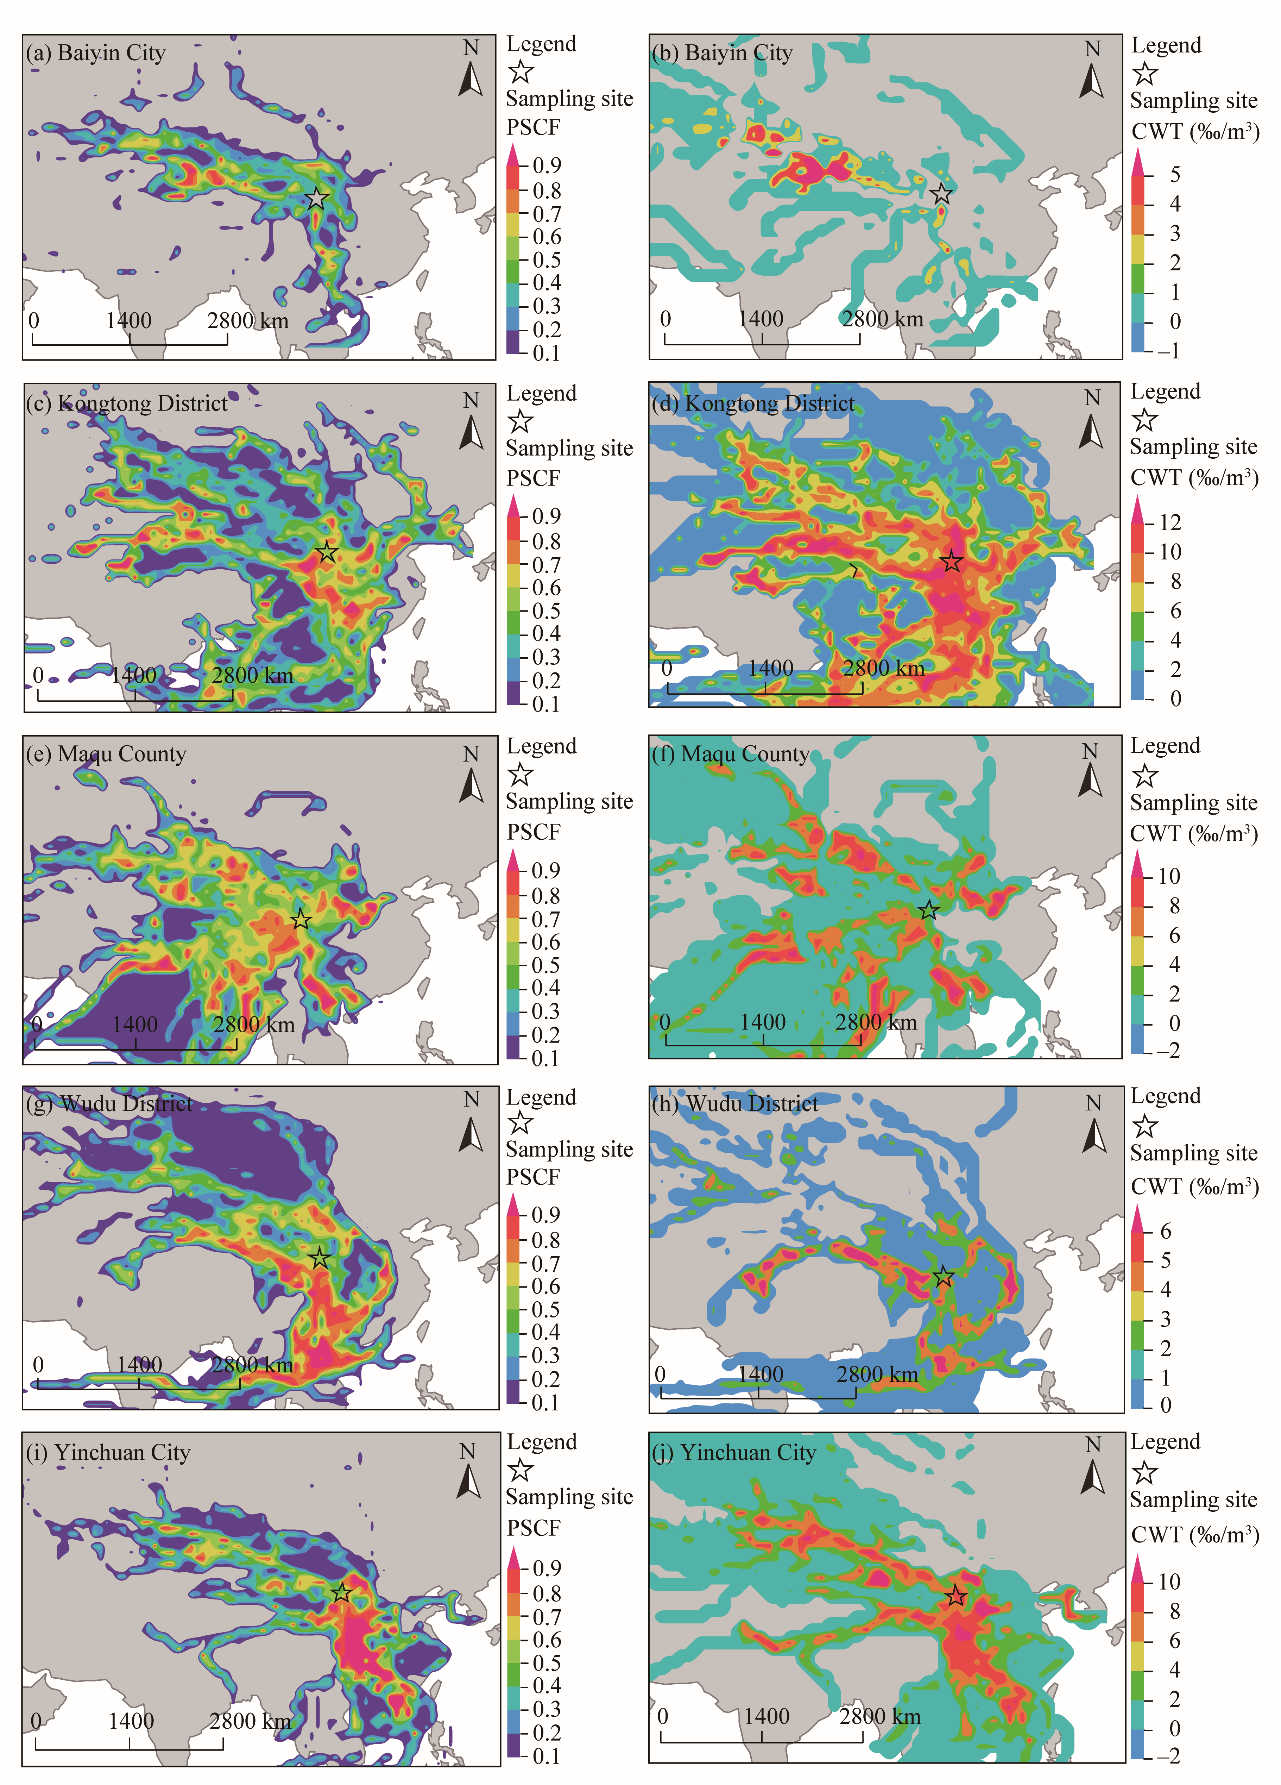
Abstract The isotope composition in precipitation has been widely considered as a tracer of monsoon activity. Compared with the coastal region, the monsoon margin usually has limited precipitation with large fluctuation and is usually sensitive to climate change. The water resource management in the monsoon margin should be better planned by understanding the composition of precipitation isotope and its influencing factors. In this study, the precipitation samples were collected at five sampling sites (Baiyin City, Kongtong District, Maqu County, Wudu District, and Yinchuan City) of the monsoon margin in the northwest of China in 2022 to analyze the characteristics of stable hydrogen (δD) and oxygen (δ18O) isotopes. We analyzed the impact of meteorological factors (temperature, precipitation, and relative humidity) on the composition of precipitation isotope at daily level by regression analysis, utilized the Hybrid Single-Particle Lagrangian Integrated Trajectory (HYSPLIT)-based backward trajectory model to simulate the air mass trajectory of precipitation events, and adopted the potential source contribution function (PSCF) and concentration weighted trajectory (CWT) to analyze the water vapor sources. The results showed that compared with the global meteoric water line (GMWL), the slope of the local meteoric water line (LMWL; δD=7.34δ18O-1.16) was lower, indicating the existence of strong regional evaporation in the study area. Temperature significantly contributed to δ18O value, while relative humidity had a significant negative effect on δ18O value. Through the backward trajectory analysis, we found eight primary locations that were responsible for the water vapor sources of precipitation in the study area, of which moisture from the Indian Ocean to South China Sea (ITSC) and the western continental (CW) had the greatest influence on precipitation in the study area. The hydrogen and oxygen isotopes in precipitation are significantly influenced by the sources and transportation paths of air mass. In addition, the results of PSCF and CWT analysis showed that the water vapor source areas were primarily distributed in the south and northwest direction of the study area.
|
|
Received: 20 September 2023
Published: 31 March 2024
|
|
Corresponding Authors:
*WANG Shengjie (E-mail: wangshengjie@nwnu.edu.cn)
|
|
|
| [1] |
Baker A J, Sodemann H, Baldini J U L, et al. 2015. Seasonality of westerly moisture transport in the East Asian summer monsoon and its implications for interpreting precipitation δ18O. Journal of Geophysical Research: Atmospheres, 120(12): 5850-5862.
doi: 10.1002/jgrd.v120.12
|
|
|
| [2] |
Bian H, Ying Z, Li T, et al. 2017. Interannual variability in the onset of the South China Sea summer monsoon from 1997 to 2014. Atmospheric and Oceanic Science Letters, 10(1): 73-81.
doi: 10.1080/16742834.2017.1237853
|
|
|
| [3] |
Bhat M A, Zhong J, Dar T, et al. 2022. Spatial distribution of stable isotopes in surface water on the upper Indus River basin (UIRB): Implications for moisture source and paleoelevation reconstruction. Applied Geochemistry, 136: 105137, doi: 10.1016/j.apgeochem.2021.105137.
|
|
|
| [4] |
Breitenbach S F M, Adkins J F, Meyer H, et al. 2010. Strong influence of water vapor source dynamics on stable isotopes in precipitation observed in Southern Meghalaya, NE India. Earth and Planetary Science Letters, 292(1-2): 212-220.
doi: 10.1016/j.epsl.2010.01.038
|
|
|
| [5] |
Cai Z Y, Tian L D, Bowen G J. 2018. Spatial-seasonal patterns reveal large-scale atmospheric controls on Asian Monsoon precipitation water isotope ratios. Earth and Planetary Science Letters, 503: 158-169.
doi: 10.1016/j.epsl.2018.09.028
|
|
|
| [6] |
Chen F L, Zhang M J, Argiriou A A, et al. 2020. Deuterium excess in precipitation reveals water vapor source in the monsoon margin sites in Northwest China. Water, 12(12): 3315, doi: 10.3390/w12123315.
|
|
|
| [7] |
Chen J H, Li Y, Xiong B, et al. 2023. Comparison of moisture sources of summer precipitation in 1998 and 2020 in the middle and lower reaches of Yangtze River basin. International Journal of Climatology, 43(8): 3493-3505.
doi: 10.1002/joc.v43.8
|
|
|
| [8] |
Claus K, Rolf F R, Fernando R B, et al. 2021. Vapour source and spatiotemporal variation of precipitation isotopes in Southwest Spain. Hydrological Processes, 35(12): e14445, doi: 10.1002/hyp.14445.
|
|
|
| [9] |
Cloux S, Garaboa-Paz D, Insua-Costa D, et al. 2021. Extreme precipitation events in the Mediterranean area: contrasting two different models for moisture source identification. Hydrology and Earth System Sciences, 25(12): 6465-6477.
doi: 10.5194/hess-25-6465-2021
|
|
|
| [10] |
Craig H. 1961. Isotopic variations in meteoric waters. Science, 133: 1702-1703.
pmid: 17814749
|
|
|
| [11] |
Crawford J, Hughes C E, Parkes S D. 2013. Is the isotopic composition of event based precipitation driven by moisture source or synoptic scale weather in the Sydney Basin, Australia? Journal of Hydrology, 507: 213-226.
doi: 10.1016/j.jhydrol.2013.10.031
|
|
|
| [12] |
Dansgaard W. 1964. Stable isotopes in precipitation. Tellus, 16(4): 436-468.
|
|
|
| [13] |
Espinoza J C, Arias P A, Moron V, et al. 2021. Recent changes in the atmospheric circulation patterns during the dry-to-wet transition season in south tropical South America (1979-2020): impacts on precipitation and fire season. Journal of Climate, 34(22): 9025-9042.
|
|
|
| [14] |
Fang L J, Gao R Z, Wang X X, et al. 2022. Isotopes-based characterization of precipitation compositions and atmospheric water vapor sources over typical Eurasian steppes in south Mongolian Plateau. Journal of Hydrology, 615: 128724, doi: 10.1016/j.jhydrol.2022.128724.
|
|
|
| [15] |
Geppert M, Hartmann K, Kirchner I, et al. 2022. Precipitation over Southern Africa: moisture sources and isotopic composition. Journal of Geophysical Research: Atmospheres, 127(21): e2022JD037005, doi: 10.1029/2022JD037005.
|
|
|
| [16] |
Gimeno L, Stohl A, Trigo R M, et al. 2012. Oceanic and terrestrial sources of continental precipitation. Reviews of Geophysics, 50: RG4003, doi: 10.1029/2012RG000389.
|
|
|
| [17] |
Gou J F, Qu S M, Guan H D, et al. 2022. Relationship between precipitation isotopic compositions and synoptic atmospheric circulation patterns in the lower reach of the Yangtze River. Journal of Hydrology, 605: 127289, doi: 10.1016/j.jhydrol.2021.127289.
|
|
|
| [18] |
Hsu Y K, Holsen M T, Hopke P K. 2003. Comparison of hybrid receptor models to locate PCB sources in Chicago. Atmospheric Environment, 37(4): 545-562.
doi: 10.1016/S1352-2310(02)00886-5
|
|
|
| [19] |
Jiao Y M, Liu C J, Gao X, et al. 2019. Impacts of moisture sources on the isotopic inverse altitude effect and amount of precipitation in the Hani Rice Terraces region of the Ailao Mountains. Science of the Total Environment, 687: 470-478.
doi: 10.1016/j.scitotenv.2019.05.426
|
|
|
| [20] |
Kong Y L, Wang K, Pan S, et al. 2023. Effect of moisture sources on the isotopic composition of precipitation in Northwest China. Water, 15(8): 1584, doi: 10.3390/w15081584.
|
|
|
| [21] |
Kurita N. 2013. Water isotopic variability in response to mesoscale convective system over the tropical ocean. Journal of Geophysical Research: Atmospheres, 118(18): 10376-10390.
|
|
|
| [22] |
Lee J E, Fung I, DePaolo D J, et al. 2007. Analysis of the global distribution of water isotopes using the NCAR atmospheric general circulation model. Journal of Geophysical Research: Atmospheres, 112(D16): 306, doi: 10.1029/2006JD007657.
|
|
|
| [23] |
Lekshmy P R, Midhun M, Ramesh R. 2022. Role of moisture transport from Western Pacific region on water vapor isotopes over the Bay of Bengal. Atmospheric Research, 265: 105895, doi: 10.1016/j.atmosres.2021.105895.
|
|
|
| [24] |
Li J J, Feng Z D, Tang L Y. 1988. Late quaternary monsoon patterns on the Loess Plateau of China. Earth Surface Processes and Landforms, 13(2): 125-135.
doi: 10.1002/esp.v13:2
|
|
|
| [25] |
Li X Y, Kawamura R, Sugimoto A, et al. 2022. Isotopic composition and moisture sources of precipitation in midlatitude regions characterized by extratropical cyclones' route. Journal of Hydrology, 612: 128047, doi: 10.1016/j.jhydrol.2022.128047.
|
|
|
| [26] |
Lone A M, Achyuthan H, Chakraborty S, et al. 2020. Controls on the isotopic composition of daily precipitation characterized by dual moisture transport pathways at the monsoonal margin region of North-Western India. Journal of Hydrology, 588: 125106, doi: 10.1016/j.jhydrol.2020.125106.
|
|
|
| [27] |
Ma L, Sun Y B, Jin Z D, et al. 2022. Magnesium isotopic evidence for staged enhancement of the East Asian Summer Monsoon precipitation since the Miocene. Geochimica et Cosmochimica Acta, 324: 140-155.
doi: 10.1016/j.gca.2022.03.005
|
|
|
| [28] |
Malik F, Butt S, Mujahid N. 2022. Variation in isotopic composition of precipitation with identification of vapor source using deuterium excess as tool. Journal of Radioanalytical and Nuclear Chemistry, 331: 683-690.
doi: 10.1007/s10967-021-08136-6
|
|
|
| [29] |
Moore M, Kuang Z, Blossey P N. 2014. A moisture budget perspective of the amount effect. Geophysical Research Letters, 41(4): 1329-1335.
doi: 10.1002/grl.v41.4
|
|
|
| [30] |
Natali S, Doveri M, Giannecchini R, et al. 2022. Is the deuterium excess in precipitation a reliable tracer of moisture sources and water resources fate in the western Mediterranean? New insights from Apuan Alps (Italy). Journal of Hydrology, 614: 128497, doi: 10.1016/j.jhydrol.2022.128497.
|
|
|
| [31] |
Numaguti A. 1999. Origin and recycling processes of precipitating water over the Eurasian continent: Experiments using an atmospheric general circulation model. Journal of Geophysical Research: Atmospheres, 104(D2): 1957-1972.
doi: 10.1029/1998JD200026
|
|
|
| [32] |
Pant N, Semwal P, Khobragade S D, et al. 2021. Tracing the isotopic signatures of cryospheric water and establishing the altitude effect in Central Himalayas: A tool for cryospheric water partitioning. Journal of Hydrology, 595: 125983, doi: 10.1016/j.jhydrol.2021.125983.
|
|
|
| [33] |
Pérez-Alarcón A, Sorí R, Fernández-Alvarez J C, et al. 2023. Moisture source for the precipitation of tropical cyclones over the Pacific Ocean through a Lagrangian Approach. Journal of Climate, 36(4): 1059-1083.
doi: 10.1175/JCLI-D-22-0287.1
|
|
|
| [34] |
Rhoujjati N, Ait Brahim Y, Hanich L, et al. 2023. Precipitation isotopes to elucidate moisture sources in the Western Mediterranean: case of the Middle Atlas Mountains, Morocco. Environmental Earth Sciences, 82: 250, doi: 10.1007/S12665-023-10930-2.
|
|
|
| [35] |
Risi C, Bony S, Vimeux F. 2008. Influence of convective processes on the isotopic composition (δ18O and δD) of precipitation and water vapor in the tropics: 2. Physical interpretation of the amount effect. Journal of Geophysical Research: Atmospheres, 113(D19): 306, doi: 10.1029/2008JD009943.
|
|
|
| [36] |
Rozanski K, Araguás-Araguás L, Gonfiantini R. 1993. Isotopic patterns in modern global precipitation. In: Swart P K, Lohmann K C, Mckenzie J, et al. Climate Change in Continental Isotopic Records, Volume 78. Geophysical Monograph Series. Hoboken: AGU (American Geophysical Union) Publications, 1-36.
|
|
|
| [37] |
Salamalikis V, Argiriou A A, Dotsika E. 2016. Periodicity analysis of δ18O in precipitation over Central Europe: Time-frequency considerations of the isotopic 'temperature' effect. Journal of Hydrology, 534: 150-163.
doi: 10.1016/j.jhydrol.2015.12.059
|
|
|
| [38] |
Shi Y D, Wang S J, Wang L W, et al. 2010. Isotopic evidence in modern precipitation for the westerly meridional movement in Central Asia. Atmospheric Research, 259: 105698, doi: 10.1016/j.atmosres.2021.105698.
|
|
|
| [39] |
Steen-Larsen H C, Sveinbjörnsdottir A E, Jonsson T, et al. 2015. Moisture sources and synoptic to seasonal variability of North Atlantic water vapor isotopic composition. Journal of Geophysical Research: Atmospheres, 120(12): 5757-5774.
doi: 10.1002/jgrd.v120.12
|
|
|
| [40] |
Stohl A, Forster C, Frank A, et al. 2005. Technical note: The Lagrangian particle dispersion model FLEXPART version 6.2. Atmospheric Chemistry and Physics, 5(9): 2461-2474.
|
|
|
| [41] |
Sun C J, Zhou S J, Jing Z W. 2023. Variability of precipitation-stable isotopes and moisture sources of two typical landforms in the eastern Loess Plateau, China. Journal of Hydrology: Regional Studies, 46: 101349, doi: 10.1016/j.ejrh.2023.101349.
|
|
|
| [42] |
Tan M. 2014. Circulation effect: response of precipitation δ18O to the ENSO cycle in monsoon regions of China. Climate Dynamics, 42: 1067-1077.
doi: 10.1007/s00382-013-1732-x
|
|
|
| [43] |
Tang Y, Song X F, Zhang Y H, et al. 2017. Using stable isotopes to understand seasonal and interannual dynamics in moisture sources and atmospheric circulation in precipitation. Hydrological Processes, 31(26): 4682-4692.
doi: 10.1002/hyp.v31.26
|
|
|
| [44] |
Tao X, Pang H X, Zhan Z J, et al. 2023. Characteristics of water vapor isotopes and moisture sources for short-duration heavy rainfall events in Nanjing, eastern China. Journal of Hydrology, 622: 129731, doi: 10.1016/j.jhydrol.2023.129731.
|
|
|
| [45] |
Tharammal T, Bala G, Nusbaumer J M. 2023. Sources of water vapor and their effects on water isotopes in precipitation in the Indian monsoon region: a model-based assessment. Scientific Reports, 13: 708, doi: 10.1038/s41598-023-27905-9.
pmid: 36639545
|
|
|
| [46] |
Tian L, Yao T, MacClune K, et al. 2007. Stable isotopic variations in west China: A consideration of moisture sources. Journal of Geophysical Research: Atmospheres, 112(D10): 12, doi: 10.1029/2006JD007718.
|
|
|
| [47] |
Trenberth K E. 1998. Atmospheric moisture residence times and cycling: Implications for rainfall rates and climate change. Climatic Change, 39: 667-694.
doi: 10.1023/A:1005319109110
|
|
|
| [48] |
Vishwakarma V, Pattnaik S, Baisya H. 2024. Decadal variability of precipitation and moisture source attribution over India. International Journal of Climatology, 4(2): 703-719.
|
|
|
| [49] |
Wang Q Y. 2014. MeteoInfo: GIS software for meteorological data visualization and analysis. Meteorological Applications, 21(2): 360-368.
doi: 10.1002/met.2014.21.issue-2
|
|
|
| [50] |
Wang S J, Zhang M J, Crawford J, et al. 2017. The effect of moisture source and synoptic conditions on precipitation isotopes in arid central Asia. Journal of Geophysical Research: Atmospheres, 122(5): 2667-2682.
doi: 10.1002/jgrd.v122.5
|
|
|
| [51] |
Wang S J, Lei S J, Zhang M J, et al. 2022. Spatial and seasonal isotope variability in precipitation across China: Monthly isoscapes based on regionalized fuzzy clustering. Journal of Climate, 35(11): 3411-3425.
doi: 10.1175/JCLI-D-21-0451.1
|
|
|
| [52] |
Worden J, Noone D, Bowman K. 2007. Importance of rain evaporation and continental convection in the tropical water cycle. Nature, 445: 528-532.
doi: 10.1038/nature05508
|
|
|
| [53] |
Wu S Y, Bedaso Z. 2022. Quantifying the effect of moisture source and transport on the precipitation isotopic variations in northwest Ethiopian Highland. Journal of Hydrology, 605: 127322, doi: 10.1016/j.jhydrol.2021.127322.
|
|
|
| [54] |
Wu X X, Chen F L, Liu X Y, et al. 2021. The significance of hydrogen and oxygen stable isotopes in the water vapor source in Dingxi Area. Water, 13(17): 2374, doi: 10.3390/w13172374.
|
|
|
| [55] |
Xie C, Zhao L J, Eastoe C J, et al. 2022. Precipitation stable isotope composition, moisture sources, and controlling factors in Xi'an, Northwest China. Atmospheric Research, 280: 106428, doi: 10.1016/j.atmosres.2022.106428.
|
|
|
| [56] |
Xie X X, Liu X D. 2023. Contributions of terrestrial and oceanic moisture sources to orbital-scale precipitation variations over the northern East Asian monsoon region. Global and Planetary Change, 229: 104244, doi: 10.1016/j.gloplacha.2023.104244.
|
|
|
| [57] |
Yang Q C, Mu H K, Guo J C, et al. 2019. Temperature and rainfall amount effects on hydrogen and oxygen stable isotope in precipitation. Quaternary International, 519: 25-31.
doi: 10.1016/j.quaint.2019.01.027
|
|
|
| [58] |
Yao T D, Masson-Delmotte V, Gao J, et al. 2013. A review of climatic controls on δ18O in precipitation over the Tibetan Plateau: Observations and simulations. Reviews of Geophysics, 51(4): 525-548.
doi: 10.1002/rog.v51.4
|
|
|
| [59] |
Zannoni D, Steen-Larsen H C, Rampazzo G, et al. 2019. The atmospheric water cycle of a coastal lagoon: An isotope study of the interactions between water vapor, precipitation and surface waters. Journal of Hydrology, 572: 630-644.
doi: 10.1016/j.jhydrol.2019.03.033
|
|
|
| [60] |
Zeng D, Wu J K, Li H Y, et al. 2020. Progress of hydrogen and oxygen isotope studies in precipitation in the Northwest Arid Zone. Arid Zone Research, 37(4): 857-869. (in Chinese)
|
|
|
| [61] |
Zeng Y, Hopke P K. 1989. A study of the sources of acid precipitation in Ontario, Canada. Atmospheric Environment, 23(7): 1499-1509.
|
|
|
| [62] |
Zhang M M, Jia W X, Zhu G F, et al. 2023. The effect of the seasonality of moisture sources on moisture flux and precipitation stable isotopes in the Shiyang River Basin. Theoretical and Applied Climatology, 151: 767-783.
doi: 10.1007/s00704-022-04290-3
|
|
|
| [63] |
Zhao N, Wu P, Manda A, et al. 2023. Moisture sources of the Tohoku heavy rainfalls in August 2022 and the influences of tropical storms. Geophysical Research Letters, 50(17): e2023GL104166, doi: 10.1029/2023GL104166.
|
|
|
| [64] |
Zhou H, Zhang X P, Yao T C, et al. 2019. Variation of δ18O in precipitation and its response to upstream atmospheric convection and rainout: A case study of Changsha station, south-central China. Science of the Total Environment, 659: 1199-1208.
doi: 10.1016/j.scitotenv.2018.12.396
|
|
|
|
Viewed |
|
|
|
Full text
|
|
|
|
|
Abstract
|
|
|
|
|
Cited |
|
|
|
|
| |
Shared |
|
|
|
|
| |
Discussed |
|
|
|
|