| Research article |
|


|
|
|
| Improving the accuracy of precipitation estimates in a typical inland arid area of China using a dynamic Bayesian model averaging approach |
XU Wenjie1,2, DING Jianli1,2,*( ), BAO Qingling1,2, WANG Jinjie1,2, XU Kun1,2 ), BAO Qingling1,2, WANG Jinjie1,2, XU Kun1,2 |
1College of Geography and Remote Sensing Sciences, Xinjiang University, Urumqi 830017, China
2Key Laboratory of Smart City and Environment Modelling of Higher Education Institute, Xinjiang University, Urumqi 830017, China |
|
|
|
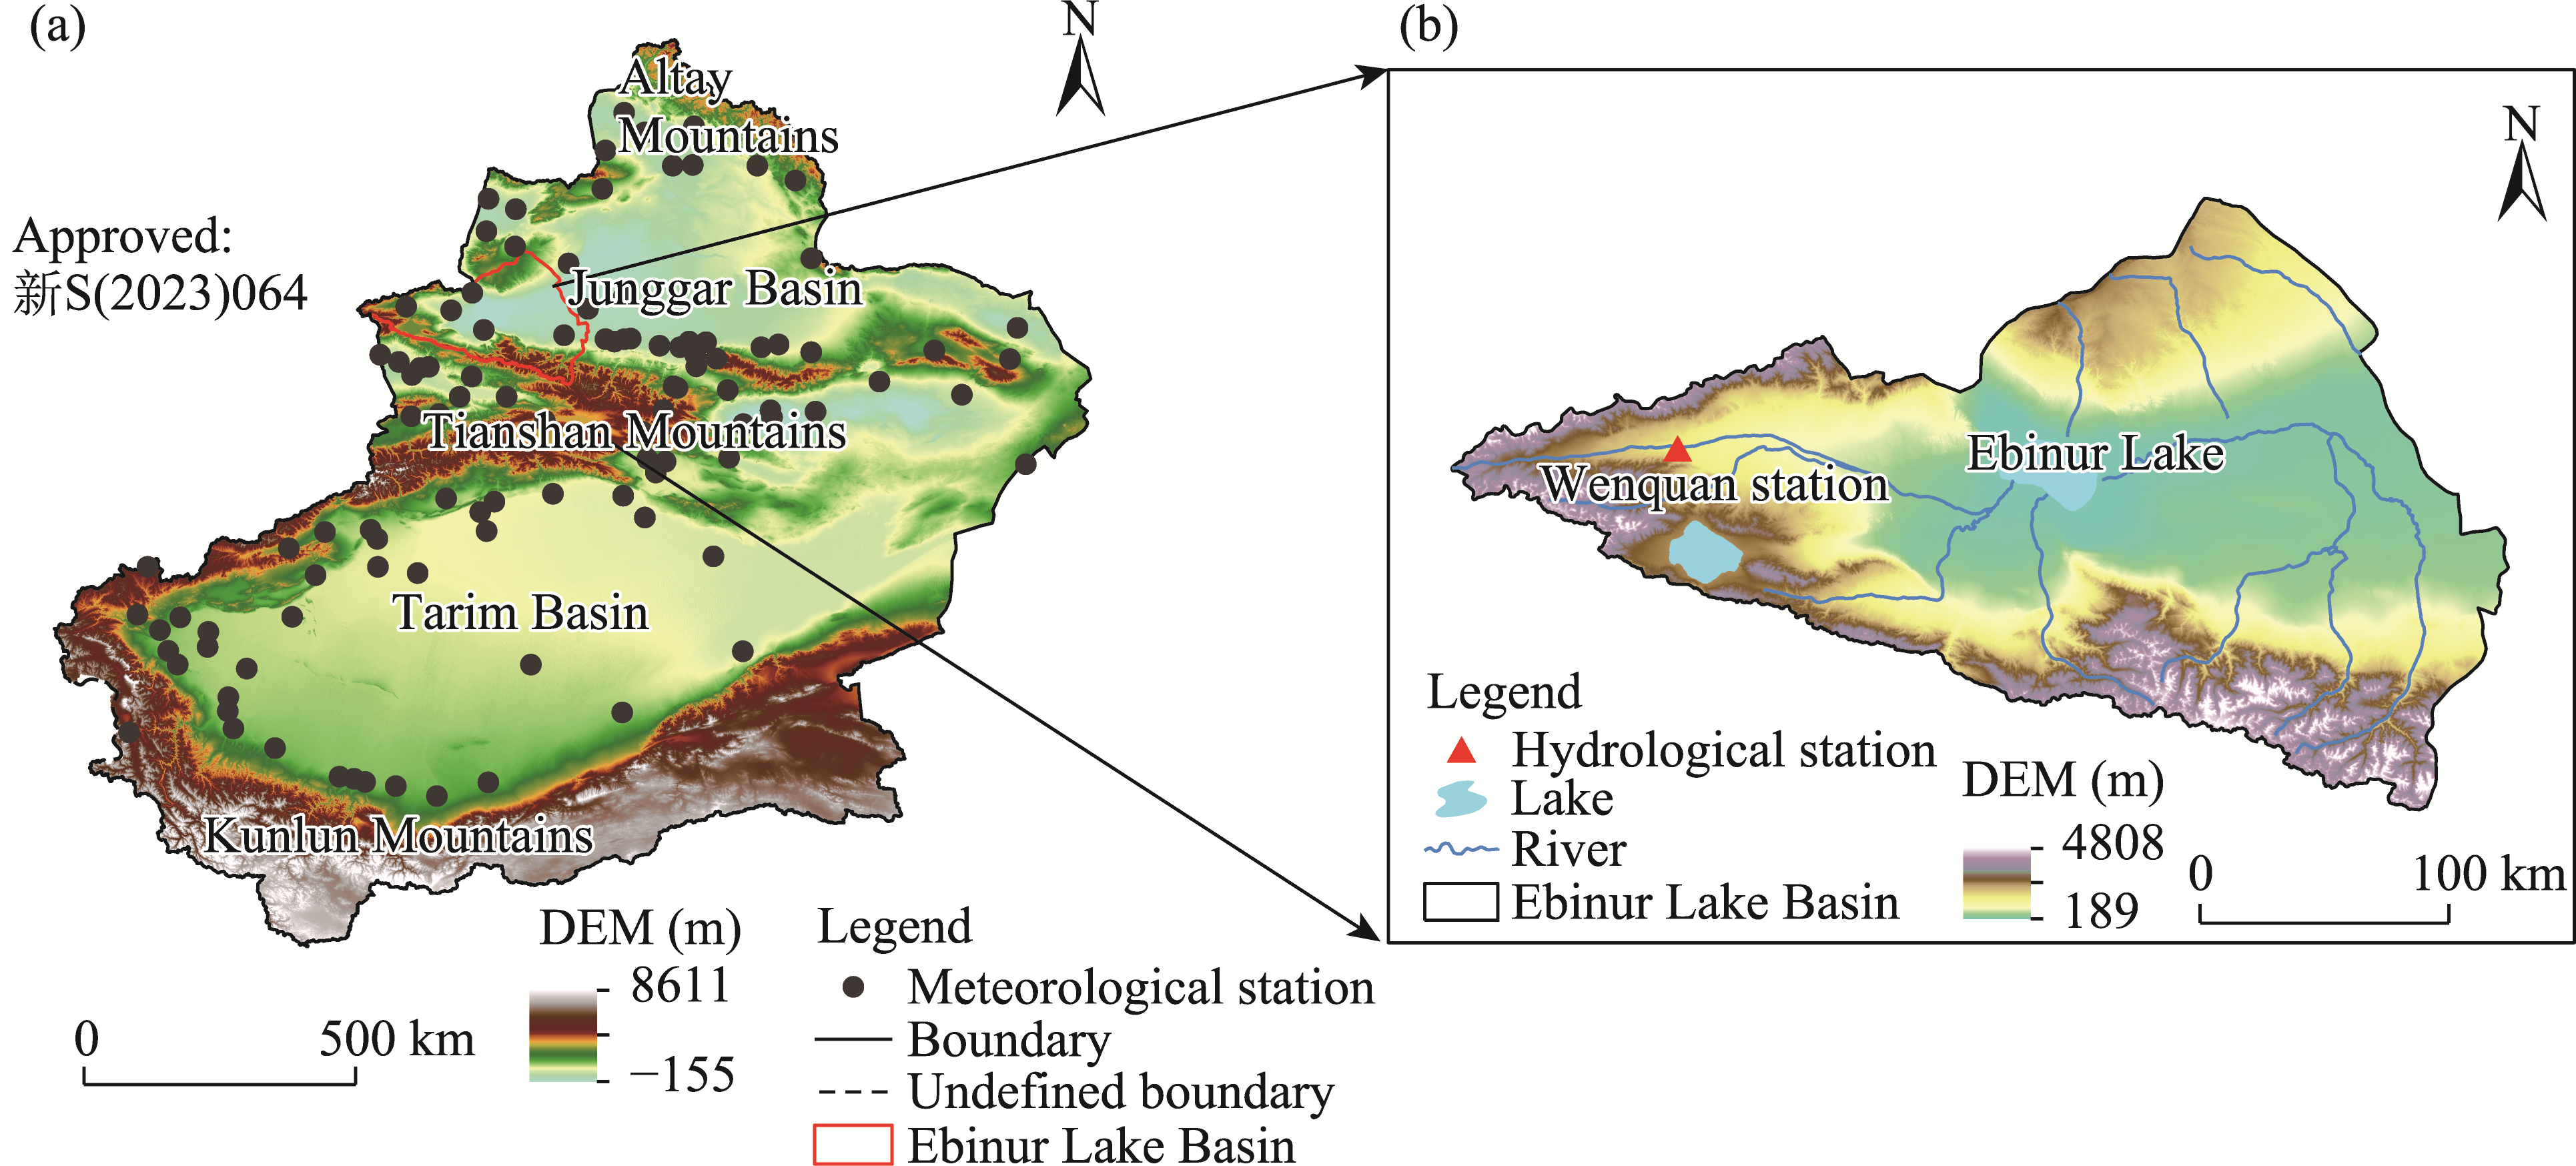
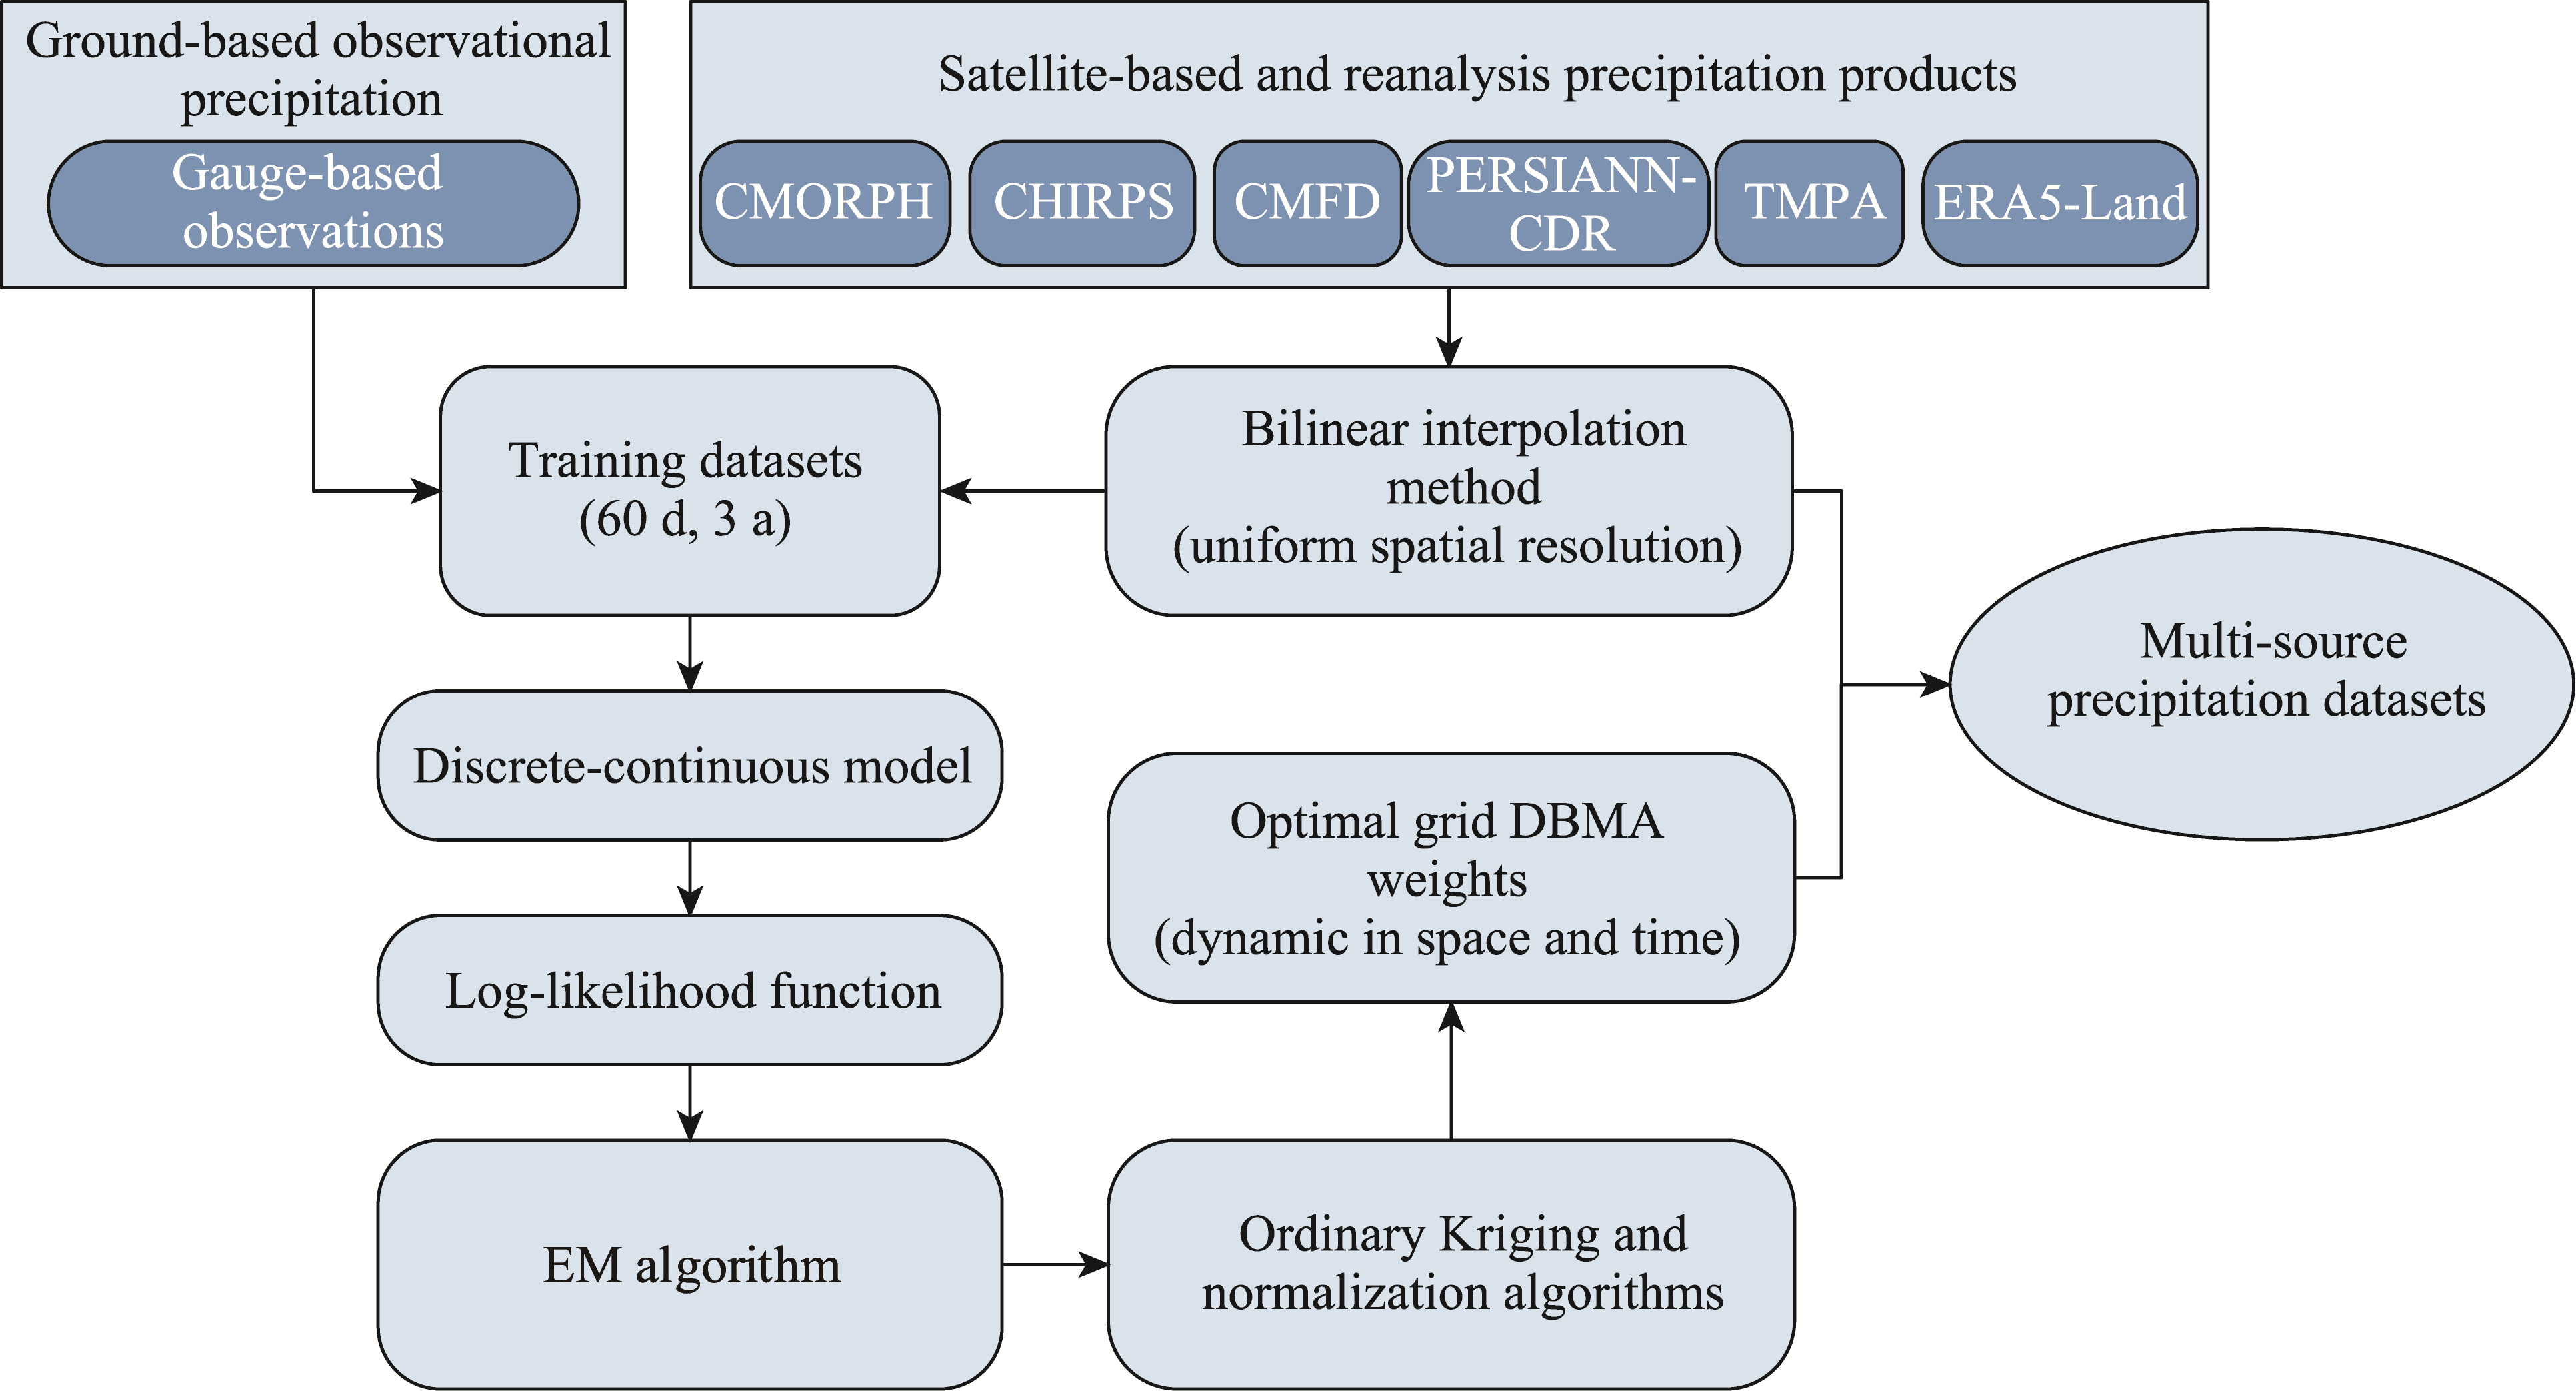
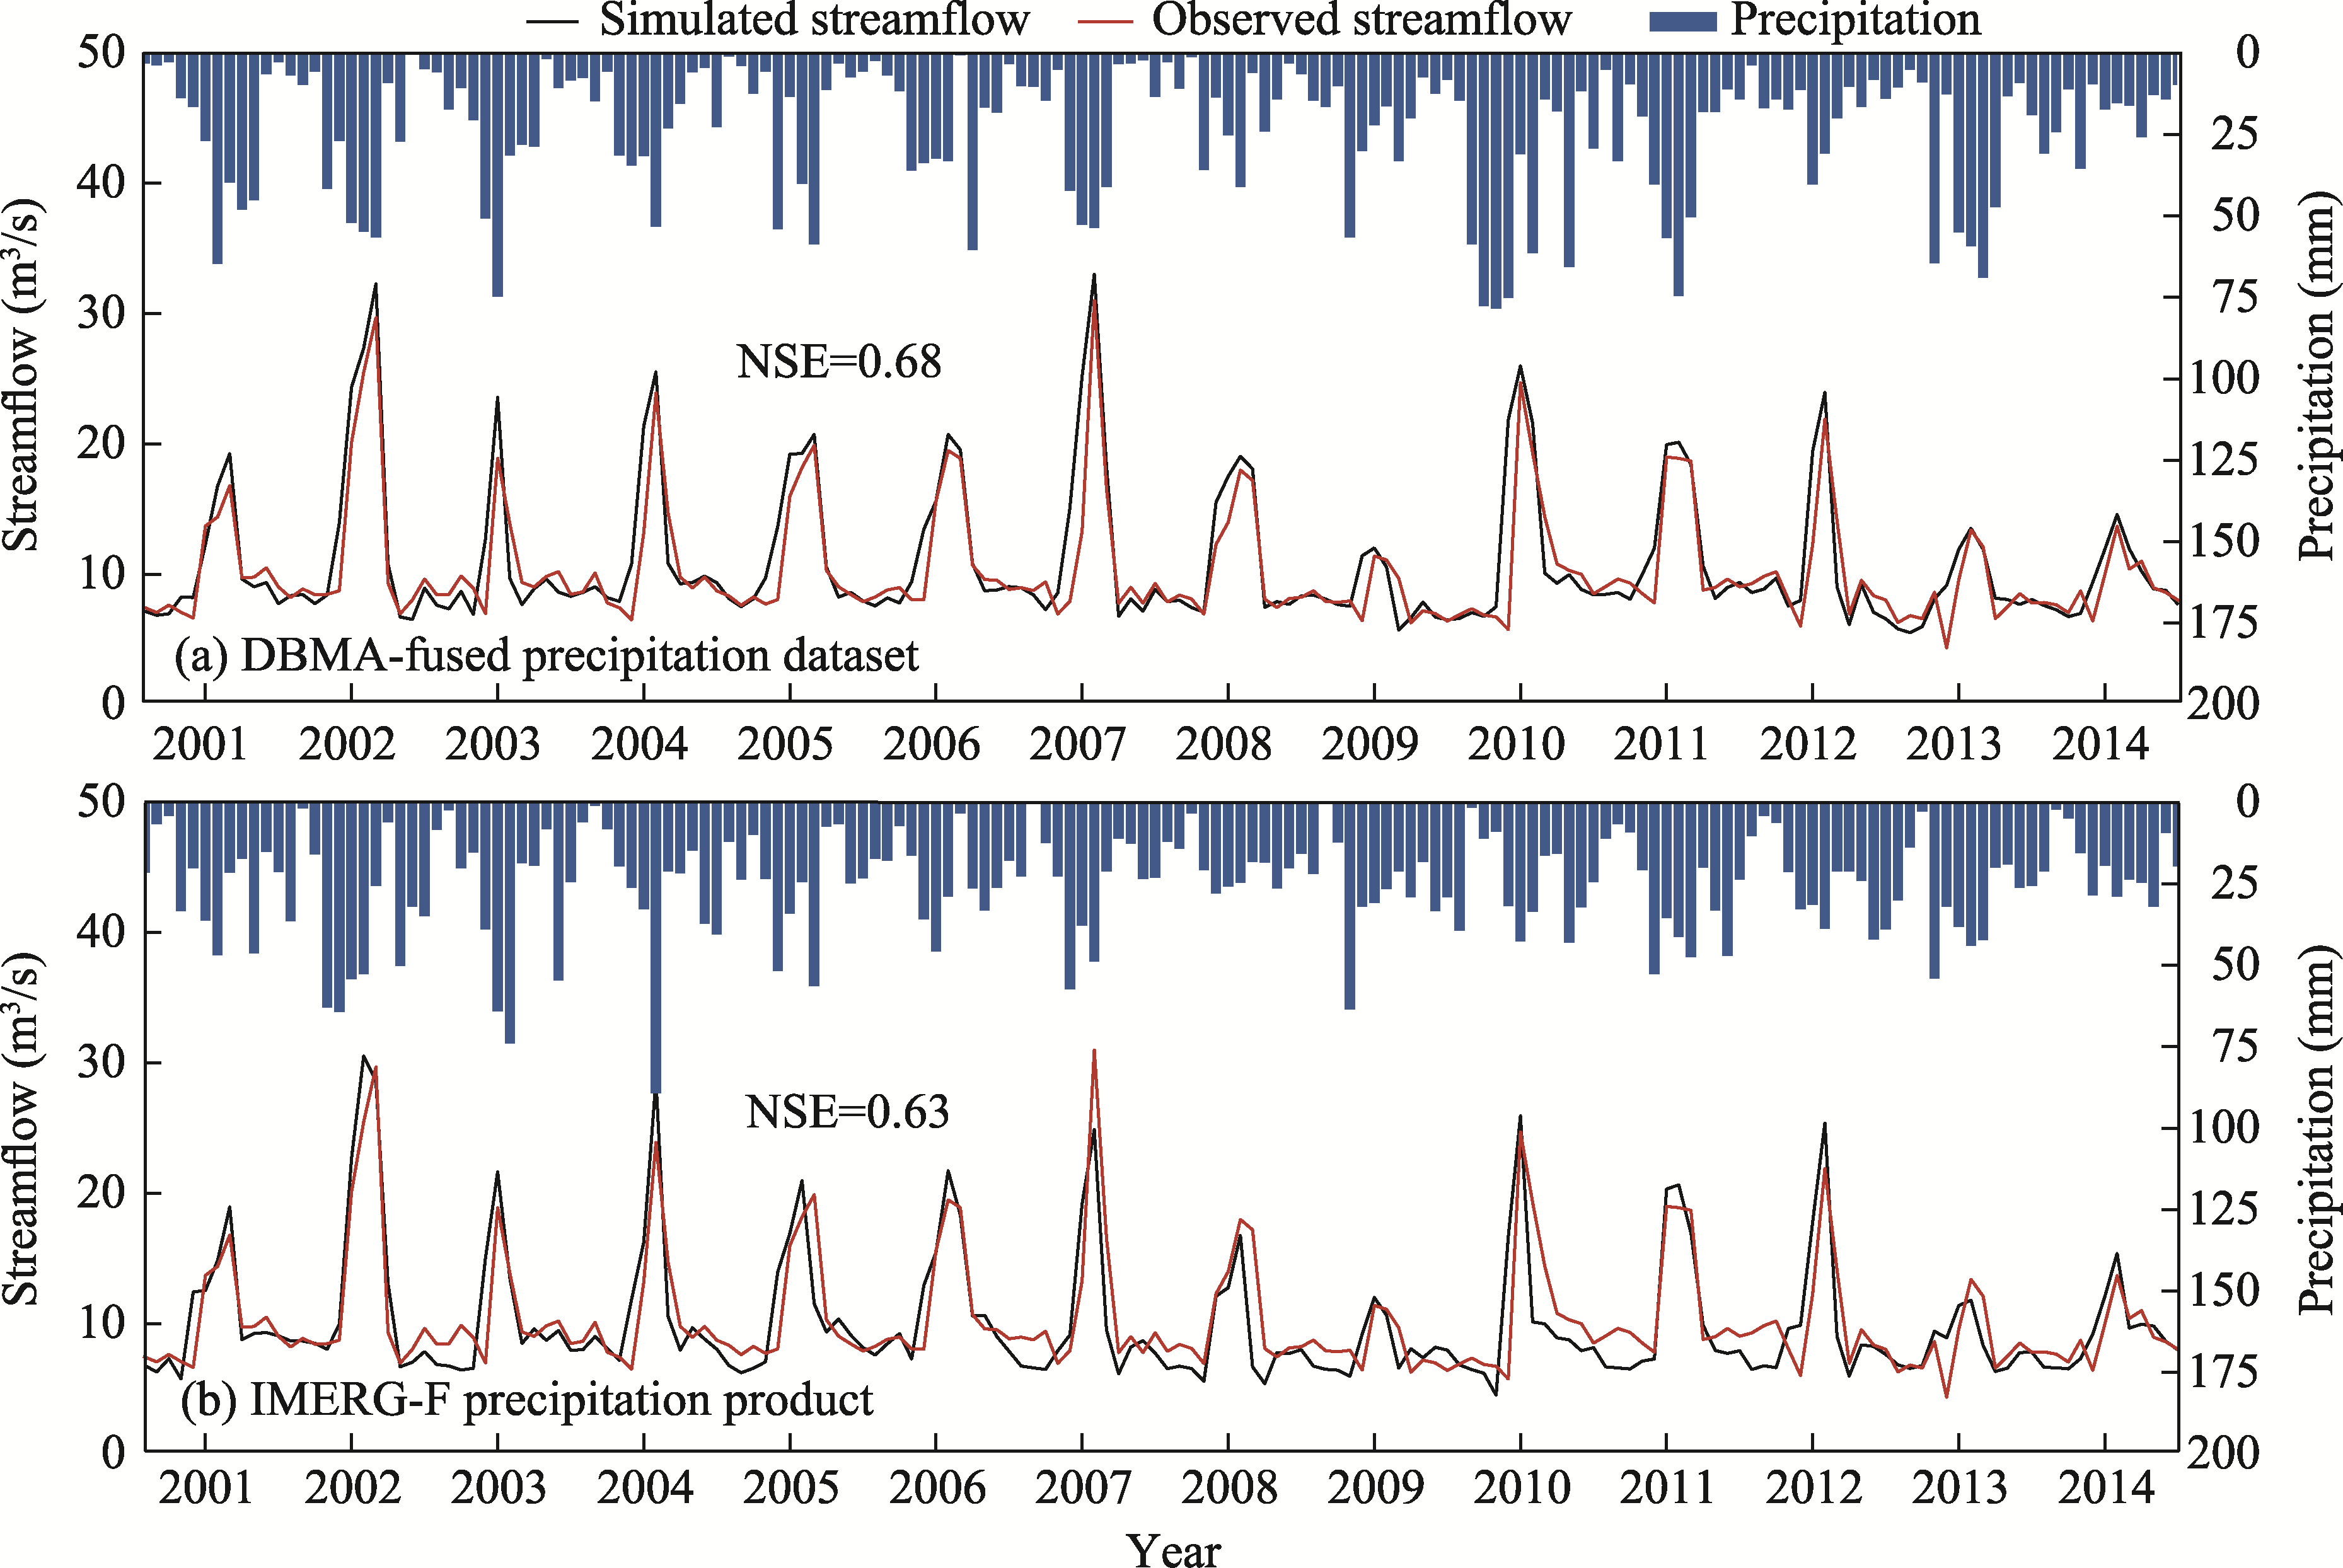
Abstract Xinjiang Uygur Autonomous Region is a typical inland arid area in China with a sparse and uneven distribution of meteorological stations, limited access to precipitation data, and significant water scarcity. Evaluating and integrating precipitation datasets from different sources to accurately characterize precipitation patterns has become a challenge to provide more accurate and alternative precipitation information for the region, which can even improve the performance of hydrological modelling. This study evaluated the applicability of widely used five satellite-based precipitation products (Climate Hazards Group InfraRed Precipitation with Station (CHIRPS), China Meteorological Forcing Dataset (CMFD), Climate Prediction Center morphing method (CMORPH), Precipitation Estimation from Remotely Sensed Information using Artificial Neural Networks-Climate Data Record (PERSIANN-CDR), and Tropical Rainfall Measuring Mission Multi-satellite Precipitation Analysis (TMPA)) and a reanalysis precipitation dataset (ECMWF Reanalysis v5-Land Dataset (ERA5-Land)) in Xinjiang using ground-based observational precipitation data from a limited number of meteorological stations. Based on this assessment, we proposed a framework that integrated different precipitation datasets with varying spatial resolutions using a dynamic Bayesian model averaging (DBMA) approach, the expectation-maximization method, and the ordinary Kriging interpolation method. The daily precipitation data merged using the DBMA approach exhibited distinct spatiotemporal variability, with an outstanding performance, as indicated by low root mean square error (RMSE=1.40 mm/d) and high Person's correlation coefficient (CC=0.67). Compared with the traditional simple model averaging (SMA) and individual product data, although the DBMA-fused precipitation data were slightly lower than the best precipitation product (CMFD), the overall performance of DBMA was more robust. The error analysis between DBMA-fused precipitation dataset and the more advanced Integrated Multi-satellite Retrievals for Global Precipitation Measurement Final (IMERG-F) precipitation product, as well as hydrological simulations in the Ebinur Lake Basin, further demonstrated the superior performance of DBMA-fused precipitation dataset in the entire Xinjiang region. The proposed framework for solving the fusion problem of multi-source precipitation data with different spatial resolutions is feasible for application in inland arid areas, and aids in obtaining more accurate regional hydrological information and improving regional water resources management capabilities and meteorological research in these regions.
|
|
Received: 10 October 2023
Published: 31 March 2024
|
|
Corresponding Authors:
*DING Jianli (E-mail: dingjl@xju.edu.cn)
|
|
|
| [1] |
Abdollahipour A, Ahmadi H, Aminnejad B. 2021. A review of downscaling methods of satellite-based precipitation estimates. Earth Science Informatics, 15(1): 1-20.
doi: 10.1007/s12145-021-00669-4
|
|
|
| [2] |
Ashouri H, Hsu K L, Sorooshian S, et al. 2015. PERSIANN-CDR: Daily precipitation climate data record from multisatellite observations for hydrological and climate studies. Bulletin of the American Meteorological Society, 96(1): 69-83.
|
|
|
| [3] |
Baez-Villanueva O M, Zambrano-Bigiarini M, Beck H E, et al. 2020. RF-MEP: A novel Random Forest method for merging gridded precipitation products and ground-based measurements. Remote Sensing of Environment, 239: 111606, doi: 10.1016/j.rse.2019.111606.
|
|
|
| [4] |
Bai X, Wang P, He Y, et al. 2021. Assessing the accuracy and drought utility of long-term satellite-based precipitation estimation products using the triple collocation approach. Journal of Hydrology, 603: 127098, doi: 10.1016/j.jhydrol.2021.127098.
|
|
|
| [5] |
Bao Q, Ding J, Han L, et al. 2022. Quantifying the effects of human activities and climate variability on runoff changes using variable infiltration capacity model. PloS ONE, 17(9): e0272576, doi: 10.1371/journal.pone.0272576.
|
|
|
| [6] |
Behrangi A, Andreadis K, Fisher J B, et al. 2014. Satellite-based precipitation estimation and its application for streamflow prediction over mountainous western U.S. basins. Journal of Applied Meteorology and Climatology, 53(12): 2823-2842.
doi: 10.1175/JAMC-D-14-0056.1
|
|
|
| [7] |
Chen F, Crow W T, Bindlish R, et al. 2018. Global-scale evaluation of SMAP, SMOS and ASCAT soil moisture products using triple collocation. Remote Sensing of Environment, 214: 1-13.
doi: 10.1016/j.rse.2018.05.008
pmid: 32601510
|
|
|
| [8] |
Chen F C, Jahanshahi M R. 2018. NB-CNN: Deep learning-based crack detection using convolutional neural network and Naïve Bayes data fusion. IEEE Transactions on Industrial Electronics, 65(5): 4392-4400.
doi: 10.1109/TIE.2017.2764844
|
|
|
| [9] |
Chen Y, Sharma S, Zhou X, et al. 2021. Spatial performance of multiple reanalysis precipitation datasets on the southern slope of Central Himalaya. Atmospheric Research, 250: 105365, doi: 10.1016/j.atmosres.2020.105365.
|
|
|
| [10] |
Dinku T, Funk C, Peterson P, et al. 2018. Validation of the CHIRPS satellite rainfall estimates over eastern Africa. Quarterly Journal of the Royal Meteorological Society, 144(S1): 292-312.
doi: 10.1002/qj.2018.144.issue-S1
|
|
|
| [11] |
Ebrahimi S, Chen C, Chen Q, et al. 2017. Effects of temporal scales and space mismatches on the TRMM 3B 42 v7 precipitation product in a remote mountainous area. Hydrological Processes, 31(24): 4315-4327.
doi: 10.1002/hyp.v31.24
|
|
|
| [12] |
Funk C, Peterson P, Landsfeld M, et al. 2015. The climate hazards infrared precipitation with stations—a new environmental record for monitoring extremes. Scientific Data, 2(1): 1-21.
|
|
|
| [13] |
Gebregiorgis A S, Hossain F. 2015. How well can we estimate error variance of satellite precipitation data around the world? Atmospheric Research, 154: 39-59.
doi: 10.1016/j.atmosres.2014.11.005
|
|
|
| [14] |
Guo H, Bao A, Ndayisaba F, et al. 2017. Systematical evaluation of satellite precipitation estimates over central Asia using an improved error-component procedure. Journal of Geophysical Research: Atmospheres, 122(20): 10906-10927.
|
|
|
| [15] |
Hasan M A, Mia M B, Khan M R, et al. 2023. Temporal changes in land cover, land surface temperature, soil moisture, and evapotranspiration using remote sensing techniques—a case study of Kutupalong Rohingya Refugee Camp in Bangladesh. Journal of Geovisualization and Spatial Analysis, 7(1): 11, doi: 10.1007/s41651-023-00140-6.
|
|
|
| [16] |
He J, Yang K, Tang W, et al. 2020. The first high-resolution meteorological forcing dataset for land process studies over China. Scientific data, 7(1): 25, doi: 10.1038/s41597-020-0369-y.
pmid: 31964891
|
|
|
| [17] |
Hoeting J A, Madigan D, Raftery A E, et al. 1998. Bayesian model averaging. Proceedings of the AAAI Workshop on Integrating Multiple Learned Models, 335: 77-83.
|
|
|
| [18] |
Hong Y, Hsu K L, Sorooshian S, et al. 2004. Precipitation estimation from remotely sensed imagery using an artificial neural network cloud classification system. Journal of Applied Meteorology, 43(12): 1834-1853.
doi: 10.1175/JAM2173.1
|
|
|
| [19] |
Hou A Y, Kakar R K, Neeck S, et al. 2014. The global precipitation measurement mission. Bulletin of the American Meteorological Society, 95(5): 701-722.
doi: 10.1175/BAMS-D-13-00164.1
|
|
|
| [20] |
Hu W, Yao J, He Q, et al. 2021. Changes in precipitation amounts and extremes across Xinjiang (northwest China) and their connection to climate indices. PeerJ, 9: e10792, doi: 10.7717/peerj.10792.
|
|
|
| [21] |
Hu Z, Hu Q, Zhang C, et al. 2016. Evaluation of reanalysis, spatially interpolated and satellite remotely sensed precipitation data sets in Central Asia. Journal of Geophysical Research: Atmospheres, 121(10): 5648-5663.
doi: 10.1002/jgrd.v121.10
|
|
|
| [22] |
Huffman G J, Bolvin D T, Nelkin E J, et al. 2007. The TRMM Multisatellite Precipitation Analysis (TMPA): quasi-global, multiyear, combined-sensor precipitation estimates at fine scales. Journal of Hydrometeorology, 8(1): 38-55.
doi: 10.1175/JHM560.1
|
|
|
| [23] |
Jiang S, Ren L, Hong Y, et al. 2012. Comprehensive evaluation of multi-satellite precipitation products with a dense rain gauge network and optimally merging their simulated hydrological flows using the Bayesian model averaging method. Journal of Hydrology, 452-453: 213-225.
|
|
|
| [24] |
Joyce R J, Janowiak J E, Arkin P A, et al. 2004. CMORPH: A method that produces global precipitation estimates from passive microwave and infrared data at high spatial and temporal resolution. Journal of Applied Hydrometeorology, 5(3): 487-503.
|
|
|
| [25] |
Katipoğlu O M. 2022. Spatial analysis of seasonal precipitation using various interpolation methods in the Euphrates Basin, Turkey. Acta Geophysica, 70(2): 859-878.
doi: 10.1007/s11600-022-00756-0
|
|
|
| [26] |
Kharaghani H, Etemadfard H, Golmohammadi M. 2023. Spatio-temporal analysis of precipitation effects on bicycle-sharing systems with tensor approach. Journal of Geovisualization and Spatial Analysis, 7(2): 30, doi: 10.1007/s41651-023-00161-1.
|
|
|
| [27] |
Lanza L G, Stagi L. 2008. Certified accuracy of rainfall data as a standard requirement in scientific investigations. Advances in Geosciences, 16: 43-48.
doi: 10.5194/adgeo-16-43-2008
|
|
|
| [28] |
Li X, Tsai F T C. 2009. Bayesian model averaging for groundwater head prediction and uncertainty analysis using multimodel and multimethod. Water Resources Research, 45(9): W09403, doi: 10.1029/2008WR007488.
|
|
|
| [29] |
Liu J, Zhou Y, Lu F, et al. 2023. Evaluating satellite- and reanalysis-based precipitation products over the Qinghai-Tibetan Plateau in the perspective of a new error-index system. International Journal of Climatology, 43(5): 2200-2219.
doi: 10.1002/joc.v43.5
|
|
|
| [30] |
Ma Y, Hong Y, Chen Y, et al. 2018. Performance of optimally merged multisatellite precipitation products using the dynamic Bayesian model averaging scheme over the Tibetan Plateau. Journal of Geophysical Research: Atmospheres, 123(2): 814-834.
doi: 10.1002/jgrd.v123.2
|
|
|
| [31] |
Mei Y, Anagnostou E N, Nikolopoulos E I, et al. 2014. Error analysis of satellite precipitation products in mountainous basins. Journal of Hydrometeorology, 15(5): 1778-1793.
doi: 10.1175/JHM-D-13-0194.1
|
|
|
| [32] |
Mosaffa H, Shirvani A, Khalili D, et al. 2020. Post and near real-time satellite precipitation products skill over Karkheh River Basin in Iran. International Journal of Remote Sensing, 41(17): 6484-6502.
doi: 10.1080/01431161.2020.1739352
|
|
|
| [33] |
Muñoz-Sabater J, Dutra E, Agustí-Panareda A, et al. 2021. ERA5-Land: A state-of-the-art global reanalysis dataset for land applications. Earth System Science Data, 13(9): 4349-4383.
doi: 10.5194/essd-13-4349-2021
|
|
|
| [34] |
Qin R, Zhao Z, Xu J, et al. 2022. HRLT: a high-resolution (1 d, 1 km) and long-term (1961-2019) gridded dataset for surface temperature and precipitation across China. Earth System Science Data, 14(11): 4793-4810.
doi: 10.5194/essd-14-4793-2022
|
|
|
| [35] |
Raftery A E, Gneiting T, Balabdaoui F, et al. 2005. Using Bayesian model averaging to calibrate forecast ensemble. Monthly Weather Review, 133(5): 1155-1174.
doi: 10.1175/MWR2906.1
|
|
|
| [36] |
Rings J, Vrugt J A, Schoups G, et al. 2012. Bayesian model averaging using particle filtering and Gaussian mixture modeling: Theory, concepts, and simulation experiments. Water Resources Research, 48(5): W05520, doi: 10.1029/2011WR011607.
|
|
|
| [37] |
Rogelis M C, Werner M. 2018. Streamflow forecasts from WRF precipitation for flood early warning in mountain tropical areas. Hydrology and Earth System Sciences, 22(1): 853-870.
doi: 10.5194/hess-22-853-2018
|
|
|
| [38] |
Schöniger A, Wöhling T, Samaniego L, et al. 2014. Model selection on solid ground: Rigorous comparison of nine ways to evaluate Bayesian model evidence. Water Resources Research, 50(12): 9484-9513.
pmid: 25745272
|
|
|
| [39] |
Shahid M, Rahman K U, Haider S, et al. 2021. Assessing the potential and hydrological usefulness of the CHIRPS precipitation dataset over a complex topography in Pakistan. Hydrological Sciences Journal, 66(11): 1664-1684.
doi: 10.1080/02626667.2021.1957476
|
|
|
| [40] |
Shen Y, Xiong A. 2016. Validation and comparison of a new gauge-based precipitation analysis over mainland China. International Journal of Climatology, 36(1): 252-265.
doi: 10.1002/joc.4341
|
|
|
| [41] |
Sloughter J M L, Raftery A E, Gneiting T, et al. 2007. Probabilistic quantitative precipitation forecasting using Bayesian model averaging. Monthly Weather Review, 135(9): 3209-3220.
doi: 10.1175/MWR3441.1
|
|
|
| [42] |
Sun S, Wang J, Shi W, et al. 2021. Capacity of the PERSIANN-CDR product in detecting extreme precipitation over Huai River Basin, China. Remote Sensing, 13(9): 1747, doi: 10.3390/rs13091747.
|
|
|
| [43] |
Tadesse K E, Melesse A M, Awas A A, et al. 2022. Evaluation of merging method for CHIRP satellite rainfall estimate over Wabi Shebelle River Basin, Ethiopia. Journal of the Indian Society of Remote Sensing, 50(11): 2125-2138.
doi: 10.1007/s12524-022-01584-x
|
|
|
| [44] |
Tan M L, Santo H. 2018. Comparison of GPM IMERG, TMPA 3B42 and PERSIANN-CDR satellite precipitation products over Malaysia. Atmospheric Research, 202: 63-76.
doi: 10.1016/j.atmosres.2017.11.006
|
|
|
| [45] |
Tang G, Long D, Hong Y. 2016. Systematic anomalies over inland water bodies of high mountain Asia in TRMM precipitation estimates: no longer a problem for the GPM era? IEEE Geoscience and Remote Sensing Letters, 13(12): 1762-1766.
doi: 10.1109/LGRS.2016.2606769
|
|
|
| [46] |
Tang G, Clark M P, Papalexiou S M, et al. 2020. Have satellite precipitation products improved over last two decades? A comprehensive comparison of GPM IMERG with nine satellite and reanalysis datasets. Remote Sensing of Environment, 240: 111697, doi: 10.1016/j.rse.2020.111697.
|
|
|
| [47] |
Ur Rahman K, Shang S, Shahid M, et al. 2019. An appraisal of dynamic Bayesian model averaging-based merged multi-Satellite precipitation datasets over complex topography and the diverse climate of Pakistan. Remote Sensing, 12(1): 10, doi: 10.3390/rs12010010.
|
|
|
| [48] |
Wang C, Si J, Zhao C, et al. 2022. Adequacy of satellite derived data for streamflow simulation in three Hexi inland river basins, Northwest China. Atmospheric Research, 274: 106203, doi: 10.1016/j.atmosres.2022.106203.
|
|
|
| [49] |
Wang Q, Xia J, She D, et al. 2021. Assessment of four latest long-term satellite-based precipitation products in capturing the extreme precipitation and streamflow across a humid region of southern China. Atmospheric Research, 257: 105554, doi: 10.1016/j.atmosres.2021.105554.
|
|
|
| [50] |
Wang Z, Zhong R, Lai C, et al. 2017. Evaluation of the GPM IMERG satellite-based precipitation products and the hydrological utility. Atmospheric Research, 196: 151-163.
doi: 10.1016/j.atmosres.2017.06.020
|
|
|
| [51] |
Wei L, Jiang S, Dong J, et al. 2023a. Fusion of gauge-based, reanalysis, and satellite precipitation products using Bayesian model averaging approach: Determination of the influence of different input sources. Journal of Hydrology, 618: 129234, doi: 10.1016/j.jhydrol.2023.129234.
|
|
|
| [52] |
Wei Y, Law A W K, Yang C. 2023b. Probabilistic optimal interpolation for data assimilation between machine learning model predictions and real time observations. Journal of Computational Science, 67: 101977, doi: 10.1016/j.jocs.2023.101977.
|
|
|
| [53] |
Wu Y, Guo L, Zheng H, et al. 2019. Hydroclimate assessment of gridded precipitation products for the Tibetan Plateau. Science of the Total Environment, 660: 1555-1564.
doi: 10.1016/j.scitotenv.2019.01.119
|
|
|
| [54] |
Xu L, Chen N, Moradkhani H, et al. 2020. Improving global monthly and daily precipitation estimation by fusing gauge observations, remote sensing, and reanalysis data sets. Water Resources Research, 56(3): e2019WR026444, doi: 10.1029/2019wr026444.
|
|
|
| [55] |
Yang T, Li Q, Chen X, et al. 2020. Spatiotemporal variability of the precipitation concentration and diversity in Central Asia. Atmospheric Research, 241: 104954, doi: 10.1016/j.atmosres.2020.104954.
|
|
|
| [56] |
Yin G, Li L, Meng X, et al. 2017. A research of precipitation trend and fluctuation in Xinjiang from 1979 to 2013. Journal of North China University of Water Resources and Electric Power, 38(5): 19-27. (in Chinese)
|
|
|
| [57] |
Yin J, Guo S, Gu L, et al. 2021. Blending multi-satellite, atmospheric reanalysis and gauge precipitation products to facilitate hydrological modelling. Journal of Hydrology, 593: 125878, doi: 10.1016/j.jhydrol.2020.125878.
|
|
|
| [58] |
Yumnam K, Guntu R K, Rathinasamy M, et al. 2022. Quantile-based Bayesian Model Averaging approach towards merging of precipitation products. Journal of Hydrology, 604: 127206, doi: 10.1016/j.jhydrol.2021.127206.
|
|
|
| [59] |
Zambrano F, Wardlow B, Tadesse T, et al. 2017. Evaluating satellite-derived long-term historical precipitation datasets for drought monitoring in Chile. Atmospheric Research, 186: 26-42.
doi: 10.1016/j.atmosres.2016.11.006
|
|
|
| [60] |
Zhang C, Chen X, Shao H, et al. 2018. Evaluation and intercomparison of high-resolution satellite precipitation estimates—GPM, TRMM, and CMORPH in the Tianshan Mountain Area. Remote Sensing, 10(10): 1543, doi: 10.3390/rs10101543.
|
|
|
| [61] |
Zhang Y, Long A, Lv T, et al. 2022. Trends, cycles, and spatial distribution of the precipitation, potential evapotranspiration and aridity index in Xinjiang, China. Water, 15(1): 62, doi: 10.3390/w15010062.
|
|
|
|
Viewed |
|
|
|
Full text
|
|
|
|
|
Abstract
|
|
|
|
|
Cited |
|
|
|
|
| |
Shared |
|
|
|
|
| |
Discussed |
|
|
|
|