| Research article |
|

|
|
|
| Comparison of isotope-based linear and Bayesian mixing models in determining moisture recycling ratio |
XIAO Yanqiong1, WANG Liwei2, WANG Shengjie1,*( ), Kei YOSHIMURA3, SHI Yudong1, LI Xiaofei4, Athanassios A ARGIRIOU5, ZHANG Mingjun1 ), Kei YOSHIMURA3, SHI Yudong1, LI Xiaofei4, Athanassios A ARGIRIOU5, ZHANG Mingjun1 |
1Key Laboratory of Resource Environment and Sustainable Development of Oasis of Gansu Province, College of Geography and Environmental Science, Northwest Normal University, Lanzhou 730070, China
2Northwest Institute of Eco-Environment and Resources, Chinese Academy of Sciences, Lanzhou 730000, China
3Atmosphere and Ocean Research Institute, University of Tokyo, Kashiwa 277-8568, Japan
4School of Environmental Science and Engineering, Shaanxi University of Science and Technology, Xi'an 710021, China
5Laboratory of Atmospheric Physics, Department of Physics, University of Patras, Patras GR-26500, Greece |
|
|
|
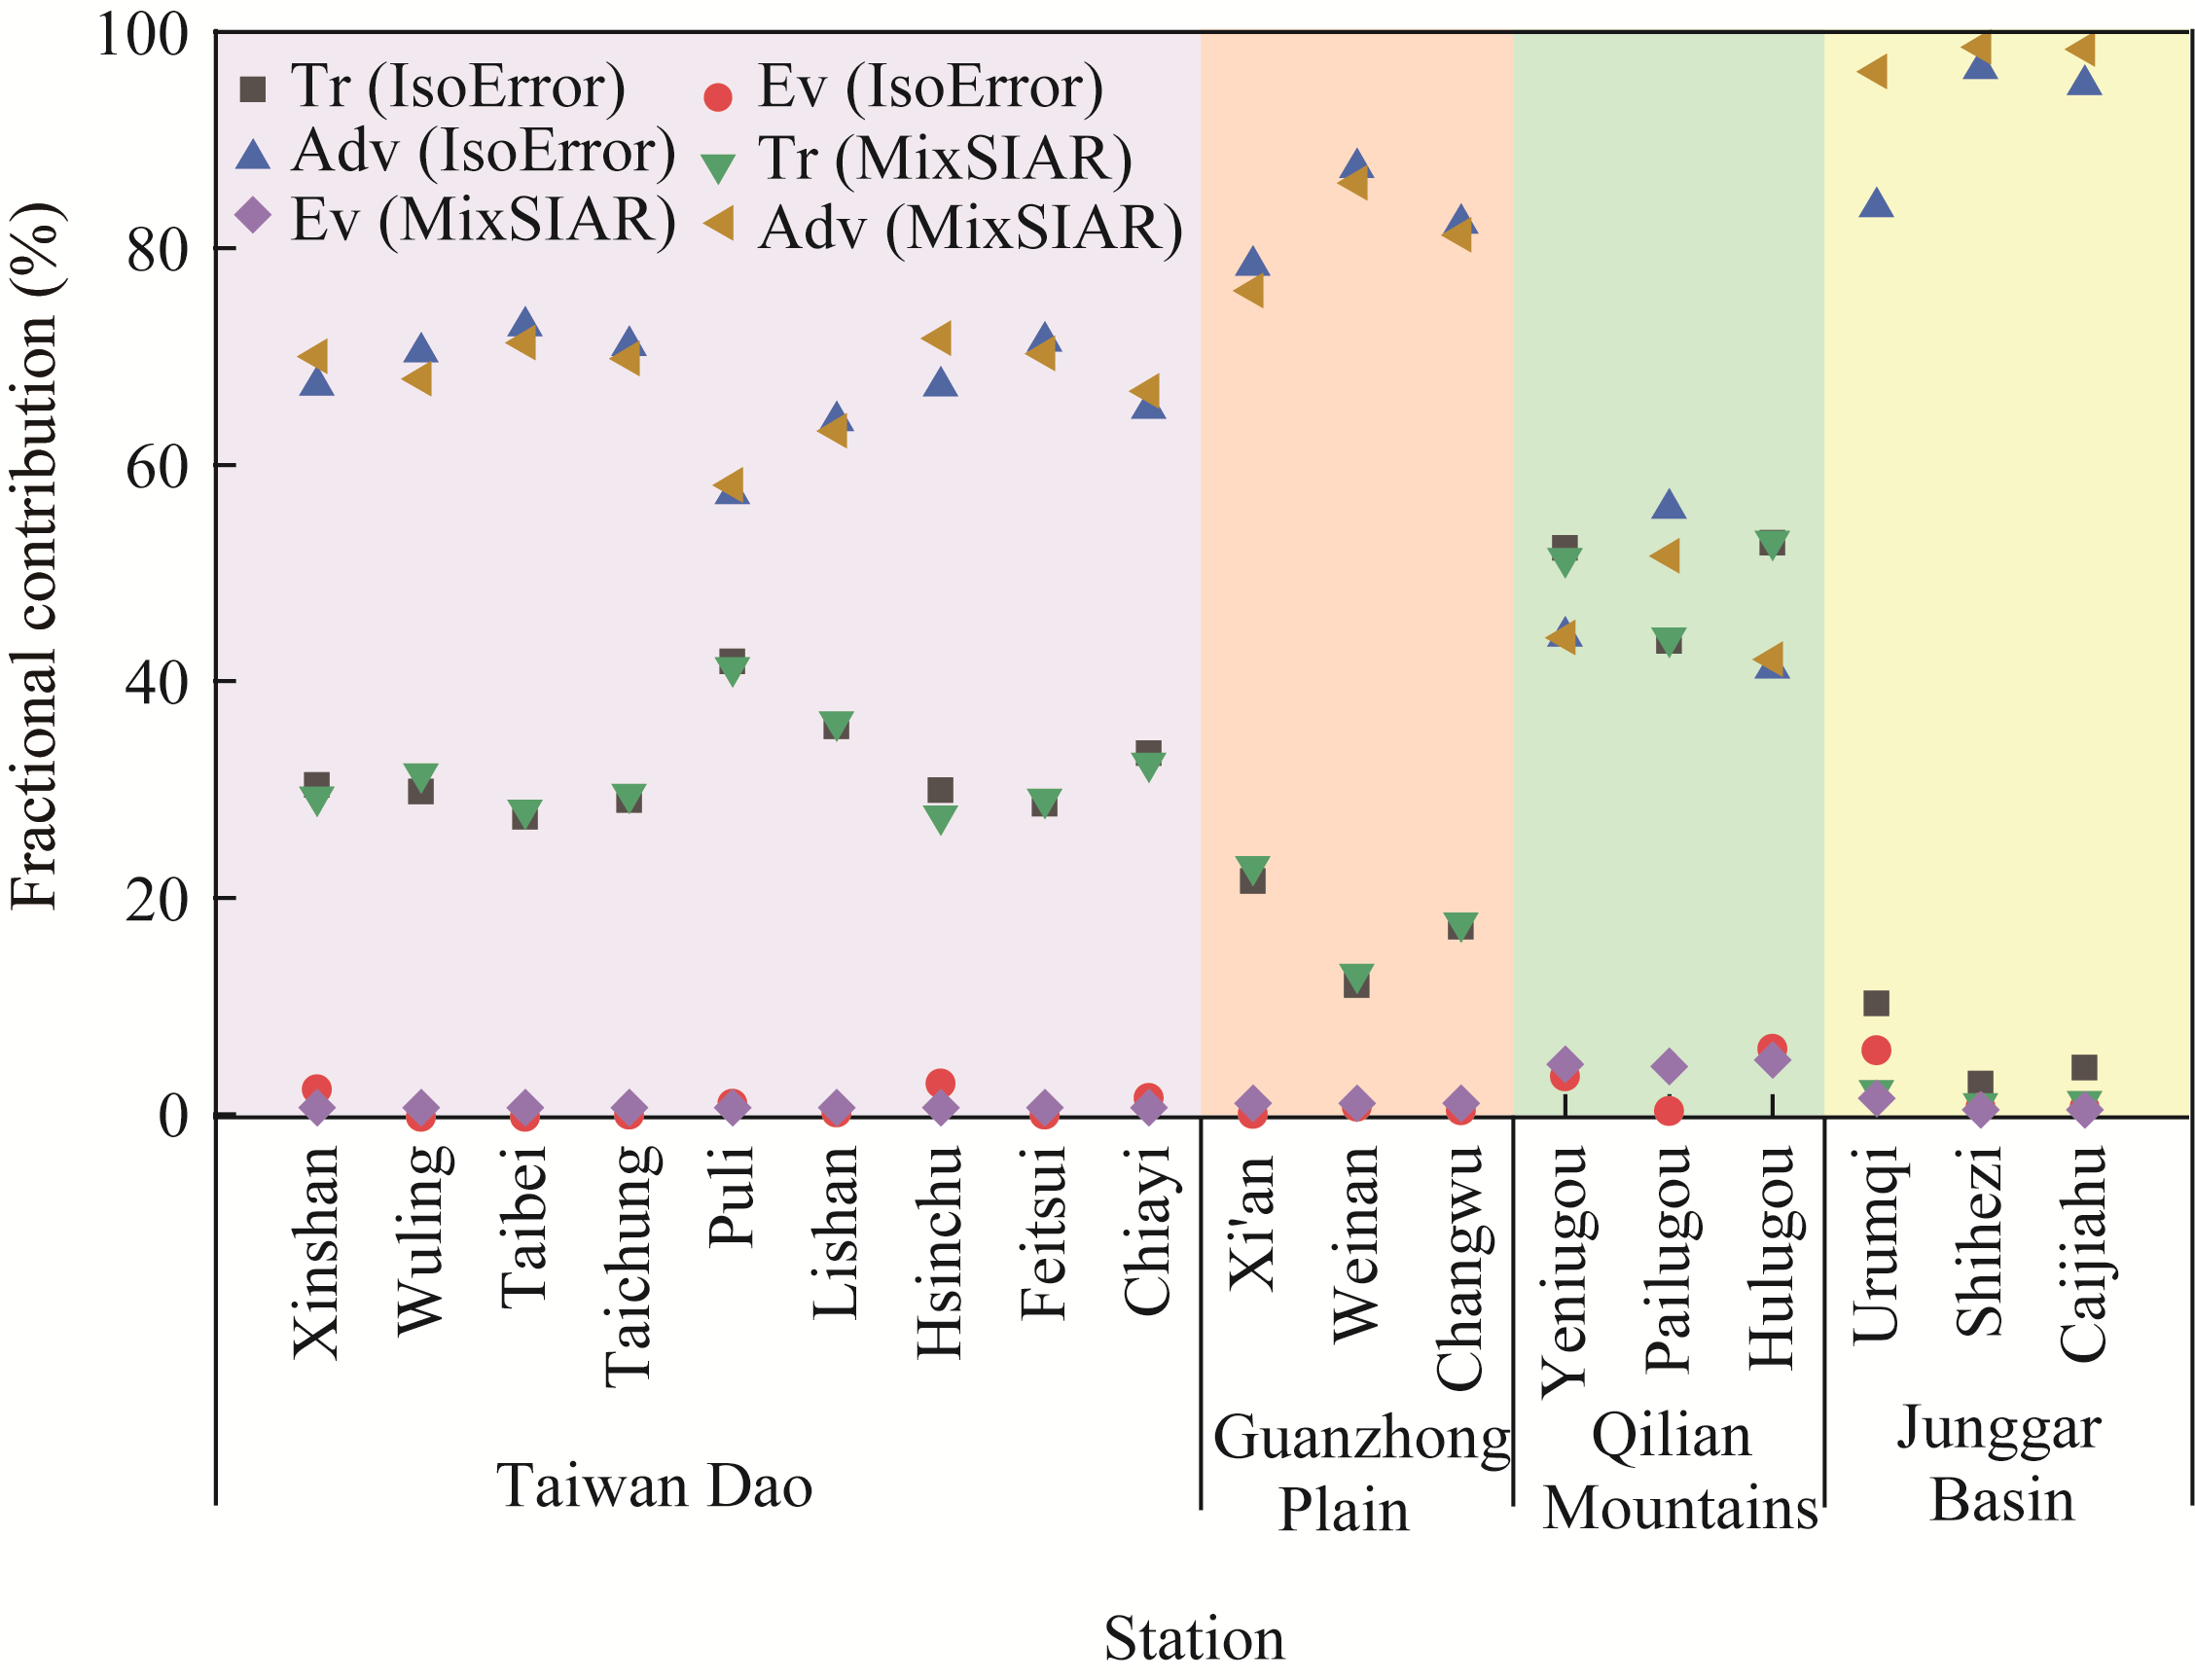
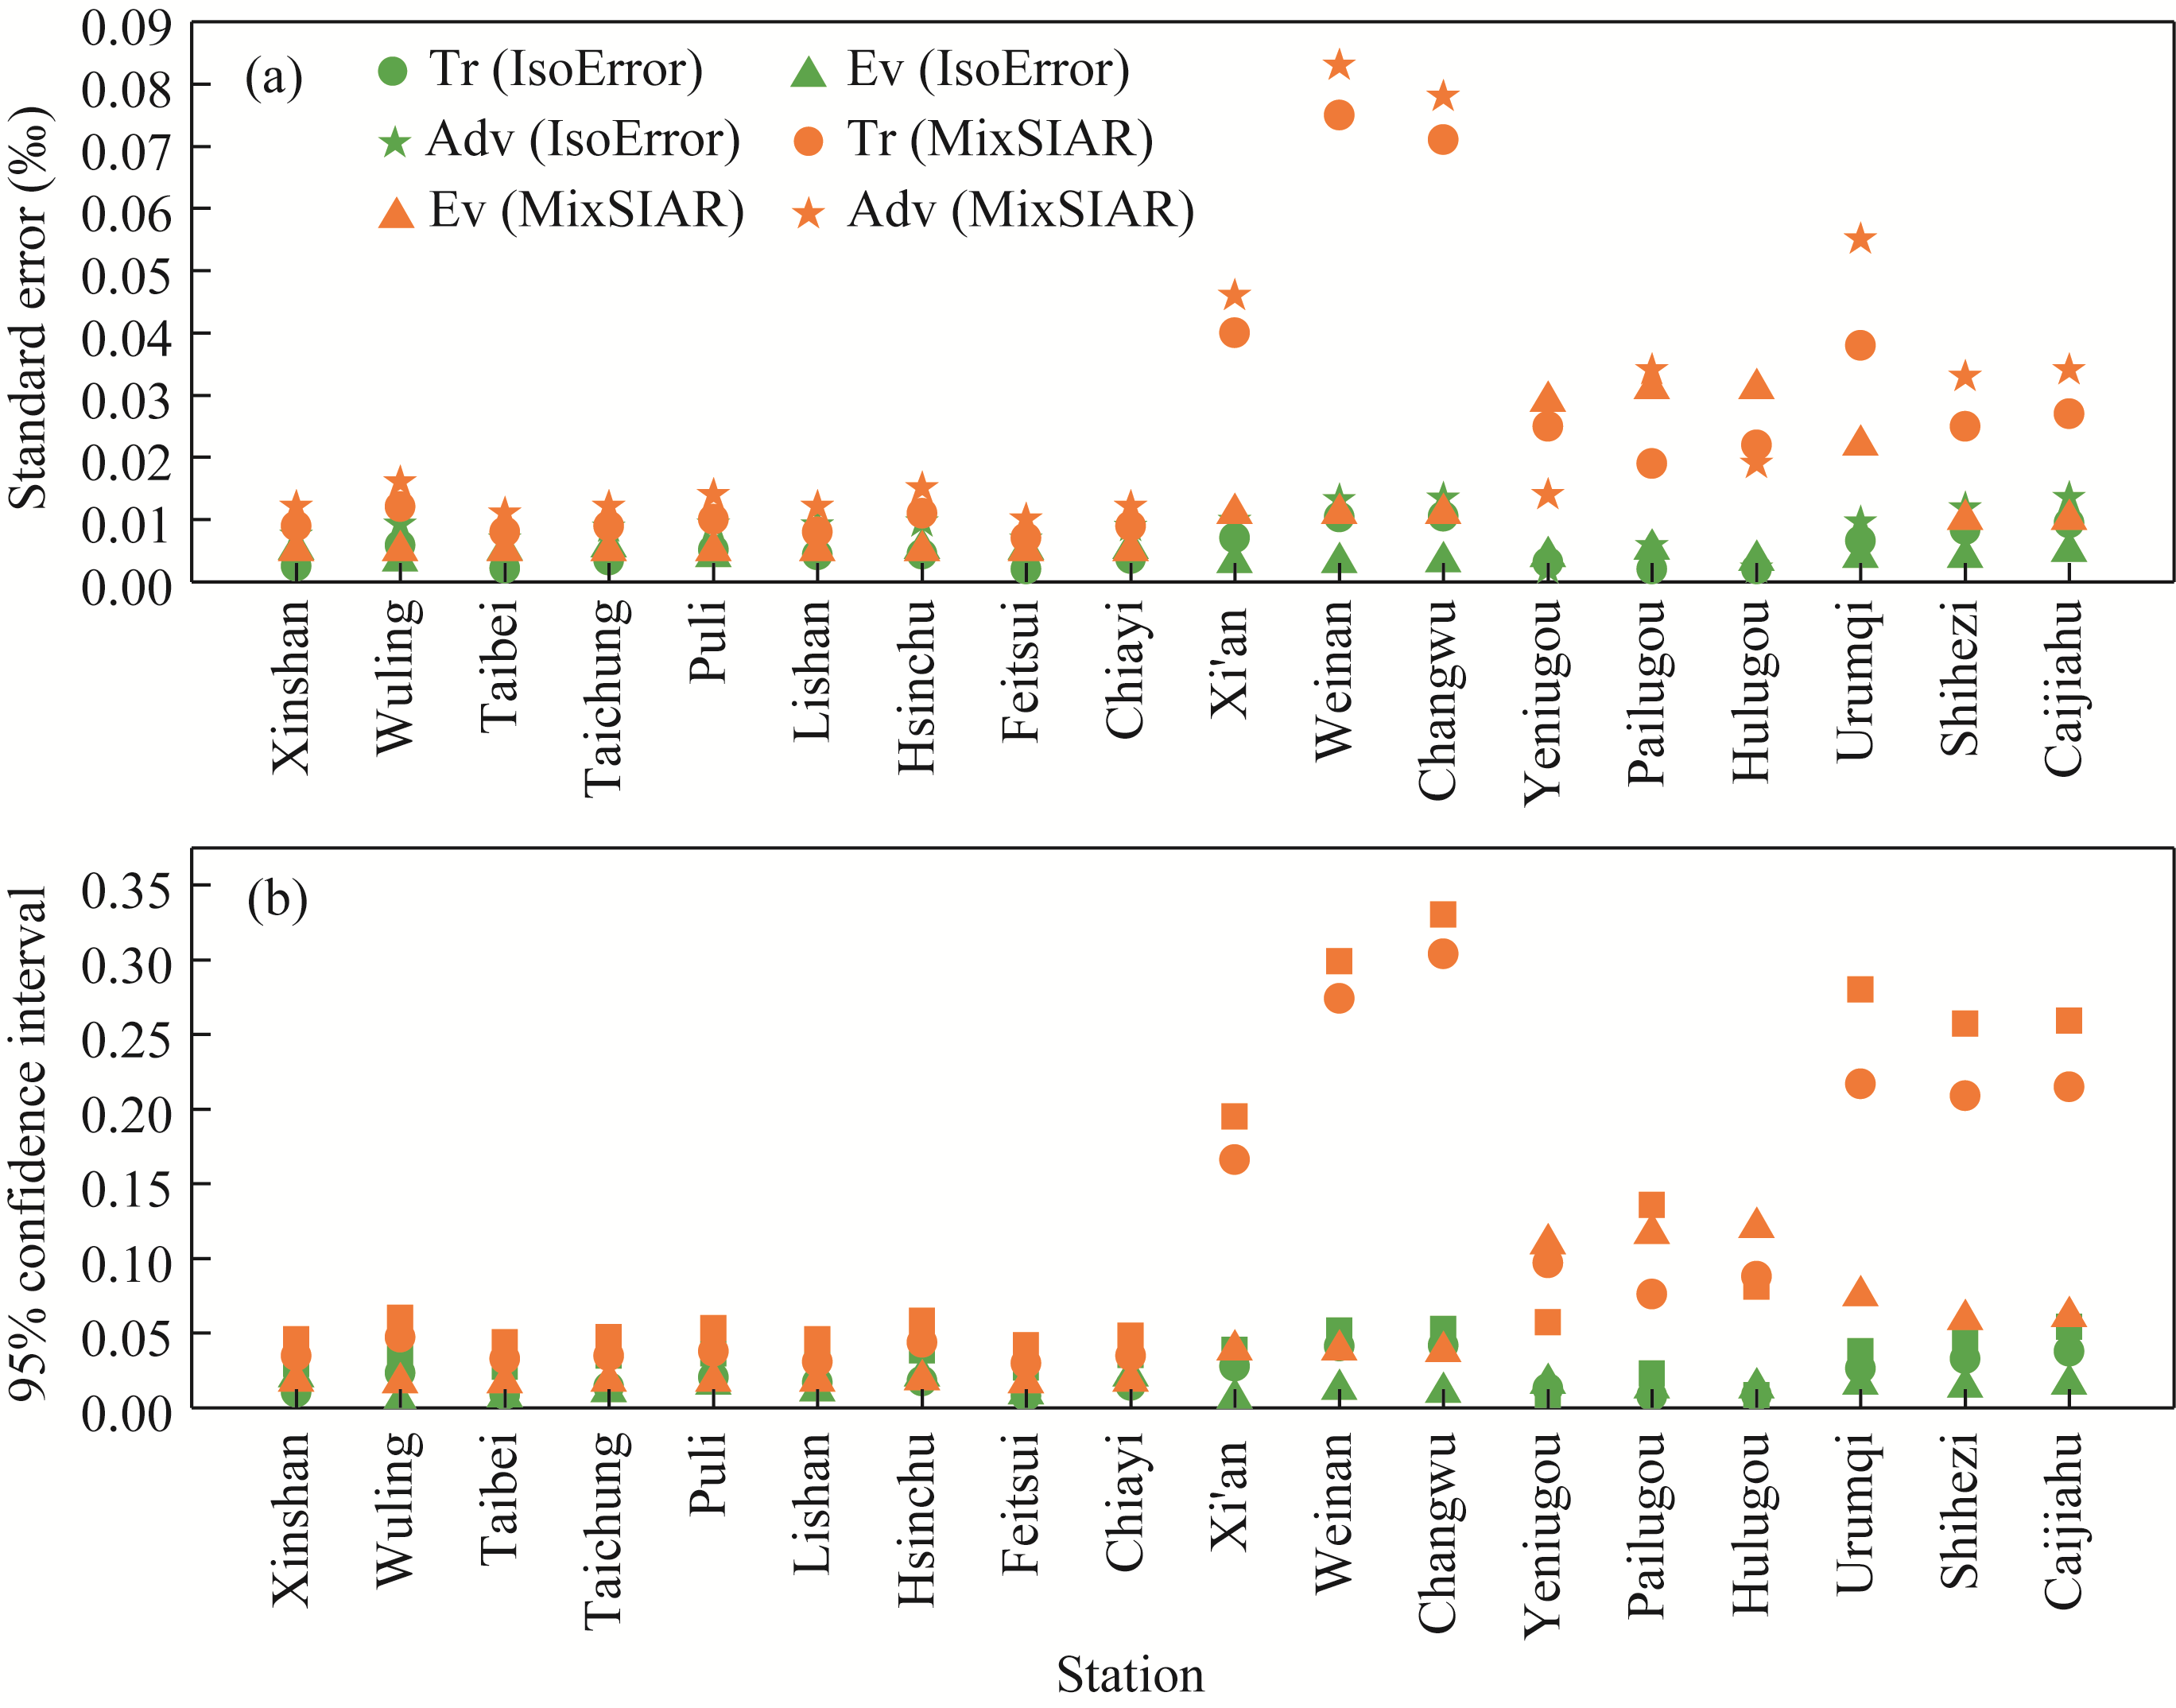
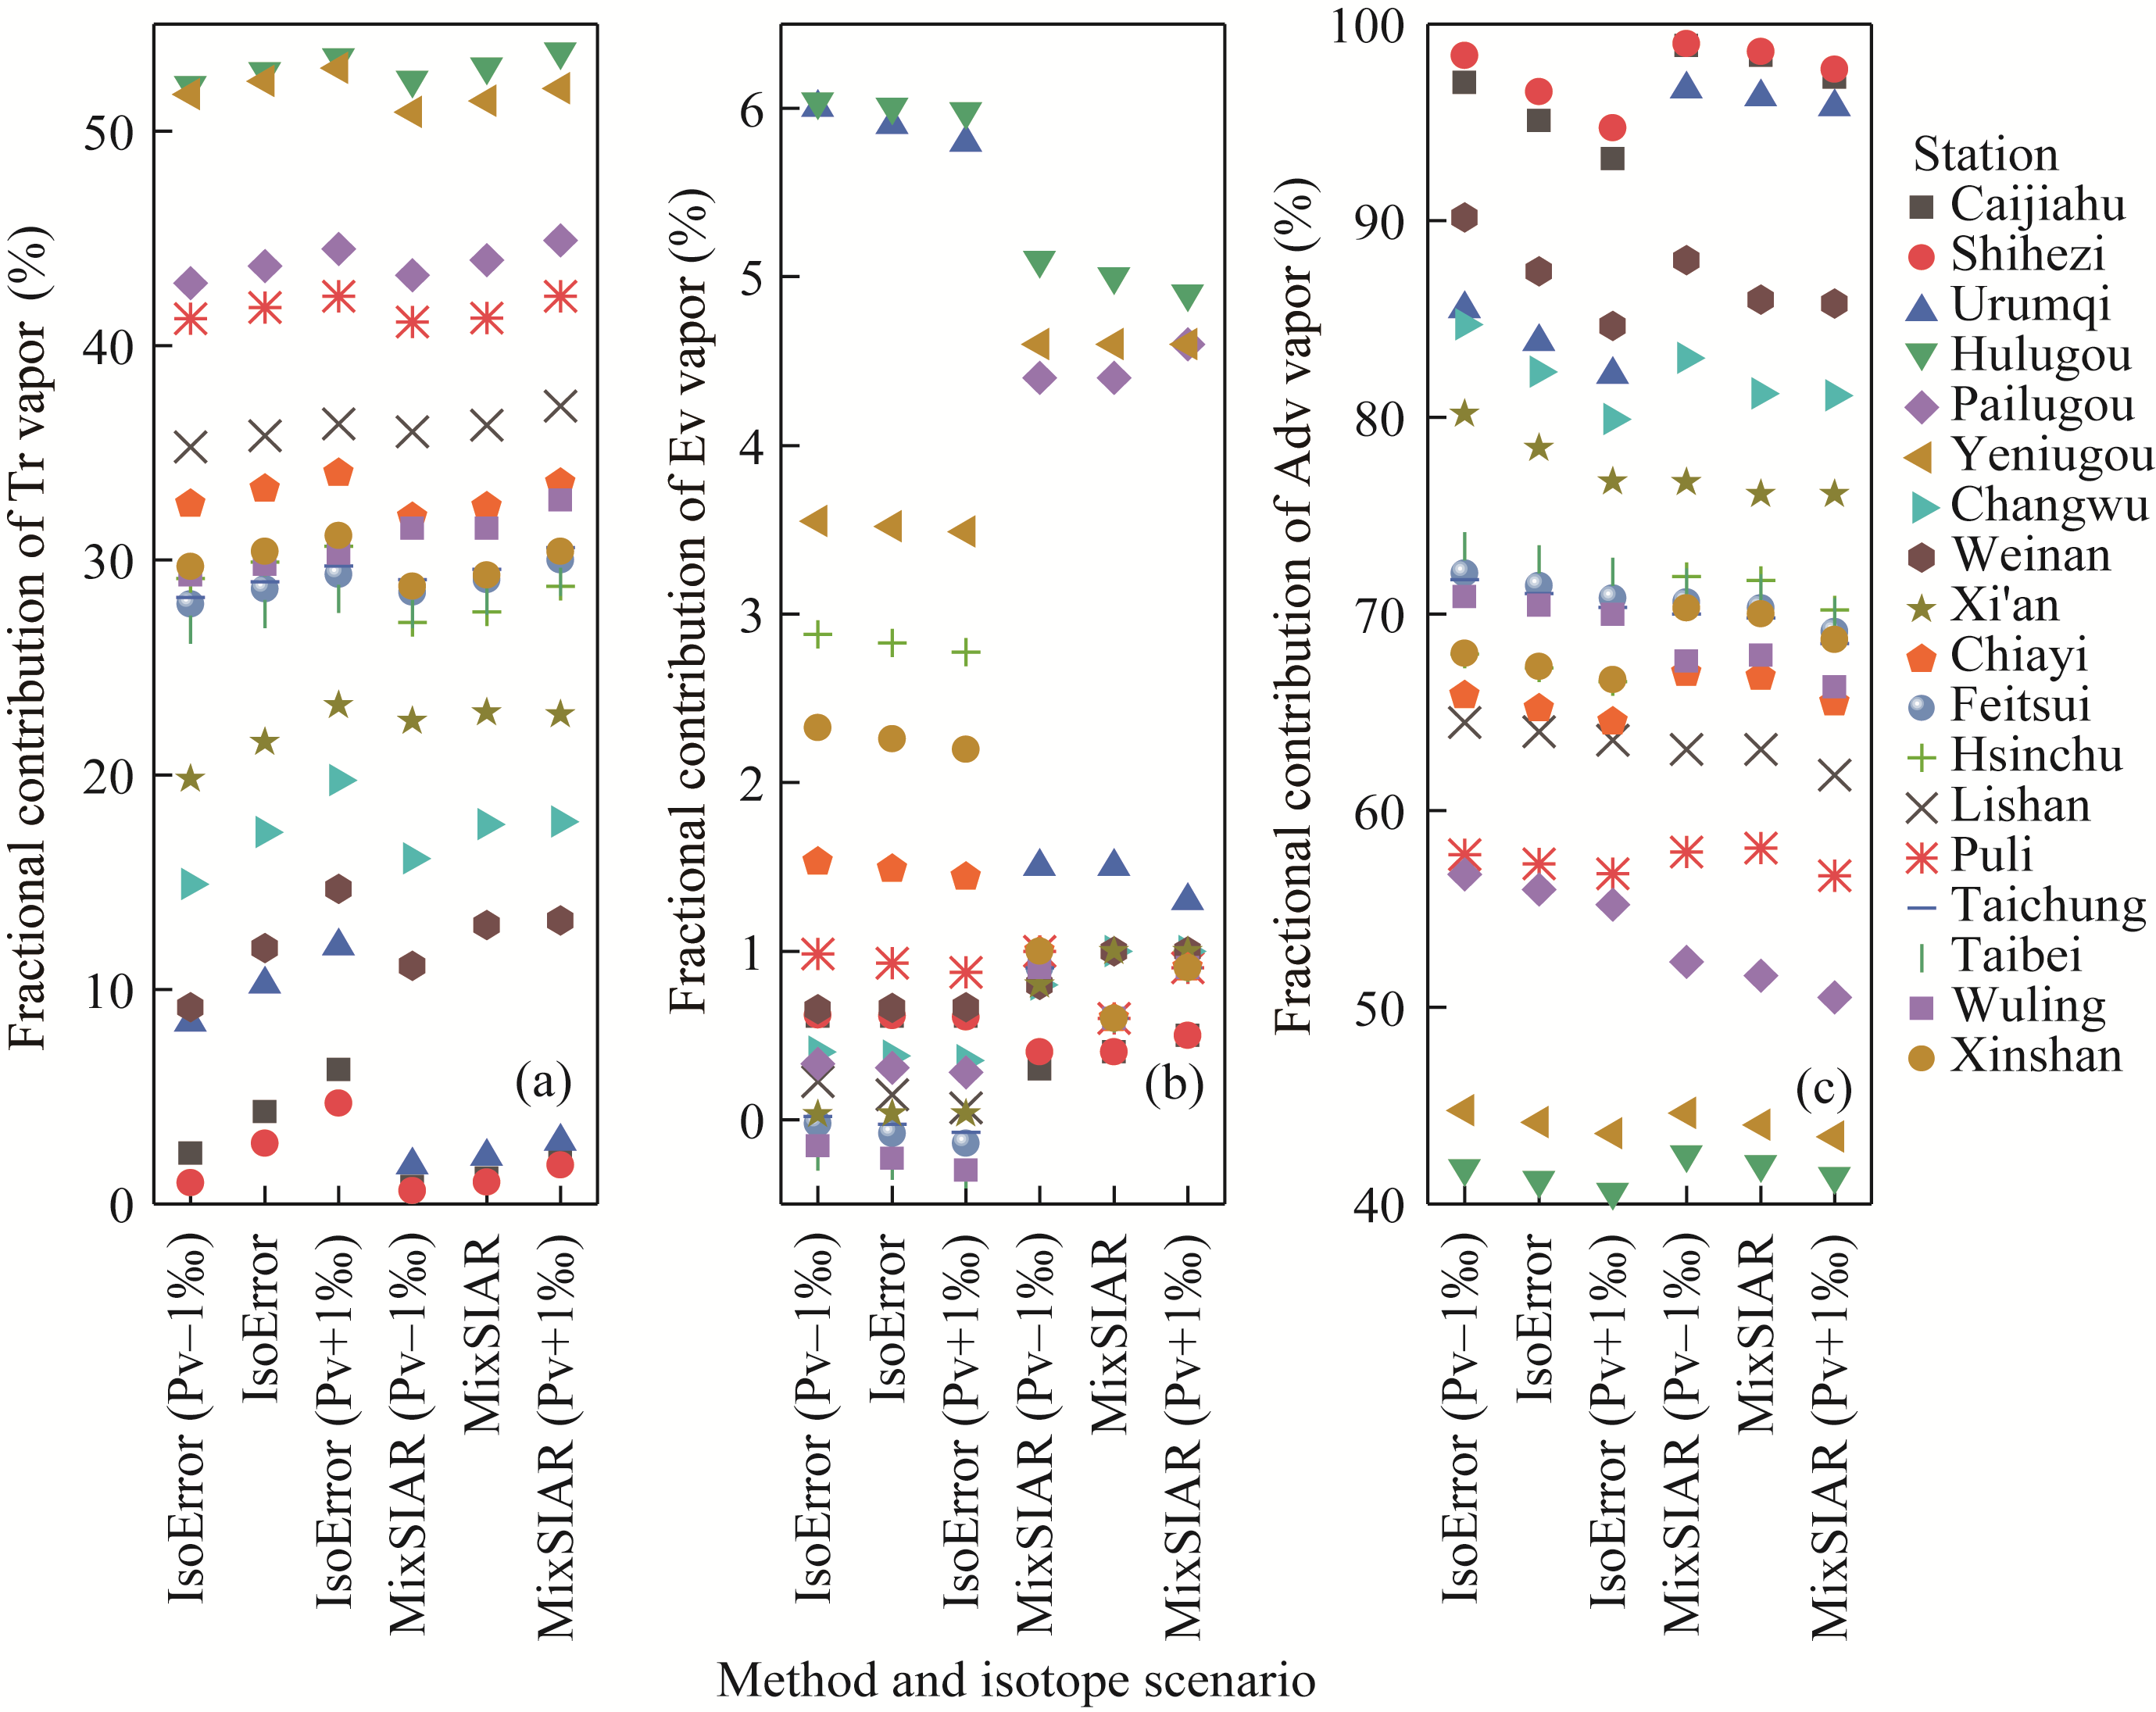
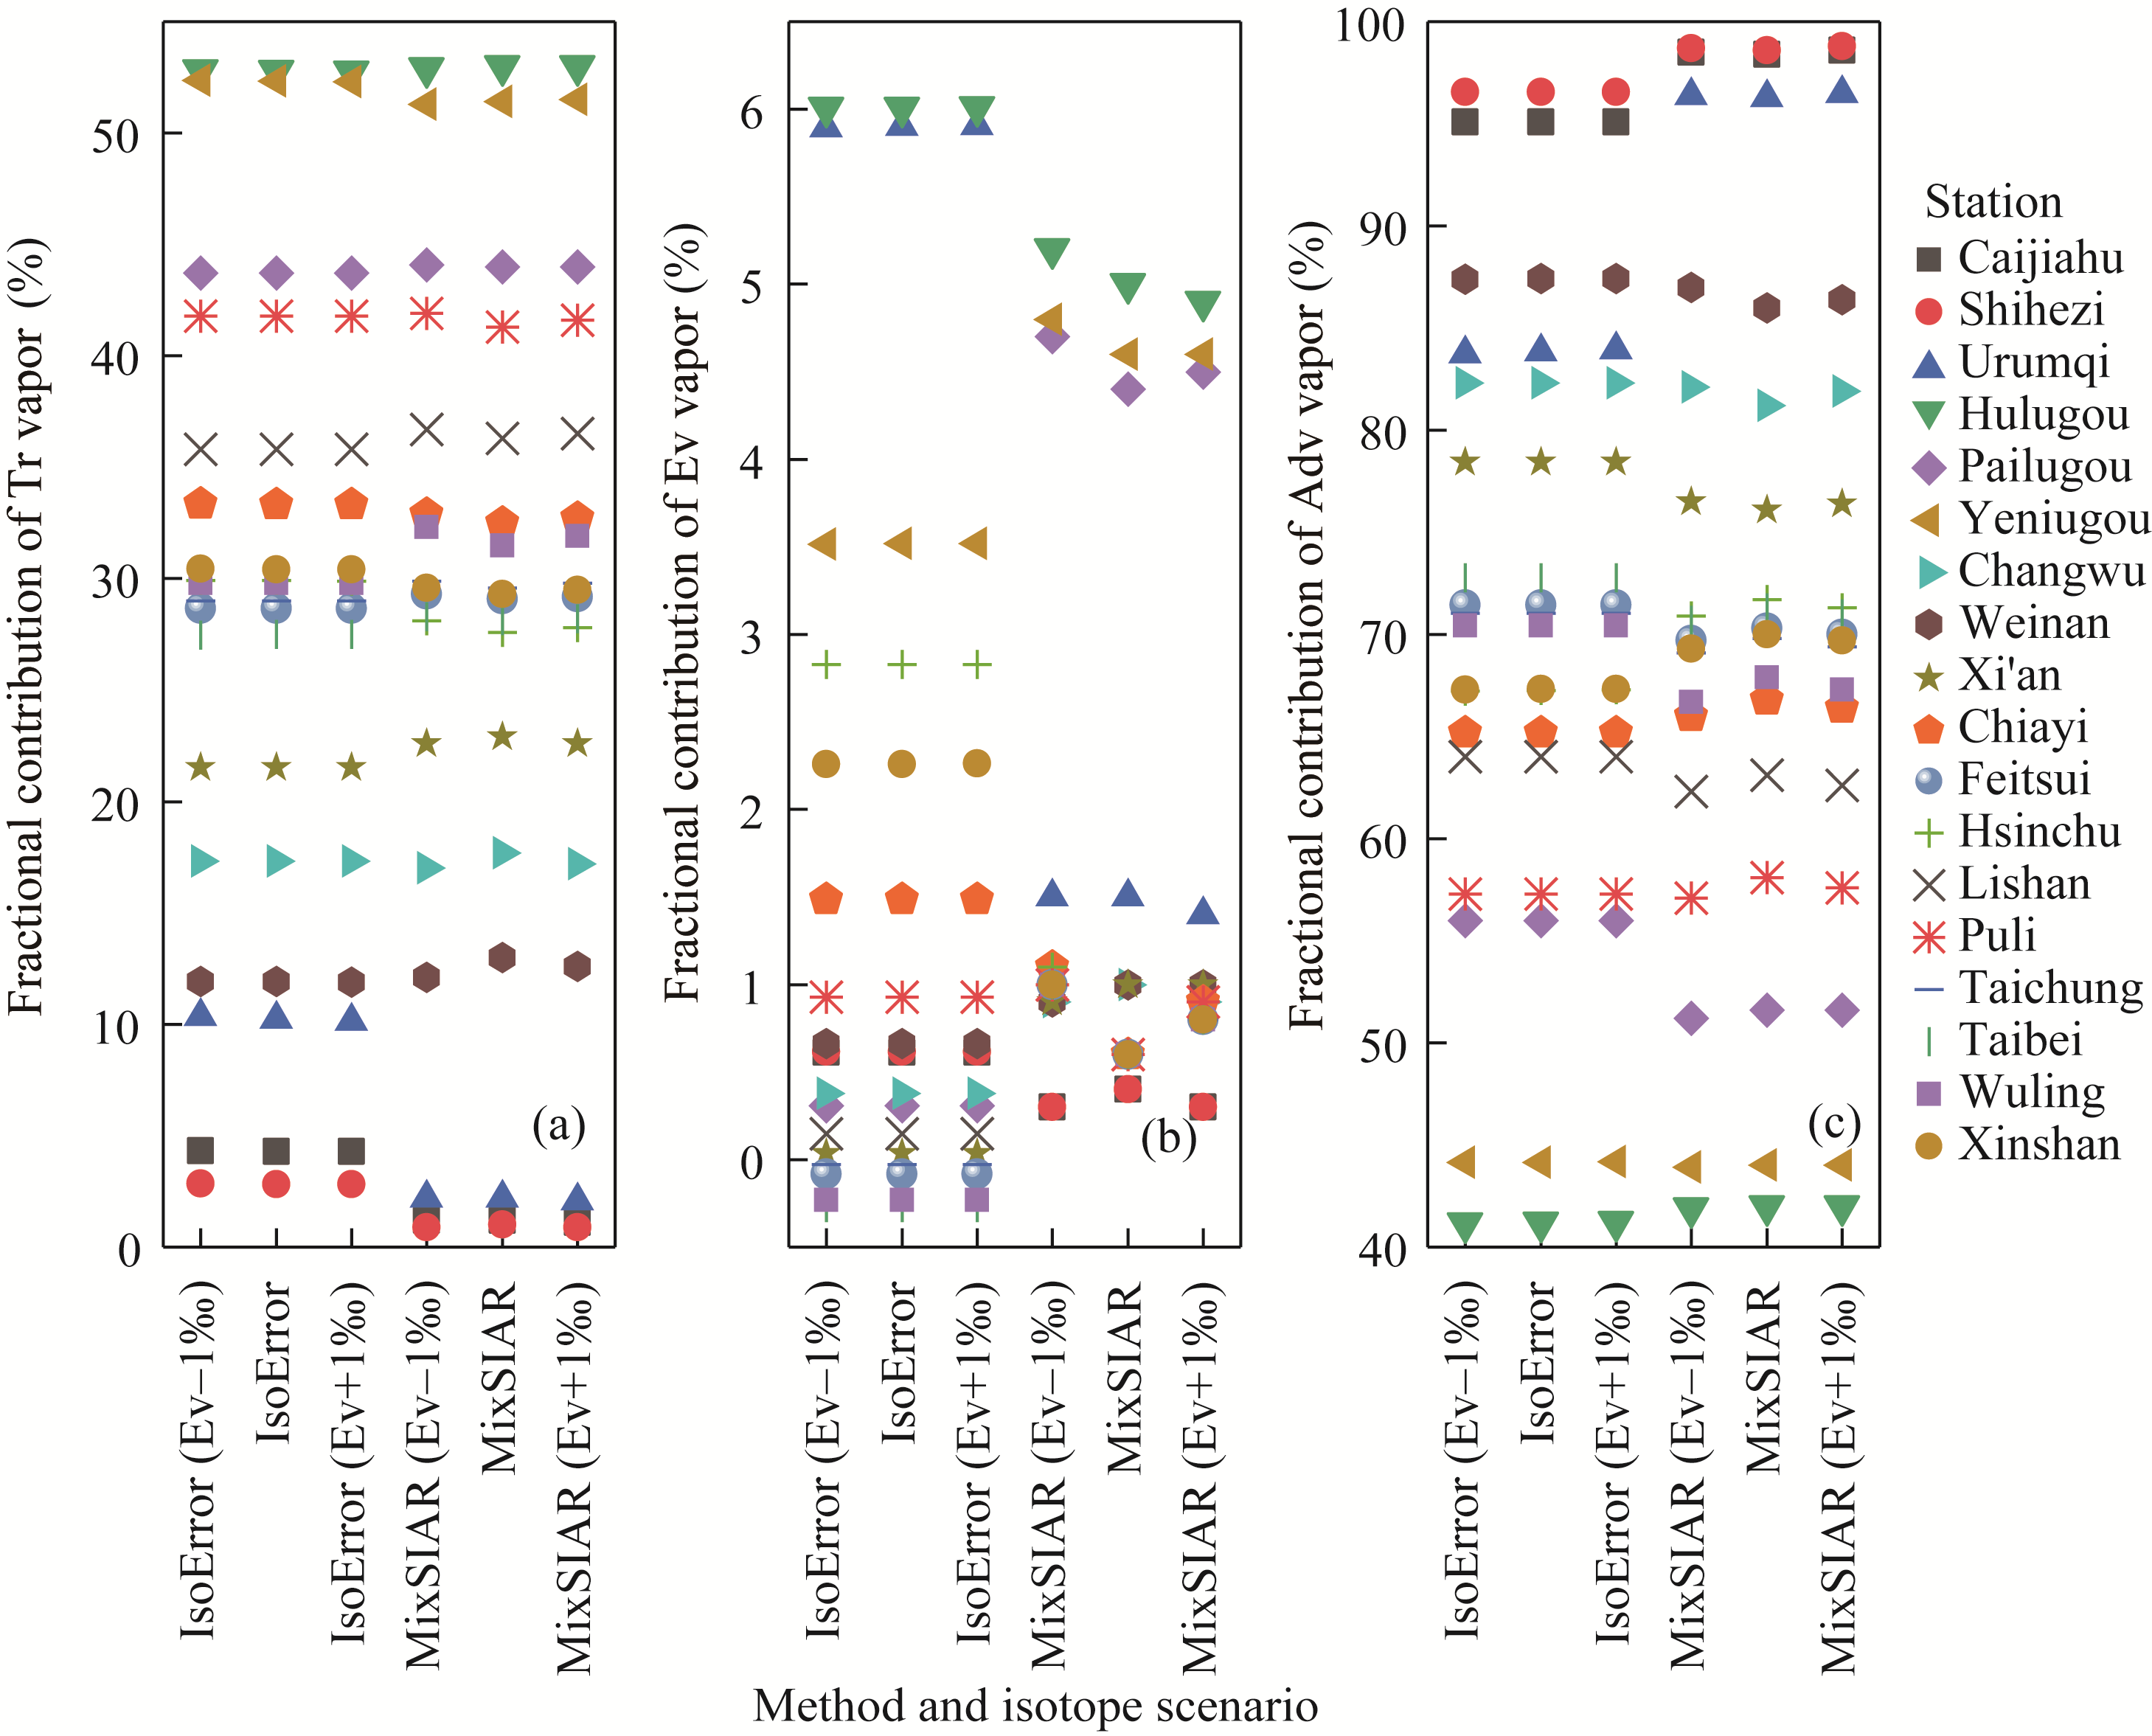
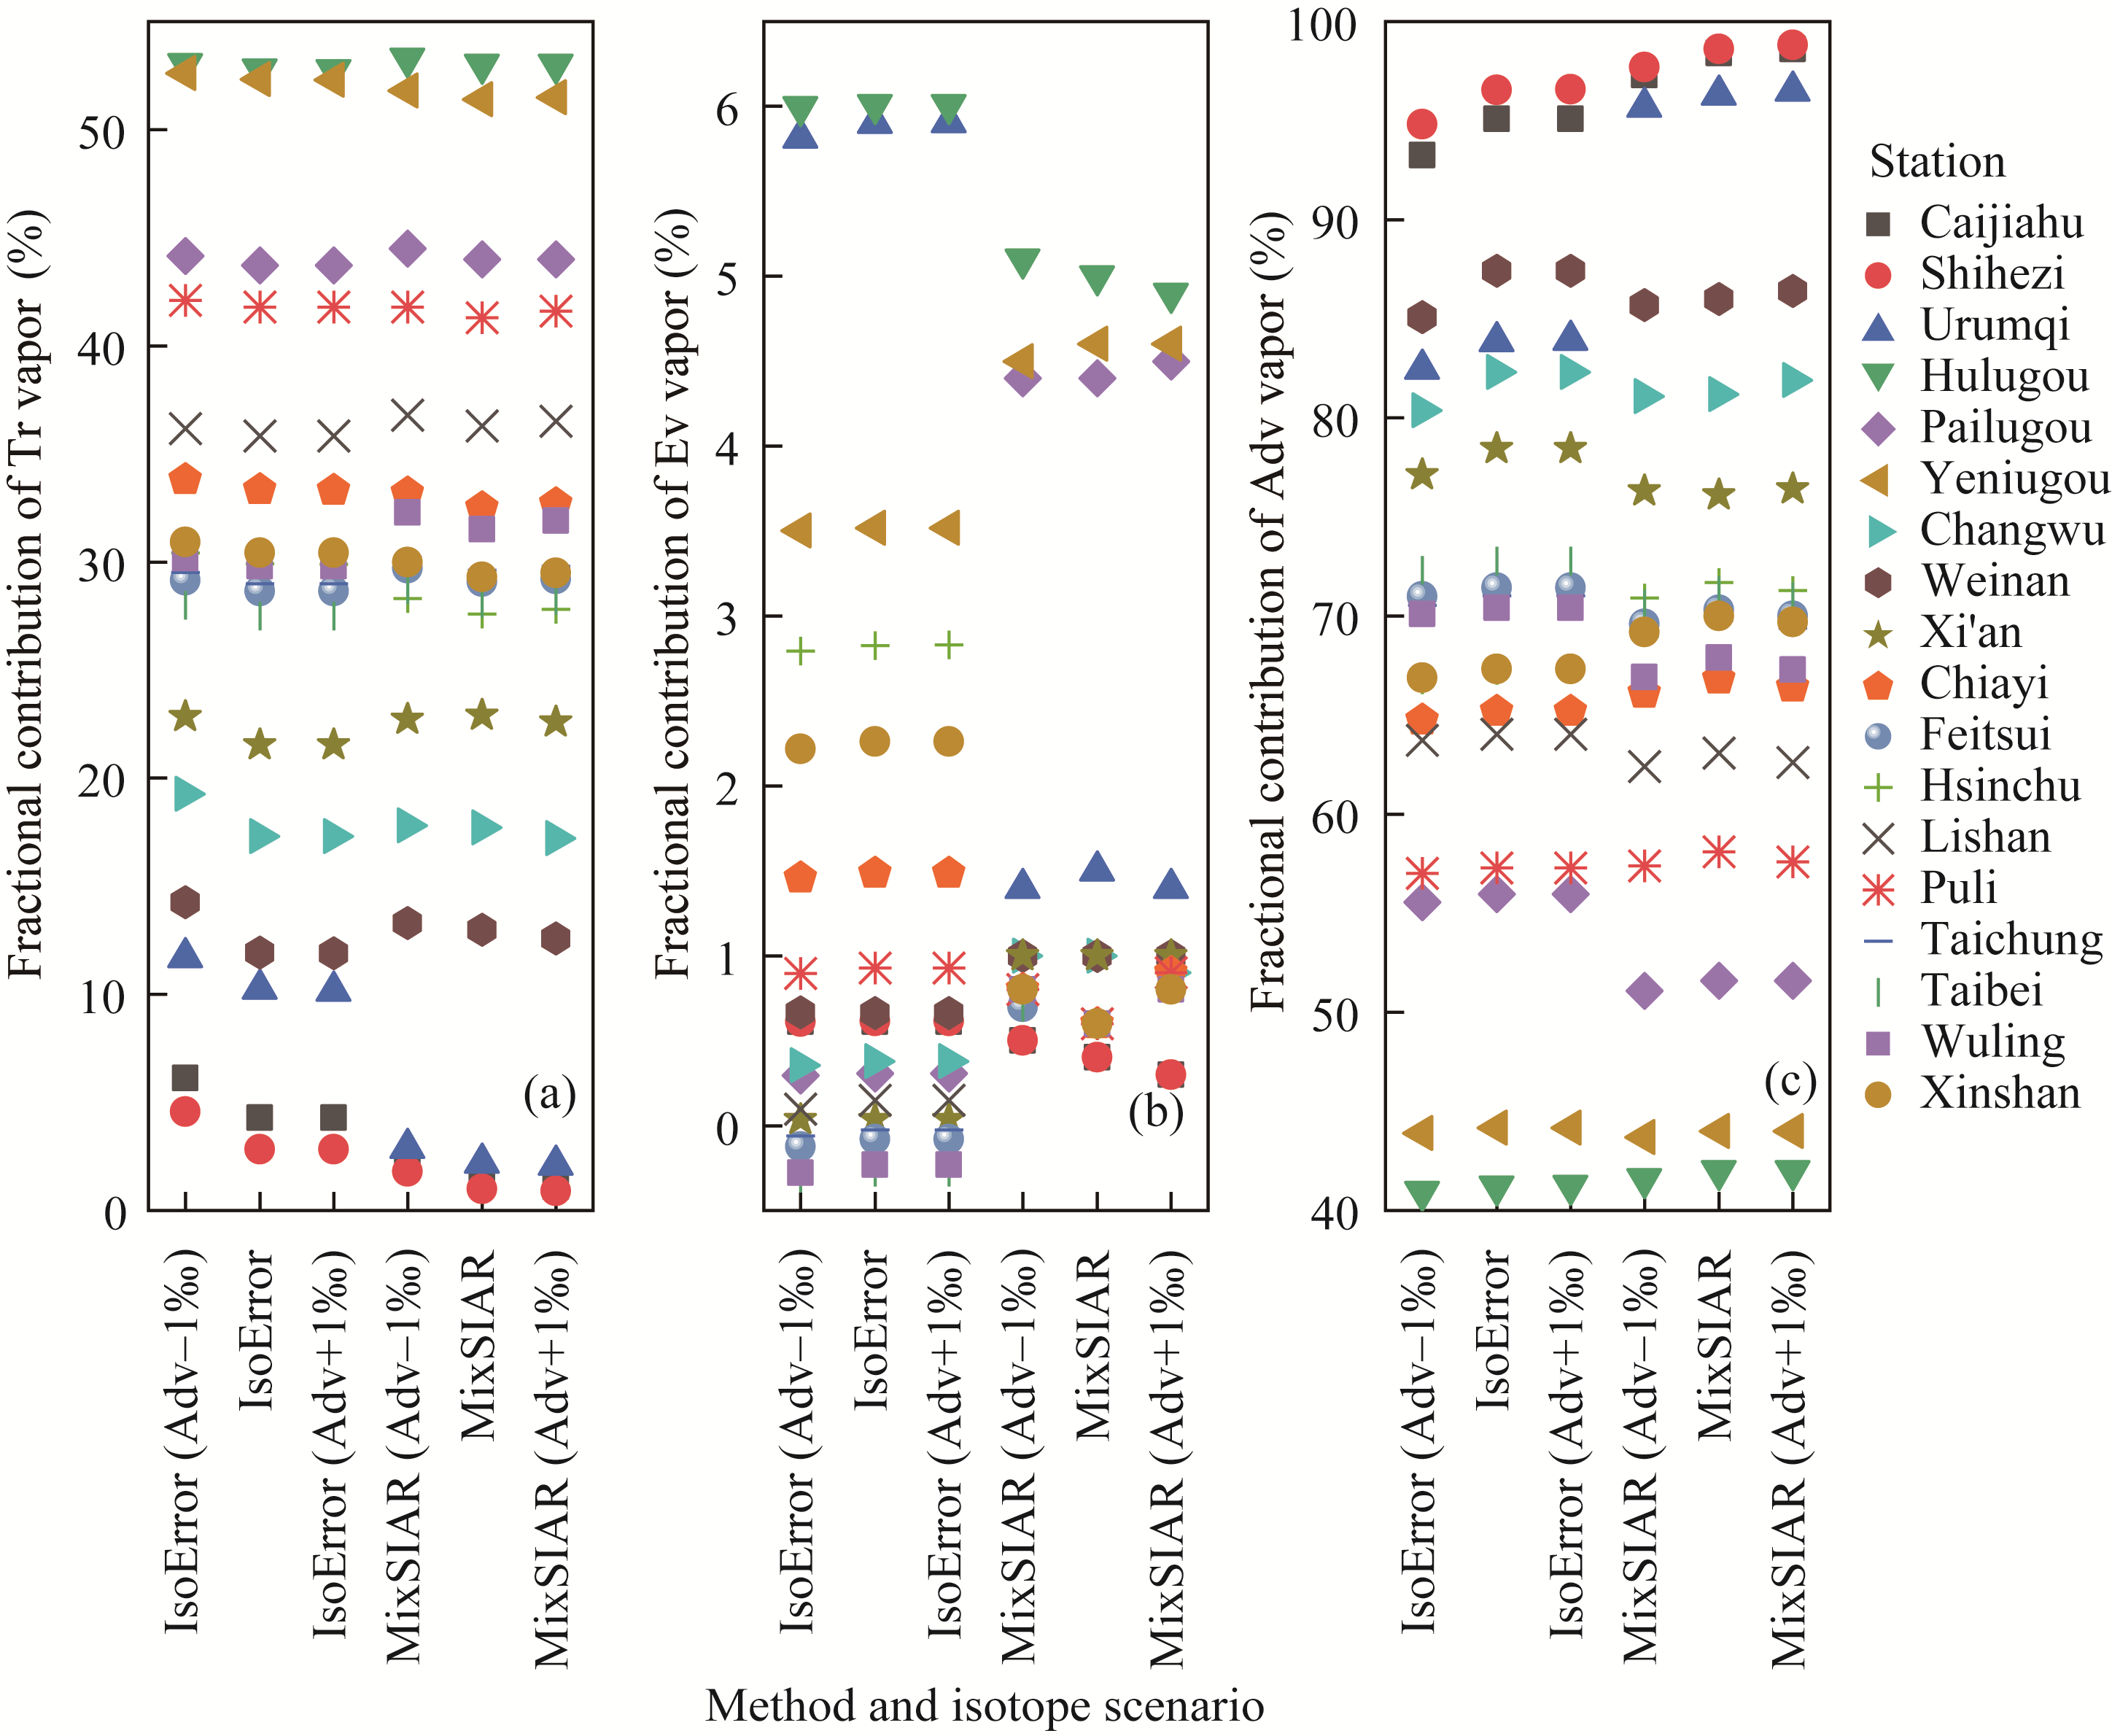
Abstract Stable water isotopes are natural tracers quantifying the contribution of moisture recycling to local precipitation, i.e., the moisture recycling ratio, but various isotope-based models usually lead to different results, which affects the accuracy of local moisture recycling. In this study, a total of 18 stations from four typical areas in China were selected to compare the performance of isotope-based linear and Bayesian mixing models and to determine local moisture recycling ratio. Among the three vapor sources including advection, transpiration, and surface evaporation, the advection vapor usually played a dominant role, and the contribution of surface evaporation was less than that of transpiration. When the abnormal values were ignored, the arithmetic averages of differences between isotope-based linear and the Bayesian mixing models were 0.9% for transpiration, 0.2% for surface evaporation, and -1.1% for advection, respectively, and the medians were 0.5%, 0.2%, and -0.8%, respectively. The importance of transpiration was slightly less for most cases when the Bayesian mixing model was applied, and the contribution of advection was relatively larger. The Bayesian mixing model was found to perform better in determining an efficient solution since linear model sometimes resulted in negative contribution ratios. Sensitivity test with two isotope scenarios indicated that the Bayesian model had a relatively low sensitivity to the changes in isotope input, and it was important to accurately estimate the isotopes in precipitation vapor. Generally, the Bayesian mixing model should be recommended instead of a linear model. The findings are useful for understanding the performance of isotope-based linear and Bayesian mixing models under various climate backgrounds.
|
|
Received: 30 December 2023
Published: 30 June 2024
|
|
Corresponding Authors:
*WANG Shengjie (E-mail: wangshengjie@nwnu.edu.cn)
|
|
|
| [1] |
Bowen G J, Cai Z, Fiorella R P, et al. 2019. Isotopes in the water cycle: Regional to global scale patterns and applications. Annual Review of Earth and Planetary Sciences, 47: 453-479.
|
|
|
| [2] |
Chiang J C H, Herman M J, Yoshimura K, et al. 2020. Enriched East Asian oxygen isotope of precipitation indicates reduced summer seasonality in regional climate and westerlies. Proceedings of the National Academy of Sciences, 117: 14745-14750.
|
|
|
| [3] |
Crawford J, Hughes C E, Lykoudis S. 2014. Alternative least squares methods for determining the meteoric water line, demonstrated using GNIP data. Journal of Hydrology, 519: 2331-2340.
|
|
|
| [4] |
Davis P, Syme J, Heikoop J, et al. 2015. Quantifying uncertainty in stable isotope mixing models. Journal of Geophysical Research: Biogeosciences, 120(5): 903-923.
|
|
|
| [5] |
Dominguez F, Eiras-Barca J, Yang Z, et al. 2022. Amazonian moisture recycling revisited using WRF with water vapor tracers. Journal of Geophysical Research: Atmospheres, 127(4): e2021JD035259, doi: 10.1029/2021JD035259.
|
|
|
| [6] |
Evaristo J, McDonnell J J, Clemens J. 2017. Plant source water apportionment using stable isotopes: A comparison of simple linear, two-compartment mixing model approaches. Hydrological Processes, 31: 3750-3758.
|
|
|
| [7] |
Genereux D. 1998. Quantifying uncertainty in tracer-based hydrograph separations. Water Resources Research, 34(4): 915-919.
|
|
|
| [8] |
Gimeno L, Stohl A, Trigo R M, et al. 2012. Oceanic and terrestrial sources of continental precipitation. Reviews of Geophysics, 50(4): RG4003, doi: 10.1029/2012RG000389.
|
|
|
| [9] |
Gui J, Li Z, Feng Q, et al. 2022. Water resources significance of moisture recycling in the transition zone between Tibetan Plateau and arid region by stable isotope tracing. Journal of Hydrology, 605: 127350, doi: 10.1016/j.jhydrol.2021.127350.
|
|
|
| [10] |
Harrington T S, Nusbaumer J, Skinner C B. 2023. The contribution of local and remote transpiration, ground evaporation, and canopy evaporation to precipitation across North America. Journal of Geophysical Research: Atmospheres, 128(7): e2022JD037290, doi: 10.1029/2022JD037290.
|
|
|
| [11] |
Hua L, Zhong L, Ke Z. 2017. Characteristics of the precipitation recycling ratio and its relationship with regional precipitation in China. Theoretical and Applied Climatology, 127: 513-531.
|
|
|
| [12] |
Keune J, Miralles D G. 2019. A precipitation recycling network to assess freshwater vulnerability: Challenging the watershed convention. Water Resources Research, 55(11): 9947-9961.
doi: 10.1029/2019WR025310
pmid: 32025063
|
|
|
| [13] |
Kong Y, Pang Z, Froehlich K. 2013. Quantifying recycled moisture fraction in precipitation of an arid region using deuterium excess. Tellus B: Chemical and Physical Meteorology, 65: 19251, doi: 10.3402/tellusb.v65i0.19251.
|
|
|
| [14] |
Li R, Wang C. 2020. Precipitation recycling using a new evapotranspiration estimator for Asian-African arid regions. Theoretical and Applied Climatology, 140(1-2): 1-13.
|
|
|
| [15] |
Li X, Lu A, Feng Q, et al. 2020. Recycled moisture in an enclosed basin, Guanzhong Basin of Northern China, in the summer: Contribution to precipitation based on a stable isotope approach. Environmental Science and Pollution Research, 27: 27926-27936.
|
|
|
| [16] |
Li Z, Feng Q, Wang Q J, et al. 2016. Contributions of local terrestrial evaporation and transpiration to precipitation using δ18O and D-excess as a proxy in Shiyang inland river basin in China. Global and Planetary Change, 146: 140-151.
|
|
|
| [17] |
Liu D, Li X, Zhang Y, et al. 2023. Using a multi-isotope approach and isotope mixing models to trace and quantify phosphorus sources in the Tuojiang River, Southwest China. Environmental Science & Technology, 57(19): 7328-7335.
|
|
|
| [18] |
Markonis Y, Papalexiou S M, Martinkova M, et al. 2019. Assessment of water cycle intensification over land using a multisource global gridded precipitation dataset. Journal of Geophysical Research: Atmospheres, 124(21): 11175-11187.
|
|
|
| [19] |
Moore J W, Semmens B X. 2008. Incorporating uncertainty and prior information into stable isotope mixing models. Ecology Letters, 11: 470-480.
doi: 10.1111/j.1461-0248.2008.01163.x
pmid: 18294213
|
|
|
| [20] |
Parnell A C, Inger R, Bearhop S, et al. 2010. Source partitioning using stable isotopes: Coping with too much variation. PLoS ONE, 5(3): e9672, doi: 10.1371/journal.pone.0009672.
|
|
|
| [21] |
Peng T R, Wang C H, Huang C C, et al. 2010. Stable isotopic characteristic of Taiwan's precipitation: A case study of western Pacific monsoon region. Earth and Planetary Science Letters, 289: 357-366.
|
|
|
| [22] |
Peng T R, Liu K K, Wang C H, et al. 2011. A water isotope approach to assessing moisture recycling in the island-based precipitation of Taiwan: A case study in the western Pacific. Water Resources Research, 47(8): W08507, doi: 10.1029/2010WR009890.
|
|
|
| [23] |
Phillips D L, Gregg J W. 2001. Uncertainty in source partitioning using stable isotopes. Oecologia, 127: 171-179.
doi: 10.1007/s004420000578
pmid: 24577646
|
|
|
| [24] |
Phillips D L, Gregg J W. 2003. Source partitioning using stable isotopes: Coping with too many sources. Oecologia, 136: 261-269.
pmid: 12759813
|
|
|
| [25] |
Putman A L, Fiorella R P, Bowen G J, et al. 2019. A global perspective on local meteoric water lines: Meta-analytic insight into fundamental controls and practical constraints. Water Resources Research, 55(8): 6896-6910.
doi: 10.1029/2019WR025181
|
|
|
| [26] |
Qiu X, Zhang M, Dong Z, et al. 2021. Contribution of recycled moisture to precipitation in northeastern Tibetan Plateau: A case study based on Bayesian estimation. Atmosphere, 12(6): 731, doi: 10.3390/atmos12060731.
|
|
|
| [27] |
Rothfuss Y, Quade M, Brüggemann N, et al. 2020. Reviews and syntheses: Gaining insights into evapotranspiration partitioning with novel isotopic monitoring methods. Biogeosciences, 18(12): 3701-3732.
|
|
|
| [28] |
Shen J, Yang H, Li S, et al. 2022. Revisiting the pan evaporation trend in China during 1988-2017. Journal of Geophysical Research: Atmospheres, 127(12): e2022JD036489, doi: 10.1029/2022JD036489.
|
|
|
| [29] |
Stock B C, Jackson A L, Ward E J, et al. 2018. Analyzing mixing systems using a new generation of Bayesian tracer mixing models. PeerJ, 6: e5096, doi: 10.7717/peerj.5096.
|
|
|
| [30] |
Sun C, Chen W, Chen Y, et al. 2020. Stable isotopes of atmospheric precipitation and its environmental drivers in the Eastern Chinese Loess Plateau, China. Journal of Hydrology, 581: 124404, doi: 10.1016/j.jhydrol.2019.124404.
|
|
|
| [31] |
te Wierik S A, Cammeraat E L H, Gupta J, et al. 2021. Reviewing the impact of land use and land use change on moisture recycling and precipitation patterns. Water Resources Research, 57(7): e2020WR029234, doi: 10.1029/2020WR029234.
|
|
|
| [32] |
Theeuwen J J E, Staal A, Tuinenburg O A, et al. 2023. Local moisture recycling across the globe. Hydrology and Earth System Sciences, 27(7): 1457-1476.
|
|
|
| [33] |
Trenberth K E. 1999. Atmospheric moisture recycling: Role of advection and local evaporation. Journal of Climate, 12(5): 1368-1381.
|
|
|
| [34] |
Tuinenburg O A, Theeuwen J J E, Staal A. 2020. High-resolution global atmospheric moisture connections from evaporation to precipitation. Earth System Science Data, 12(4): 3177-3188.
|
|
|
| [35] |
van der Ent R J, Savenije H H G, Schaefli B, et al. 2010. Origin and fate of atmospheric moisture over continents. Water Resources Research, 46(9): W09525, doi: 10.1029/2010WR009127.
|
|
|
| [36] |
Wang S, Zhang M, Che Y, et al. 2016. Contribution of recycled moisture to precipitation in oases of arid central Asia: A stable isotope approach. Water Resources Research, 52(4): 3246-3257.
|
|
|
| [37] |
Wang S, Wang L, Zhang M, et al. 2022. Quantifying moisture recycling of a leeward oasis in arid central Asia using a Bayesian isotopic mixing model. Journal of Hydrology, 613(6): 128459, doi: 10.1016/j.jhydrol.2022.128459.
|
|
|
| [38] |
Wang S, Yang G, Bershaw J, et al. 2024. Interannual variations in stable isotopes of atmospheric water in arid Central Asia due to changes in atmospheric circulation. Global and Planetary Change, 234: 104367, doi: 10.1016/j.gloplacha.2024.104367.
|
|
|
| [39] |
Xiao K, Griffis T J, Lee X, et al. 2023. A coupled equilibrium boundary layer model with stable water isotopes and its application to local water recycling. Agricultural and Forest Meteorology, 339: 109572, doi: 10.1016/j.agrformet.2023.109572.
|
|
|
| [40] |
Xiao W, Wei Z, Wen X. 2018. Evapotranspiration partitioning at the ecosystem scale using the stable isotope method-A review. Agricultural and Forest Meteorology, 263: 346-361.
|
|
|
| [41] |
Yoshimura K, Kanamitsu M, Noone D, et al. 2008. Historical isotope simulation using reanalysis atmospheric data. Journal of Geophysical Research, 113(D19): D19108, doi: 10.1029/2008JD010074.
|
|
|
| [42] |
Zhang M, Wang S. 2016. A review of precipitation isotope studies in China: Basic pattern and hydrological process. Journal of Geographical Sciences, 26(7): 921-938.
doi: 10.1007/s11442-016-1307-y
|
|
|
| [43] |
Zhang W, Zhou T, Zhang L, et al. 2019. Future intensification of the water cycle with an enhanced annual cycle over global land monsoon regions. Journal of Climate, 32(17): 5437-5452.
|
|
|
| [44] |
Zhao L, Liu X, Wang N, et al. 2019. Contribution of recycled moisture to local precipitation in the inland Qilian Mountains. Agricultural and Forest Meteorology, 271: 316-335.
|
|
|
| [45] |
Zhu X, Wu T, Hu G, et al. 2020. Long-distance atmospheric moisture dominates water budget in permafrost regions of the central Qinghai-Tibet Plateau. Hydrological Processes, 34(22): 4280-4294.
|
|
|
|
Viewed |
|
|
|
Full text
|
|
|
|
|
Abstract
|
|
|
|
|
Cited |
|
|
|
|
| |
Shared |
|
|
|
|
| |
Discussed |
|
|
|
|