| Research article |
|


|
|
|
| Spatial trends of extreme temperature events and climate change indicators in climate zones of Jordan |
Abdelaziz Q BASHABSHEH1,*( ), Kamel K ALZBOON1, Zeyad ALSHBOUL2 ), Kamel K ALZBOON1, Zeyad ALSHBOUL2 |
1Department of Environmental Engineering, Al-Huson University College, Al-Balqa Applied University, Irbid 21510, Jordan
2Faculty of Engineering, Department of Civil Engineering, Ajloun National University, Ajloun 26810, Jordan |
|
|
|
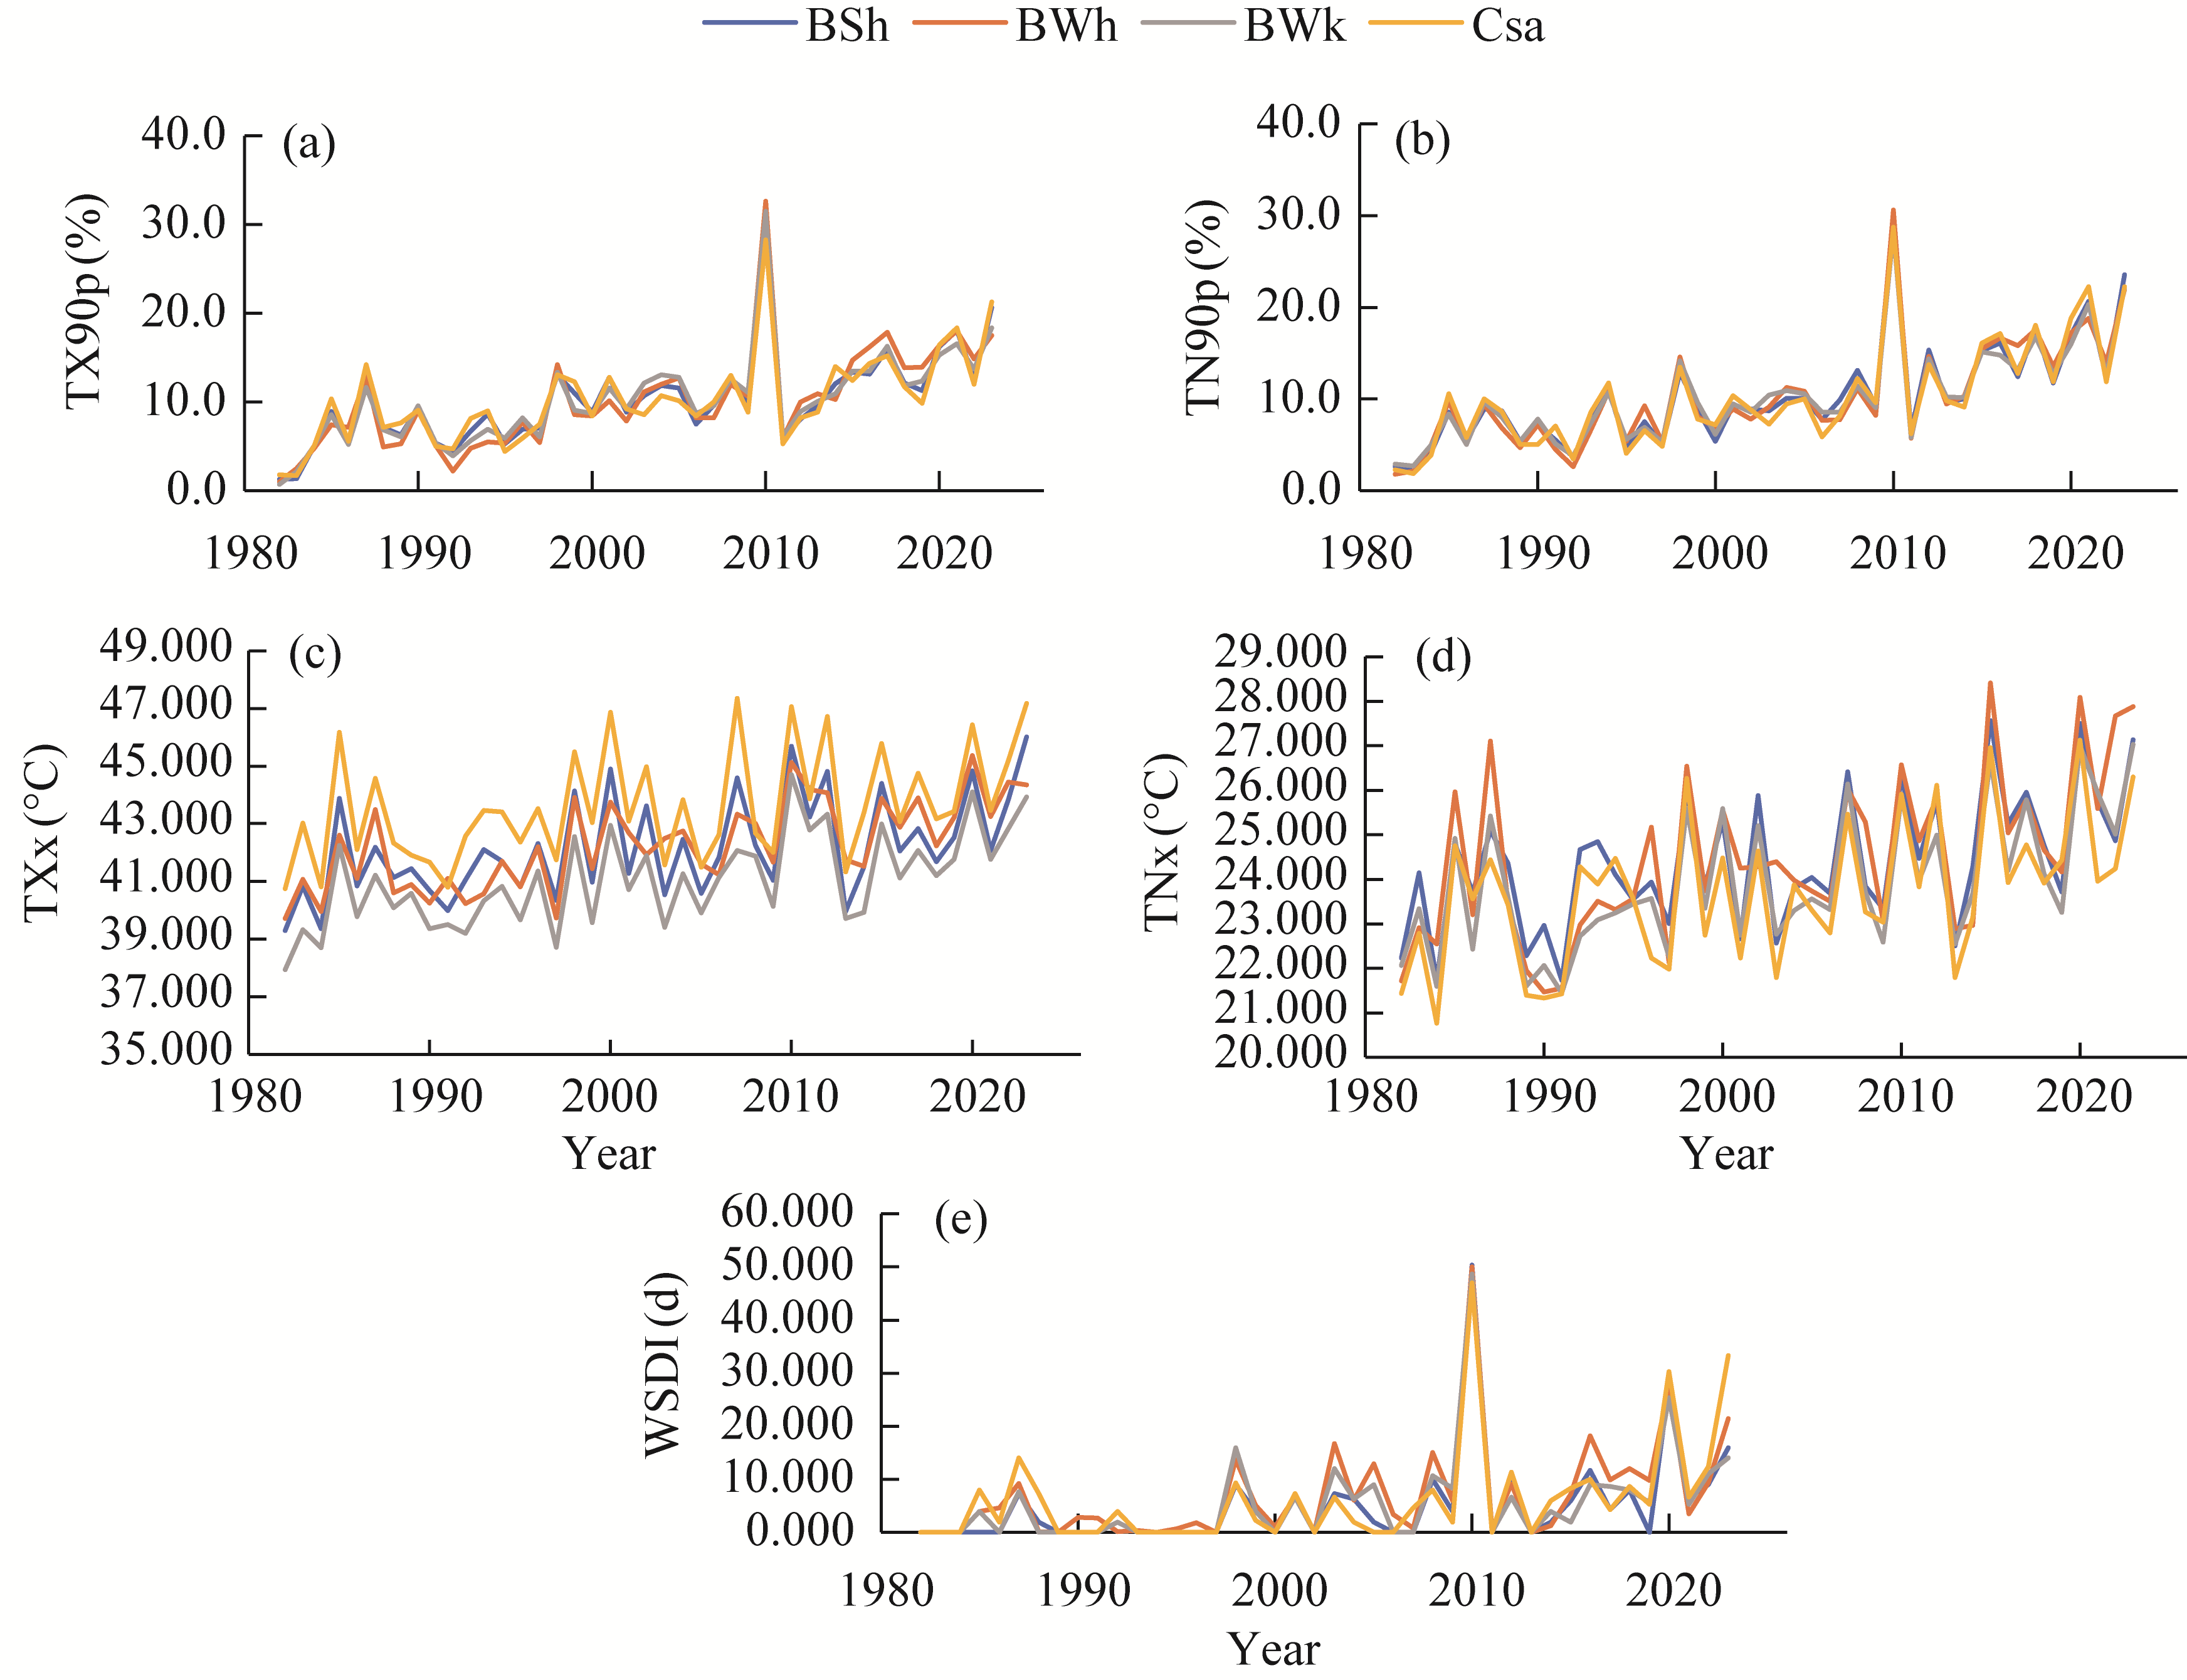
Abstract Extreme temperature events have intensified across Jordan over the past 40 a, increasing risks to agriculture, water availability, urban infrastructure, and public health. The purpose of this study is to assess the long-term spatial trends and regime shifts in extreme temperature indicators across Jordan's climate zones to explore climate adaptation strategies. This study presents a high-resolution and spatially explicit assessment of thermal extremes using daily data from 1982 to 2024 across 45 grid-based study points in Jordan. Thirteen temperature indices, including percentile-based thresholds, duration metrics, and absolute extremes, were computed using RClimDex and analyzed across four Köppen climate zones: hot desert (BWh), hot semi-arid (BSh), cold desert (BWk), and Mediterranean (Csa) climates. The analysis confirmed a statistically significant warming trend: annual mean maximum temperatures increased by 2.198°C, while annual mean minimum temperatures rose by 2.035°C. Cold extremes have sharply declined, with cold days (TX10p) decreasing by 70.0%-80.0%, and the cold spell duration indicator (CSDI) dropping from 12.6 to 4.0 d/a, particularly in the BWk zone. Heat indices intensified across all zones, with warm days (TX90p) increasing by over 300.0% in BWh, warm nights (TN90p) rising by 38.1%, and the warm spell duration indicator (WSDI) extending fourfold, indicating prolonged exposure to heatwaves. Mean value of maximum temperature (TXx) reached 45.600°C in most arid areas, while minimum temperature (TNx) exceeded 31.600°C, highlighting increased nocturnal heat stress. Change-point analysis indicated that 1998 was a pivotal year, marking a structural transition in both cold and warm temperature indices. Subsequent intensifications after 2010 in TN90p, TNx, and mean of daily maximum temperature (Tmaxmean) reflected an ongoing trend toward sustained thermal extremes. In addition to time-series trends, the study employed network-based correlation analysis to explore the coherence among climate indices. Strong positive correlations were observed among TXx, TX90p, and mean of daily minimum temperature (Tminmean) (r≥0.94), as well as among TN90p, Tminmean, and TNx (r≥0.87), indicating a tightly clustered heat subsystem. Duration metrics like the WSDI showed a close alignment with percentile extremes (between WSDI and TX90p; r=0.88), suggesting integrated heatwave behavior. In contrast, cold indices (TX10p, TN90p, frost days, and CSDI) exhibited weak or negative correlations and displayed peripheral positioning in the climate network, indicating their limited role under a warming regime. Absolute extremes showed weak internal linkages, suggesting episodic rather than systemic response characteristics. This structural realignment indicated a shift from a previously balanced thermal profile to a heat-dominated climate system. Regional variations revealed that BWh and BSh were experiencing the steepest warming, while Csa was transitioning more slowly but was showing signs of reduced winter cooling and increased irrigation demands. The findings establish a robust climate baseline for Jordan and offer actionable insights for climate adaptation planning. Recommended measures include precision irrigation, the development of heat-resilient crops, improvements to urban cooling infrastructure, and early warning systems for thermal extremes. By integrating spatial climate zoning, regime shift analysis, and inter-index correlation structures, this study provides a replicable framework for monitoring climatic transformations and informing resilience strategies in arid and semi-arid areas.
|
|
Received: 03 June 2025
Published: 30 November 2025
|
|
Corresponding Authors:
*Abdelaziz Q BASHABSHEH (E-mail: abdelazizbashabsheh@gmail.com)
|
|
|
| [1] |
Abu-Allaban M, Sada A, Al-Malabeh A. 2015. Temporal and spatial analysis of climate change at northern Jordanian Badia. Carpathian Journal of Earth and Environmental Sciences, 7(2): 87-93.
|
|
|
| [2] |
Al-Bilbisi H. 2013. Topography and morphology. In: Ababsa M. Atlas of Jordan: History, Territories and Society. Beyrouth: Ifpo Press, 42-46.
|
|
|
| [3] |
Al-Eisawi D M H. 2005. Water scarcity in relation to food security and sustainable use of biodiversity in Jordan. In: Hamdy A, Monti R. Food Security under Water Scarcity in the Middle East:Problems and Solutions. Bari: CIHEAM, 239-248.
|
|
|
| [4] |
Al-Qinna M I. 2018. Analyses of climate variability in Jordan using topographic auxiliary variables by the CoKriging technique. Jordan Journal of Earth and Environmental Sciences, 9(1): 67-74.
|
|
|
| [5] |
Al Qudah A, Rusan M J, Al-Qinna M I, et al. 2021. Climate change vulnerability assessment for selected agricultural responses at Yarmouk River Basin Area, Jordan. Mitigation and Adaptation Strategies for Global Change, 26(1): 3, doi: 10.1007/s11027-021-09944-7.
|
|
|
| [6] |
Al-Zghoul S, Al-Homoud M. 2025. GIS driven spatial planning for resilient communities: Walkability, social cohesion, and green infrastructure in peri urban Jordan. Sustainability, 17(14): 6637, doi: 10.3390/su17146637.
|
|
|
| [7] |
Ali S, Saeed A, Kiani R S, et al. 2021. Future climatic changes, extreme events, related uncertainties, and policy recommendations in the Hindu Kush sub-regions of Pakistan. Theoretical and Applied Climatology, 143(1): 193-209.
doi: 10.1007/s00704-020-03399-7
|
|
|
| [8] |
Alsalal S, Tan M L, Samat N, et al. 2024. Temperature and precipitation changes under CMIP 6 projections in the Mujib Basin, Jordan. Theoretical and Applied Climatology, 155(8): 7703-7720.
doi: 10.1007/s00704-024-05087-2
|
|
|
| [9] |
Alwadi Y, Al-Delaimy W K, Abdulla F, et al. 2024. A 19-year analysis of hot and cold temperature burdens on mortality in Amman, Jordan. Science of the Total Environment, 951: 175624, doi: 10.1016/j.scitotenv.2024.175624.
|
|
|
| [10] |
Alzboon K, Al-Samrraie L A, Al Bkoor Alrawashdeh K. 2021. Climate change indicators in Jordan: A new approach using area method. Jordan Journal of Civil Engineering, 15(1): 142-155.
|
|
|
| [11] |
Armstrong McKay D I, Staal A, Abrams J F, et al. 2022. Exceeding 1.5°C global warming could trigger multiple climate tipping points. Science, 377(6611): eabn7950, doi: 10.1126/science.abn7950.
|
|
|
| [12] |
Arsad F S, Hod R, Ahmad N, et al. 2022. The impact of heatwaves on mortality and morbidity and the associated vulnerability factors: A systematic review. International Journal of Environmental Research and Public Health, 19(23): 16356, doi: 10.3390/ijerph192316356.
|
|
|
| [13] |
Atashi N, Rahimi D, Al Kuisi M, et al. 2020. Modeling long term temporal variation of dew formation in Jordan and its link to climate change. Water, 12(8): 2186, doi: 10.3390/w12082186.
|
|
|
| [14] |
Baig M A, Zaman Q, Baig S A, et al. 2021. Regression analysis of hydro-meteorological variables for climate change prediction: a case study of Chitral Basin, Hindukush region. Science of the Total Environment, 793: 148595, doi: 10.1016/j.scitotenv.2021.148595.
|
|
|
| [15] |
Bashabsheh A Q, Alzboon K K. 2024. Impact of climate change on water resources in the Yarmouk River Basin of Jordan. Journal of Arid Land, 16(12): 1633-1647.
doi: 10.1007/s40333-024-0069-0
|
|
|
| [16] |
Bashabsheh A Q, Alzboon K K. 2025. Climate change in Jordan: a case study of Yarmouk Basin using statistical downscaling model. Jordan Journal of Civil Engineering, 19(4): 503-527.
|
|
|
| [17] |
Bisht H, Shaloo B, Kumar B, et al. 2023. Sensitivity analysis of wheat cultivar HD 2967 to weather parameters using CERES- Wheat model. Journal of Agricultural Science and Technology, 25(3): 661-672.
|
|
|
| [18] |
Cartwright S L, Schmied J, Karrow N, et al. 2023. Impact of heat stress on dairy cattle and selection strategies for thermotolerance: a review. Frontiers in Veterinary Science, 10: 1198697, doi: 10.3389/fvets.2023.1198697.
|
|
|
| [19] |
Cheng Q P, Zhong F L, Wang P. 2021. Potential linkages of extreme climate events with vegetation and large-scale circulation indices in an endorheic river basin in northwest China. Atmospheric Research, 247: 105256, doi: 10.1016/j.atmosres.2020.105256.
|
|
|
| [20] |
Cheong W K, Timbal B, Golding N, et al. 2018. Observed and modelled temperature and precipitation extremes over Southeast Asia from 1972 to 2010. International Journal of Climatology, 38(7): 3013-3027.
doi: 10.1002/joc.2018.38.issue-7
|
|
|
| [21] |
Douris J, Kim G. 2021. Atlas of Mortality and Economic Losses from Weather, Climate and Water Extremes (1970-2019). Geneva: World Meteorological Organization.
|
|
|
| [22] |
Easterling D R, Alexander L V, Mokssit A, et al. 2003. CCl/CLIVAR workshop to develop priority climate indices. American Meteorological Society. [2025-04-06]. https://etccdi.pacificclimate.org/papers/EasterlingetalOct03BAMS.pdf.
|
|
|
| [23] |
Ebi K L, Capon A, Berry P, et al. 2021. Hot weather and heat extremes: health risks. The Lancet, 398(10301): 698-708.
doi: 10.1016/S0140-6736(21)01208-3
|
|
|
| [24] |
Eckstein D, Künzel V, Schäfer L. 2021. Global Climate Risk Index 2021. Bonn: Germanwatch.
|
|
|
| [25] |
FAO (Food and Agriculture Organization of the United Nations). 2023. Jordan Climate Smart Agriculture Action Plan: Investment Opportunities in the Agriculture Sector's Transition to a Climate Resilient Growth Path. Rome: Food and Agriculture Organization of the United Nations.
|
|
|
| [26] |
Frame B, Lawrence J, Ausseil A-G, et al. 2018. Adapting global shared socio-economic pathways for national and local scenarios. Climate Risk Management, 21: 39-51.
doi: 10.1016/j.crm.2018.05.001
|
|
|
| [27] |
Guijarro J A. 2018. Homogenization of climatic series with Climatol. [2025-02-08]. https://repositorio.aemet.es/bitstream/20.500.11765/12185/2/homog_climatol.-en.pdf
|
|
|
| [28] |
Hamdi M, Abu-Allaban M, Al-Shayeb A, et al. 2009. Climate change in Jordan: a comprehensive examination approach. American Journal of Environmental Sciences, 5(1): 58-68.
doi: 10.3844/ajessp.2009.58.68
|
|
|
| [29] |
Hayhoe K, VanDorn J, Croley T, et al. 2010. Regional climate change projections for Chicago and the US Great Lakes. Journal of Great Lakes Research, 36(S2): 7-21.
doi: 10.1016/j.jglr.2010.03.012
|
|
|
| [30] |
Hazaymeh K, Zeitoun M, Almagbile A, et al. 2024. Exploring the dynamics of land surface temperature in Jordan's local climate zones: a comprehensive assessment through Landsat entire archive and Google Earth Engine. Atmosphere, 15(3): 318, doi: 10.3390/atmos15030318.
|
|
|
| [31] |
Hoag H. 2014. Russian summer tops 'universal' heatwave index. Nature, 510(7504): 16250, doi: 10.1038/nature.2014.16250.
|
|
|
| [32] |
Huang C M, Liu H L, Li H, et al. 2023. Combined effects of ENSO and PDO on activity of major hurricanes in the Eastern North Pacific. Climate Dynamics, 2: 1467-1486.
|
|
|
| [33] |
Hussain A, Cao J H, Ali S, et al. 2022. Wavelet coherence of monsoon and large-scale climate variabilities with precipitation in Pakistan. International Journal of Climatology, 42(16): 9950-9966.
doi: 10.1002/joc.v42.16
|
|
|
| [34] |
IPCC (Intergovernmental Panel on Climate Change). 2019. Climate Change and Land: An IPCC Special Report on Climate Change, Desertification, Land Degradation, Sustainable Land Management, Food Security, and Greenhouse Gas Fluxes in Terrestrial Ecosystems. Geneva: IPCC.
|
|
|
| [35] |
IPCC (Intergovernmental Panel on Climate Change). 2022. Impacts, Adaptation, and Vulnerability. Contribution of Working Group II to the Sixth Assessment Report of the Intergovernmental Panel on Climate Change. Geneva: IPCC.
|
|
|
| [36] |
IPCC (Intergovernmental Panel on Climate Change). 2023. Climate change 2023:Synthesis report. Contribution of Working Groups I, II and III to the Sixth Assessment Report of the Intergovernmental Panel on Climate Change. Geneva: IPCC.
|
|
|
| [37] |
Köppen W, Wegener A. 2015. The Climates of the Geological Past. Stuttgart: Borntraeger Scientific Publishers.
|
|
|
| [38] |
Linnenluecke M K, Griffiths A, Winn M I. 2013. Firm and industry adaptation to climate change: a review of climate adaptation studies in the business and management field. WIREs Climate Change, 4(5): 397-416.
doi: 10.1002/wcc.2013.4.issue-5
|
|
|
| [39] |
Marzouk O A. 2021. Assessment of global warming in Al Buraimi, Sultanate of Oman, based on statistical analysis of NASA POWER data over 39 years, and testing the reliability of NASA POWER against meteorological measurements. Heliyon, 7(3): e06625, doi: 10.1016/j.heliyon.2021.e06625.
|
|
|
| [40] |
MoEnv (Ministry of Environment). 2022. National adaptation plan (NAP): The Hashemite Kingdom of Jordan. Amman: MoEnv. [2025-04-15]. https://www.moenv.gov.jo/ebv4.0/root_storage/en/eb_list_page/national_adaptation_plan.pdf.
|
|
|
| [41] |
Newman M, Alexander M A, Ault T R, et al. 2016. The Pacific Decadal Oscillation, revisited. Journal of Climate, 29(12): 4399-4427.
doi: 10.1175/JCLI-D-15-0508.1
|
|
|
| [42] |
Pascal M, Wagner V, Lagarrigue R, et al. 2024. A yearly measure of heat-related deaths in France, 2014-2023. Discover Public Health, 21(1): 44, doi: 10.1186/s12982-024-00164-3.
|
|
|
| [43] |
Perera A T D, Nik V M, Chen D L, et al. 2020. Quantifying the impacts of climate change and extreme climate events on energy systems. Nature Energy, 5(2): 150-159.
doi: 10.1038/s41560-020-0558-0
|
|
|
| [44] |
Resource Watch. 2025. Water stress country ranking. Washington DC: World Resources Institute. [2025-06-30]. https://resourcewatch.org/data/explore/wat036rw1-Water-Stress-Country-Ranking.
|
|
|
| [45] |
Rodrigues G C, Braga R P. 2021. Evaluation of NASA POWER reanalysis products to estimate daily weather variables in a hot summer Mediterranean climate. Agronomy, 11(6): 1207, doi: 10.3390/agronomy11061207.
|
|
|
| [46] |
Safriel U. 2017. Land degradation neutrality (LDN) in drylands and beyond-where has it come from and where does it go? Silva Fennica, 51(1): 1650, doi: 10.14214/sf.1650.
|
|
|
| [47] |
Shatnawi N, Alqaralleh R M, Tarawneh E R. 2025. Urban heat island in Amman: AI-based modeling of urban morphology and green infrastructure in mitigating thermal stress. Environmental Earth Sciences, 84(17): 498, doi: 10.1007/s12665-025-12507-7.
|
|
|
| [48] |
Siders A R, Hino M, Mach K J. 2019. The case for strategic and managed climate retreat. Science, 365(6455): 761-763.
doi: 10.1126/science.aax8346
pmid: 31439787
|
|
|
| [49] |
Smadi M M. 2006. Observed abrupt changes in minimum and maximum temperatures in Jordan in the 20th century. American Journal of Environmental Sciences, 2(3): 114-120.
doi: 10.3844/ajessp.2006.114.120
|
|
|
| [50] |
Ta'any R, Masalha L, Khresat S E, et al. 2014. Climate change adaptation: a case study in Azraq Basin, Jordan. International Journal of Current Microbiology and Applied Sciences, 3: 108-122.
|
|
|
| [51] |
UNEP (United Nations Environment Programme). 2022. Adaptation gap report 2022:Too little, too slow-climate adaptation failure puts world at risk. Nairobi: UNEP. [2025-04-15]. https://www.unep.org/resources/adaptation-gap-report-2022.
|
|
|
| [52] |
WMO (World Meteorological Organization). 2024. WMO confirms that 2023 smashes global temperature record. Geneva: WMO. [2025-04-16]. https://wmo.int/news/media-centre/wmo-confirms-2023-smashes-global-temperature-record.
|
|
|
| [53] |
World Bank Group. 2025. The World Bank in Jordan. Washington DC: World Bank Group. [2025-04-30]. https://climateknowledgeportal.worldbank.org/country/jordan.
|
|
|
| [54] |
Zeppel M, Lewis J, Phillips N, et al. 2014. Consequences of nocturnal water loss: A synthesis of regulating factors and implications for capacitance, embolism and use in models. Tree Physiology, 34(10): 1047-1055.
doi: 10.1093/treephys/tpu089
pmid: 25413023
|
|
|
| [55] |
Zhang X, Yang F. 2004. RClimDex (1.0)—User manual. Climate Research Branch, Environment Canada, Downsview, Ontario. [2025-04-30]. https://studylib.net/doc/7659063/rclimdex-1-climate-change-indices.
|
|
|
| [56] |
Zhang X B, Alexander L, Hegerl G C, et al. 2011. Indices for monitoring changes in extremes based on daily temperature and precipitation data. WIREs Climate Change, 2(6): 851-870.
doi: 10.1002/wcc.v2.6
|
|
|
| [57] |
Zhu H F, Shao X M, Zhang H, et al. 2019. Trees record changes of the temperate glaciers on the Tibetan Plateau: Potential and uncertainty. Global and Planetary Change, 173: 15-23.
doi: 10.1016/j.gloplacha.2018.12.004
|
|
|
| [58] |
Zittis G, Almazroui M, Alpert P, et al. 2022. Climate change and weather extremes in the Eastern Mediterranean and Middle East. Reviews of Geophysics, 60(3): e2021RG000762, doi: 10.1029/2021RG000762.
|
|
|
|
Viewed |
|
|
|
Full text
|
|
|
|
|
Abstract
|
|
|
|
|
Cited |
|
|
|
|
| |
Shared |
|
|
|
|
| |
Discussed |
|
|
|
|