| Research article |
|


|
|
|
| Effect of the W-beam central guardrails on wind-blown sand deposition on desert expressways in sandy regions |
WANG Cui1,2,3,4, LI Shengyu1,*( ), LEI Jiaqiang1, LI Zhinong3, CHEN Jie3 ), LEI Jiaqiang1, LI Zhinong3, CHEN Jie3 |
1 Xinjiang Institute of Ecology and Geography, Chinese Academy of Sciences, Urumqi 830011, China
2 College of Resource and Environment Sciences, Xinjiang University, Urumqi 830046, China
3 Xinjiang Academy of Transportation Sciences, Urumqi 830000, China
4 University of Chinese Academy of Sciences, Beijing 100049, China |
|
|
|
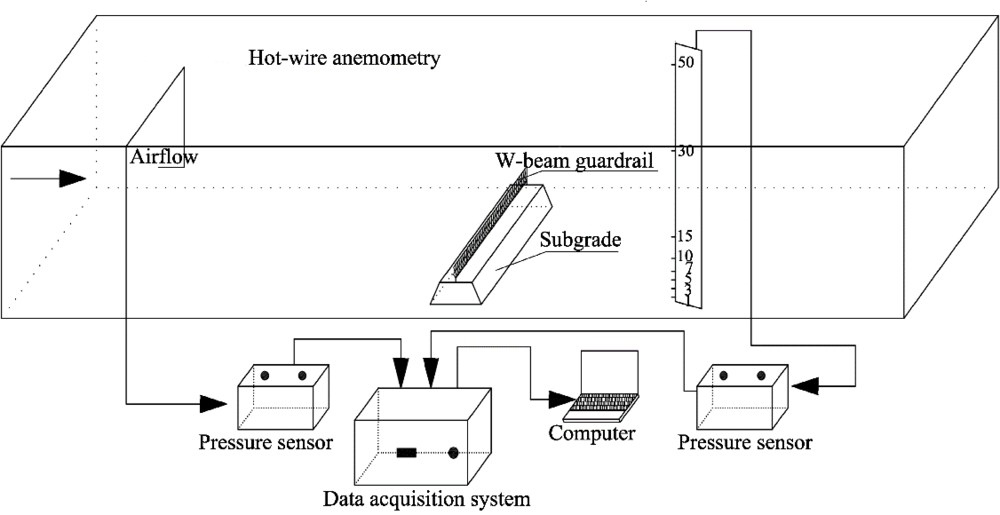
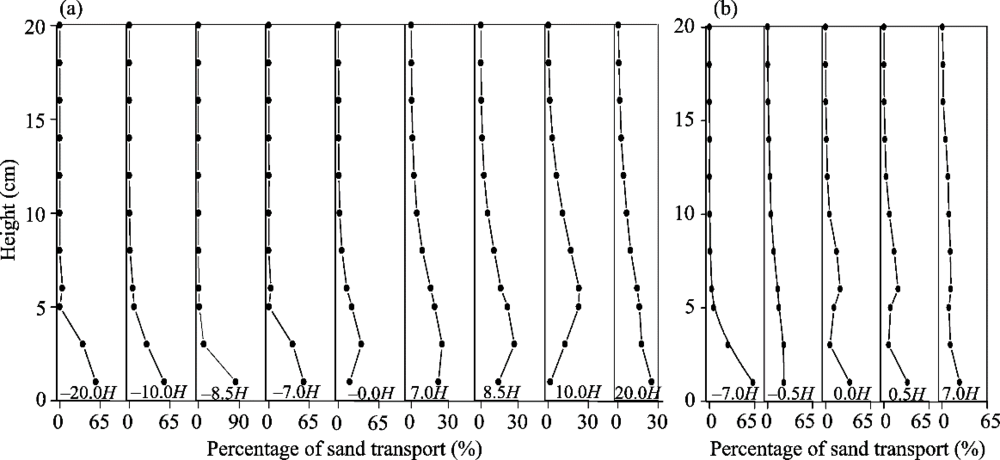
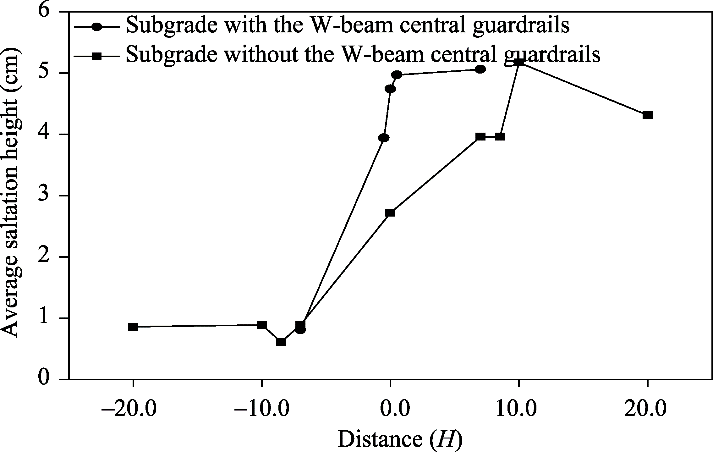
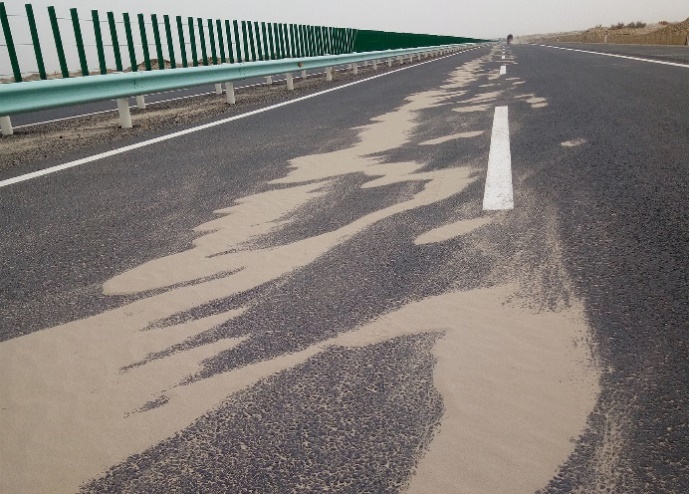
Abstract Many desert expressways are affected by the deposition of the wind-blown sand, which might block the movement of vehicles or cause accidents. W-beam central guardrails, which are used to improve the safety of desert expressways, are thought to influence the deposition of the wind-blown sand, but this has yet not to be studied adequately. To address this issue, we conducted a wind tunnel test to simulate and explore how the W-beam central guardrails affect the airflow, the wind-blown sand flux and the deposition of the wind-blown sand on desert expressways in sandy regions. The subgrade model is 3.5 cm high and 80.0 cm wide, with a bank slope ratio of 1:3. The W-beam central guardrails model is 3.7 cm high, which included a 1.4-cm-high W-beam and a 2.3-cm-high stand column. The wind velocity was measured by using pitot-static tubes placed at nine different heights (1, 2, 3, 5, 7, 10, 15, 30 and 50 cm) above the floor of the chamber. The vertical distribution of the wind-blown sand flux in the wind tunnel was measured by using the sand sampler, which was sectioned into 20 intervals. In addition, we measured the wind-blown sand flux in the field at K50 of the Bachu-Shache desert expressway in the Taklimakan Desert on 11 May 2016, by using a customized 78-cm-high gradient sand sampler for the sand flux structure test. Obstruction by the subgrade leads to the formation of two weak wind zones located at the foot of the windward slope and at the leeward slope of the subgrade, and the wind velocity on the leeward side weakens significantly. The W-beam central guardrails decrease the leeward wind velocity, whereas the velocity increases through the bottom gaps and over the top of the W-beam central guardrails. The vertical distribution of the wind-blown sand flux measured by wind tunnel follows neither a power-law nor an exponential function when affected by either the subgrade or the W-beam central guardrails. At 0.0H and 0.5H (where H=3.5 cm, which is the height of the subgrade), the sand transport is less at the 3 cm height from the subgrade surface than at the 1 and 5 cm heights as a result of obstruction by the W-beam central guardrails, and the maximum sand transportation occurs at the 5 cm height affected by the subgrade surface. The average saltation height in the presence of the W-beam central guardrails is greater than the subgrade height. The field test shows that the sand deposits on the overtaking lane leeward of the W-beam central guardrails and that the thickness of the deposited sand is determined by the difference in the sand mass transported between the inlet and outlet points, which is consistent with the position of the minimum wind velocity in the wind tunnel test. The results of this study could help us to understand the hazards of the wind-blown sand onto subgrade with the W-beam central guardrails.
|
|
Received: 27 July 2019
Published: 10 February 2020
|
|
Corresponding Authors:
|
| About author: *Corresponding author: LI Shengyu (E-mail: oasis@ms.xjb.ac.cn) |
|
|
| [1] |
Bagnold R A. 1941. The Physics of Blown Sand and Desert Dunes. London: Methuen, 1-265.
|
|
|
| [2] |
Cheng H, He J J, Xu X R, et al. 2015. Blown sand motion within the sand-control system in the southern section of the Taklimakan Desert freeway. Journal of Arid Land, 7(5): 599-611.
|
|
|
| [3] |
Cornelis W M, Gabriels D. 2005. Optimal windbreak design for wind-erosion control. Journal of Arid Environments, 61(2): 315-332.
|
|
|
| [4] |
Dong Z B, Liu X P, Wang H T, et al. 2003. The flux profile of a blowing sand cloud: a wind tunnel investigation. Geomorphology, 49(3-4): 219-230.
|
|
|
| [5] |
Dong Z B, Wang H T, Liu X P, et al. 2004. The blown sand flux over a sandy surface: a wind tunnel investigation on the fetch effect. Geomorphology, 57(1-2):117-127.
|
|
|
| [6] |
Dong Z B, Qian G Q, Luo W Y, et al. 2006. Threshold velocity for wind erosion: the effects of porous fences. Environmental Geology, 51: 471-475.
|
|
|
| [7] |
Dong Z B, Luo W Y, Qian G Q, et al. 2007. A wind tunnel simulation of the mean velocity fields behind upright porous fences. Agricultural and Forest Meteorology, 146(1-2): 82-93.
|
|
|
| [8] |
Huang N, Xia X P, Tong D. 2013. Numerical simulation of wind sand movement in straw checkerboard barriers. The European Physical Journal E, 36(99): 1-7.
|
|
|
| [9] |
Jason M H, Venky N S, Gudmundur F U. 2005. The crash severity impacts of fixed roadside objects. Journal of Safety Research, 36(2): 139-147.
|
|
|
| [10] |
Lee S J, Kim H B. 1999. Laboratory measurements of velocity and turbulence field behind porous fences. Journal of Wind Engineering Industrial Aerodynamics, 80(3): 311-326.
|
|
|
| [11] |
Lei J Q, Li S Y, Jin Z Z, et al. 2008. Synthetic ecological environment effect of engineering of protective belts along desert freeway in Tarim Basin. Chinese Science Bulletin, 53(Supp 1): 169-178. (in Chinese)
|
|
|
| [12] |
Li B L, Douglas J S. 2015. Aerodynamics and morphodynamics of sand fences: A review. Aeolian Research, 17: 33-48
|
|
|
| [13] |
Li S Y, Fan J L, Wang H F, et al. 2016. Causes and thoughts of comprehensive control of blown sand disaster at Qiaha Bridge of National Highway 315, in Cele County, Xinjiang, Northwest China. Arid Land Geography, 39(4): 754-760. (in Chinese)
|
|
|
| [14] |
Liu X P, Dong Z B. 2004. Experimental investigation of the concentration profile of a blowing sand cloud. Geomorphology, 60(3-4): 371-381.
|
|
|
| [15] |
Ni J R, Li Z S. 2001. Near-bed velocity profiles in blown-sand flow. Journal of Sediment Research, (3): 16-23. (in Chinese)
|
|
|
| [16] |
Thomas P, Eric J R P, Jasper F K, et al. 2014. Analytical model for flux saturation in sediment transport. Physical Review E, 89(5): 05223, doi: 10.1103/PhysRevE.89.052213.
|
|
|
| [17] |
Wang C, Li S Y, Chen J. 2016. The utility model relates to a synchronous integrated observation device for road sand transport and wind speed. China, Patent No.: 201621382728.6. [2017-06-13]. (in Chinese)
|
|
|
| [18] |
Wang T, Qu J J, Ling Y Q, et al. 2017. Wind tunnel test on the effect of metal net fences on sand flux in a Gobi Desert, China. Journal of Arid Land, 9(6): 888-899.
|
|
|
| [19] |
White B R. 1996. Laboratory simulation of aeolian sand transport and physical modeling of flow around dunes. Annals of Arid Zone, 35(3): 187-213.
|
|
|
| [20] |
Wu Z. 1987. Aeolian Geomorphology. Beijing: Science Press, 1-316. (in Chinese)
|
|
|
| [21] |
Xu B, Zhang J, Huang N, et al. 2018. Characteristics of turbulent aeolian sand movement over straw checkerboard barriers and formation mechanisms of their internal erosion form. Journal of Geophysical Research: Atmospheres, 123(13): 6907-6919.
|
|
|
| [22] |
Yang S Q, Liu T, Hao P W. 2010. Wind tunnel experiment on conveying sand performance about embankment of desert highway. China Journal of Highway and Transport, 23(1): 7-12. (in Chinese)
|
|
|
| [23] |
Yang X H, Xu X L, He Q, et al. 2011. Sand flux estimation during a sand-dust storm at Tazhong area of Taklimakan Desert, China. Journal of Arid Land, 3(3): 199-205.
|
|
|
| [24] |
Zhan K, Liu S, Yang Z, et al. 2017. Effects of sand-fixing and windbreak forests on wind flow: a synthesis of results from field experiments and numerical simulations. Journal of Arid Land, 9(1): 1-12.
|
|
|
| [25] |
Zhang K C, Zhang W M, Tan L H, et al. 2015. Effects of gravel mulch on aeolian transport: a field wind tunnel simulation. Journal of Arid Land, 7(3): 296-303.
|
|
|
| [26] |
Zhang N, Jong H K, Sang J L. 2010. Wind tunnel observation on the effect of a porous wind fence on the shelter of saltating sand particles. Geomorphology, 120(3-4): 224-232.
|
|
|
| [27] |
Zheng X J, Ma G S, Huang N. 2011. Shelter effect of wind-break wall and its impact on sand deposition. Journal of Desert Research, 31(1): 21-27. (in Chinese)
|
|
|
| [28] |
Zheng Z H, Lei J Q, Li S Y, et al. 2012. Test and evaluation of wind flow characteristics of a portable wind tunnel. Journal of Desert Research, 32(6): 1551-1558. (in Chinese)
|
|
|
|
Viewed |
|
|
|
Full text
|
|
|
|
|
Abstract
|
|
|
|
|
Cited |
|
|
|
|
| |
Shared |
|
|
|
|
| |
Discussed |
|
|
|
|