| Research article |
|


|
|
|
| Evaluation of CRU TS, GPCC, AgMERRA, and AgCFSR meteorological datasets for estimating climate and crop variables: A case study of maize in Qazvin Province, Iran |
Faraz GORGIN PAVEH1,*( ), Hadi RAMEZANI ETEDALI2, Brian COLLINS3 ), Hadi RAMEZANI ETEDALI2, Brian COLLINS3 |
1Syracuse University, Syracuse 13244, USA
2Imam Khomeini International University, Qazvin 34149-16818, Iran
3Centre for Crop Science, The University of Queensland, Brisbane 4072, Australia |
|
|
|
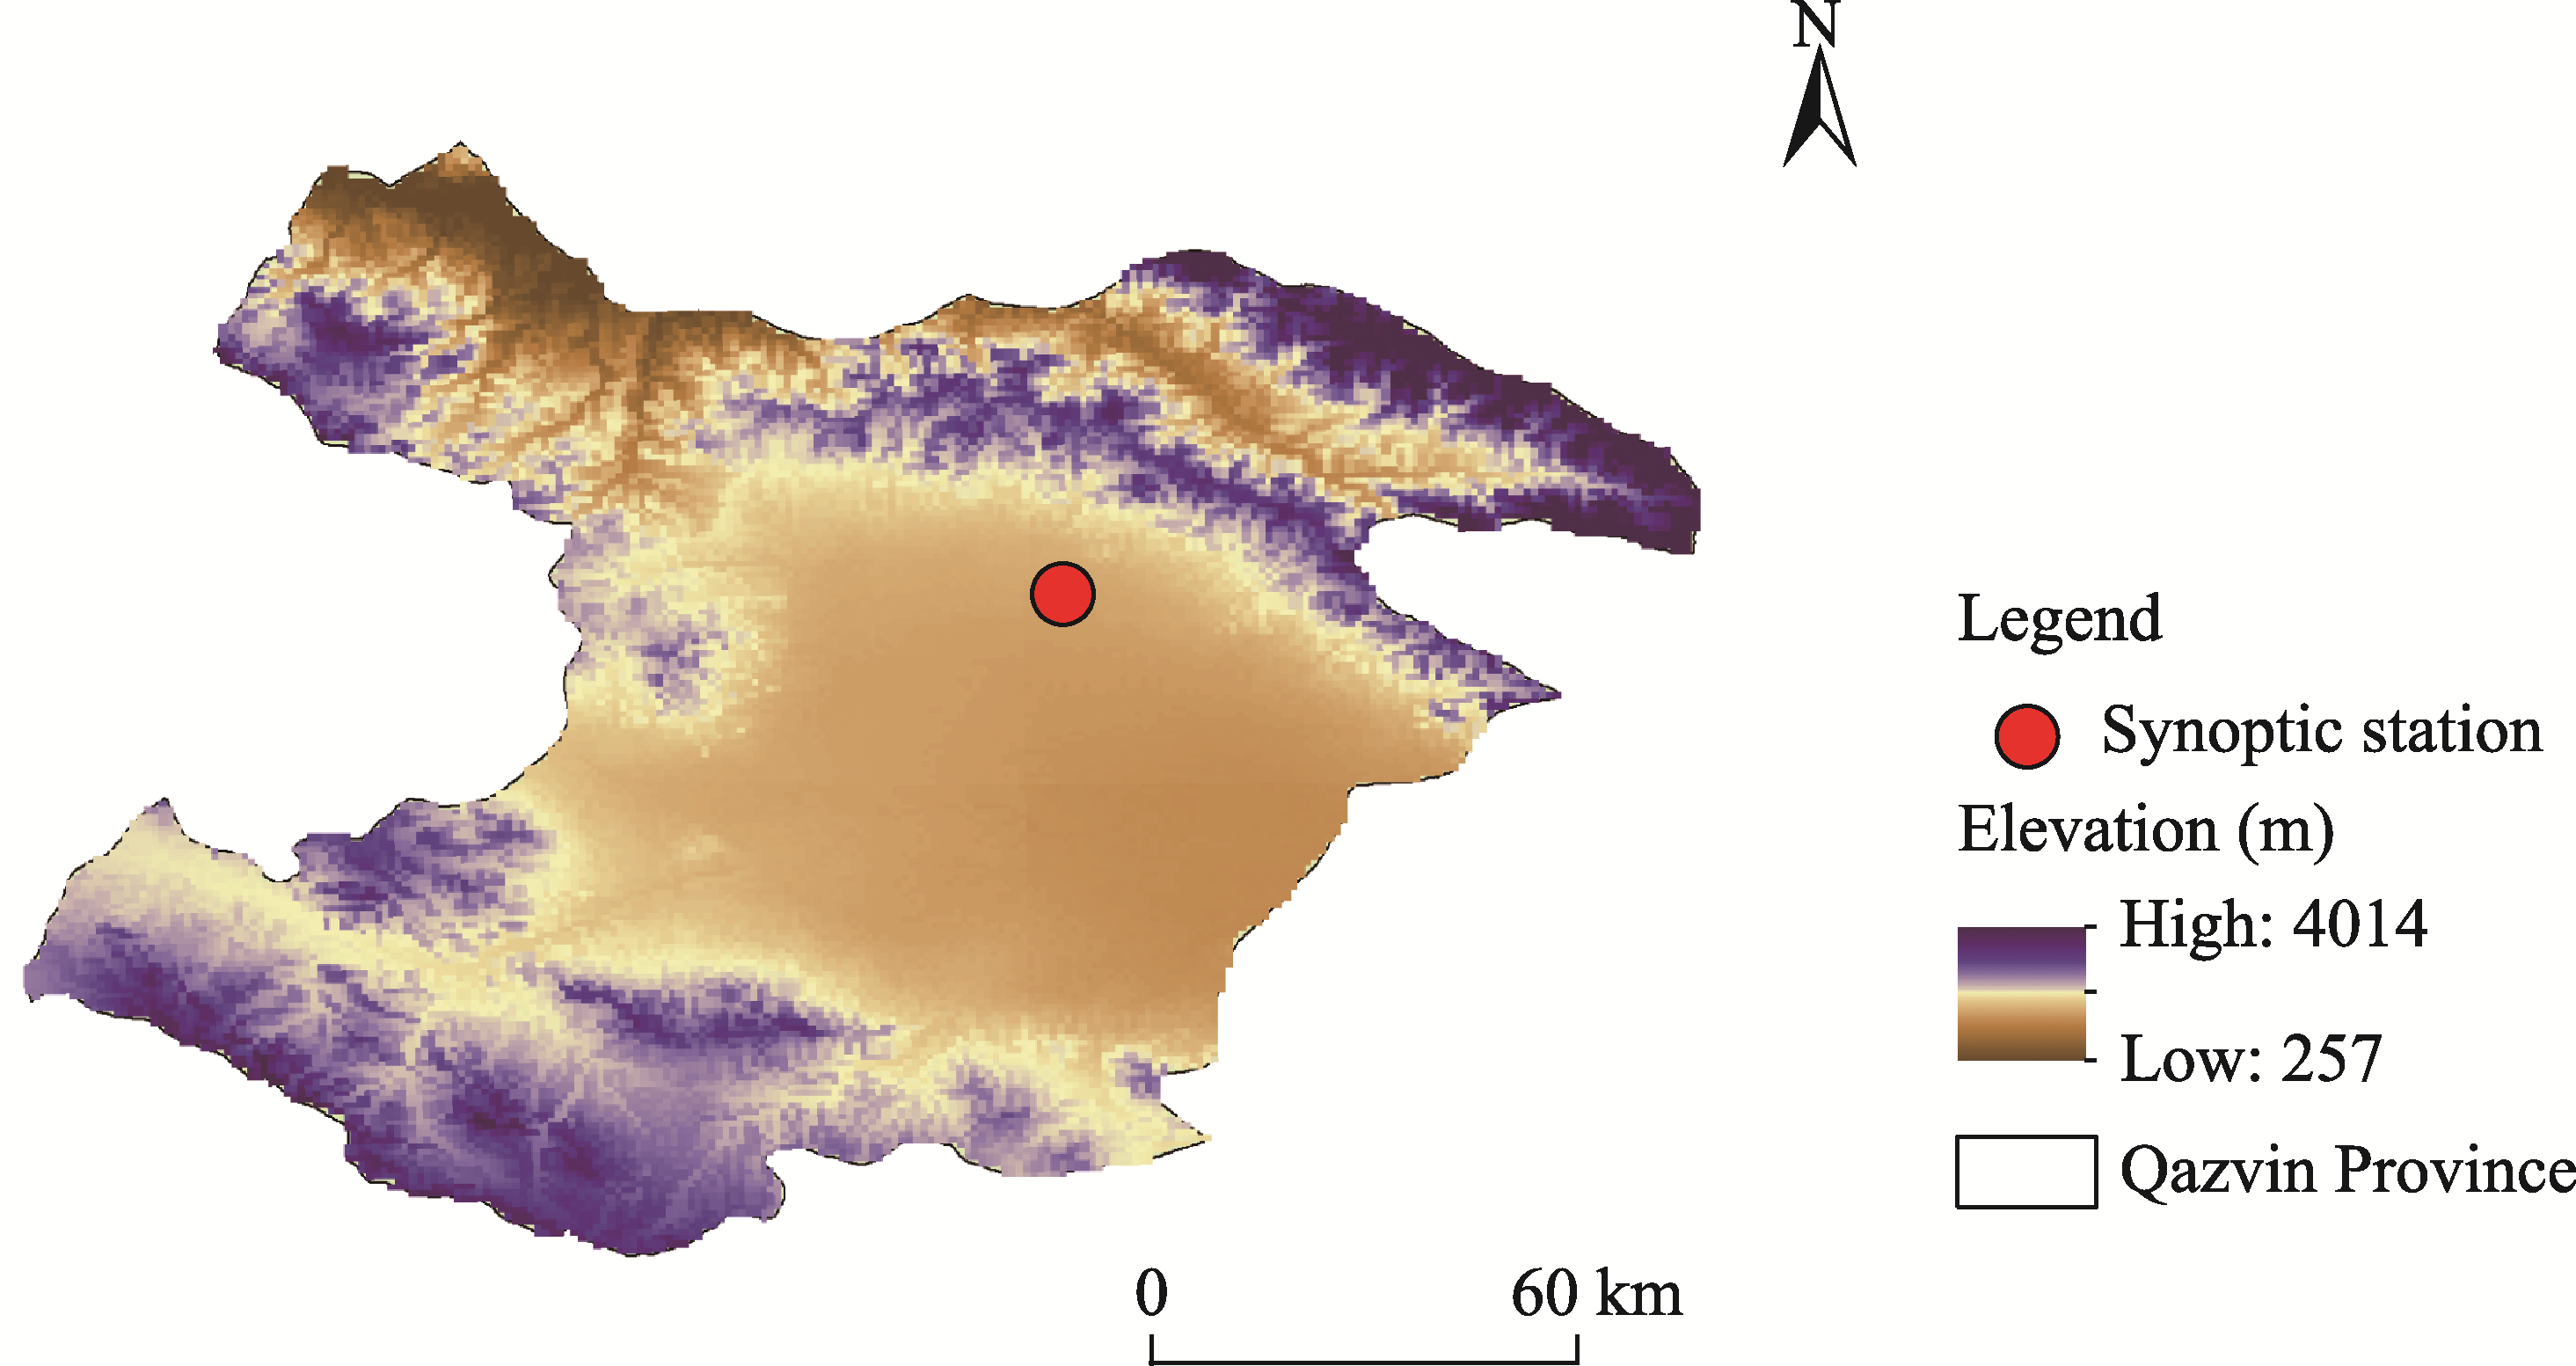
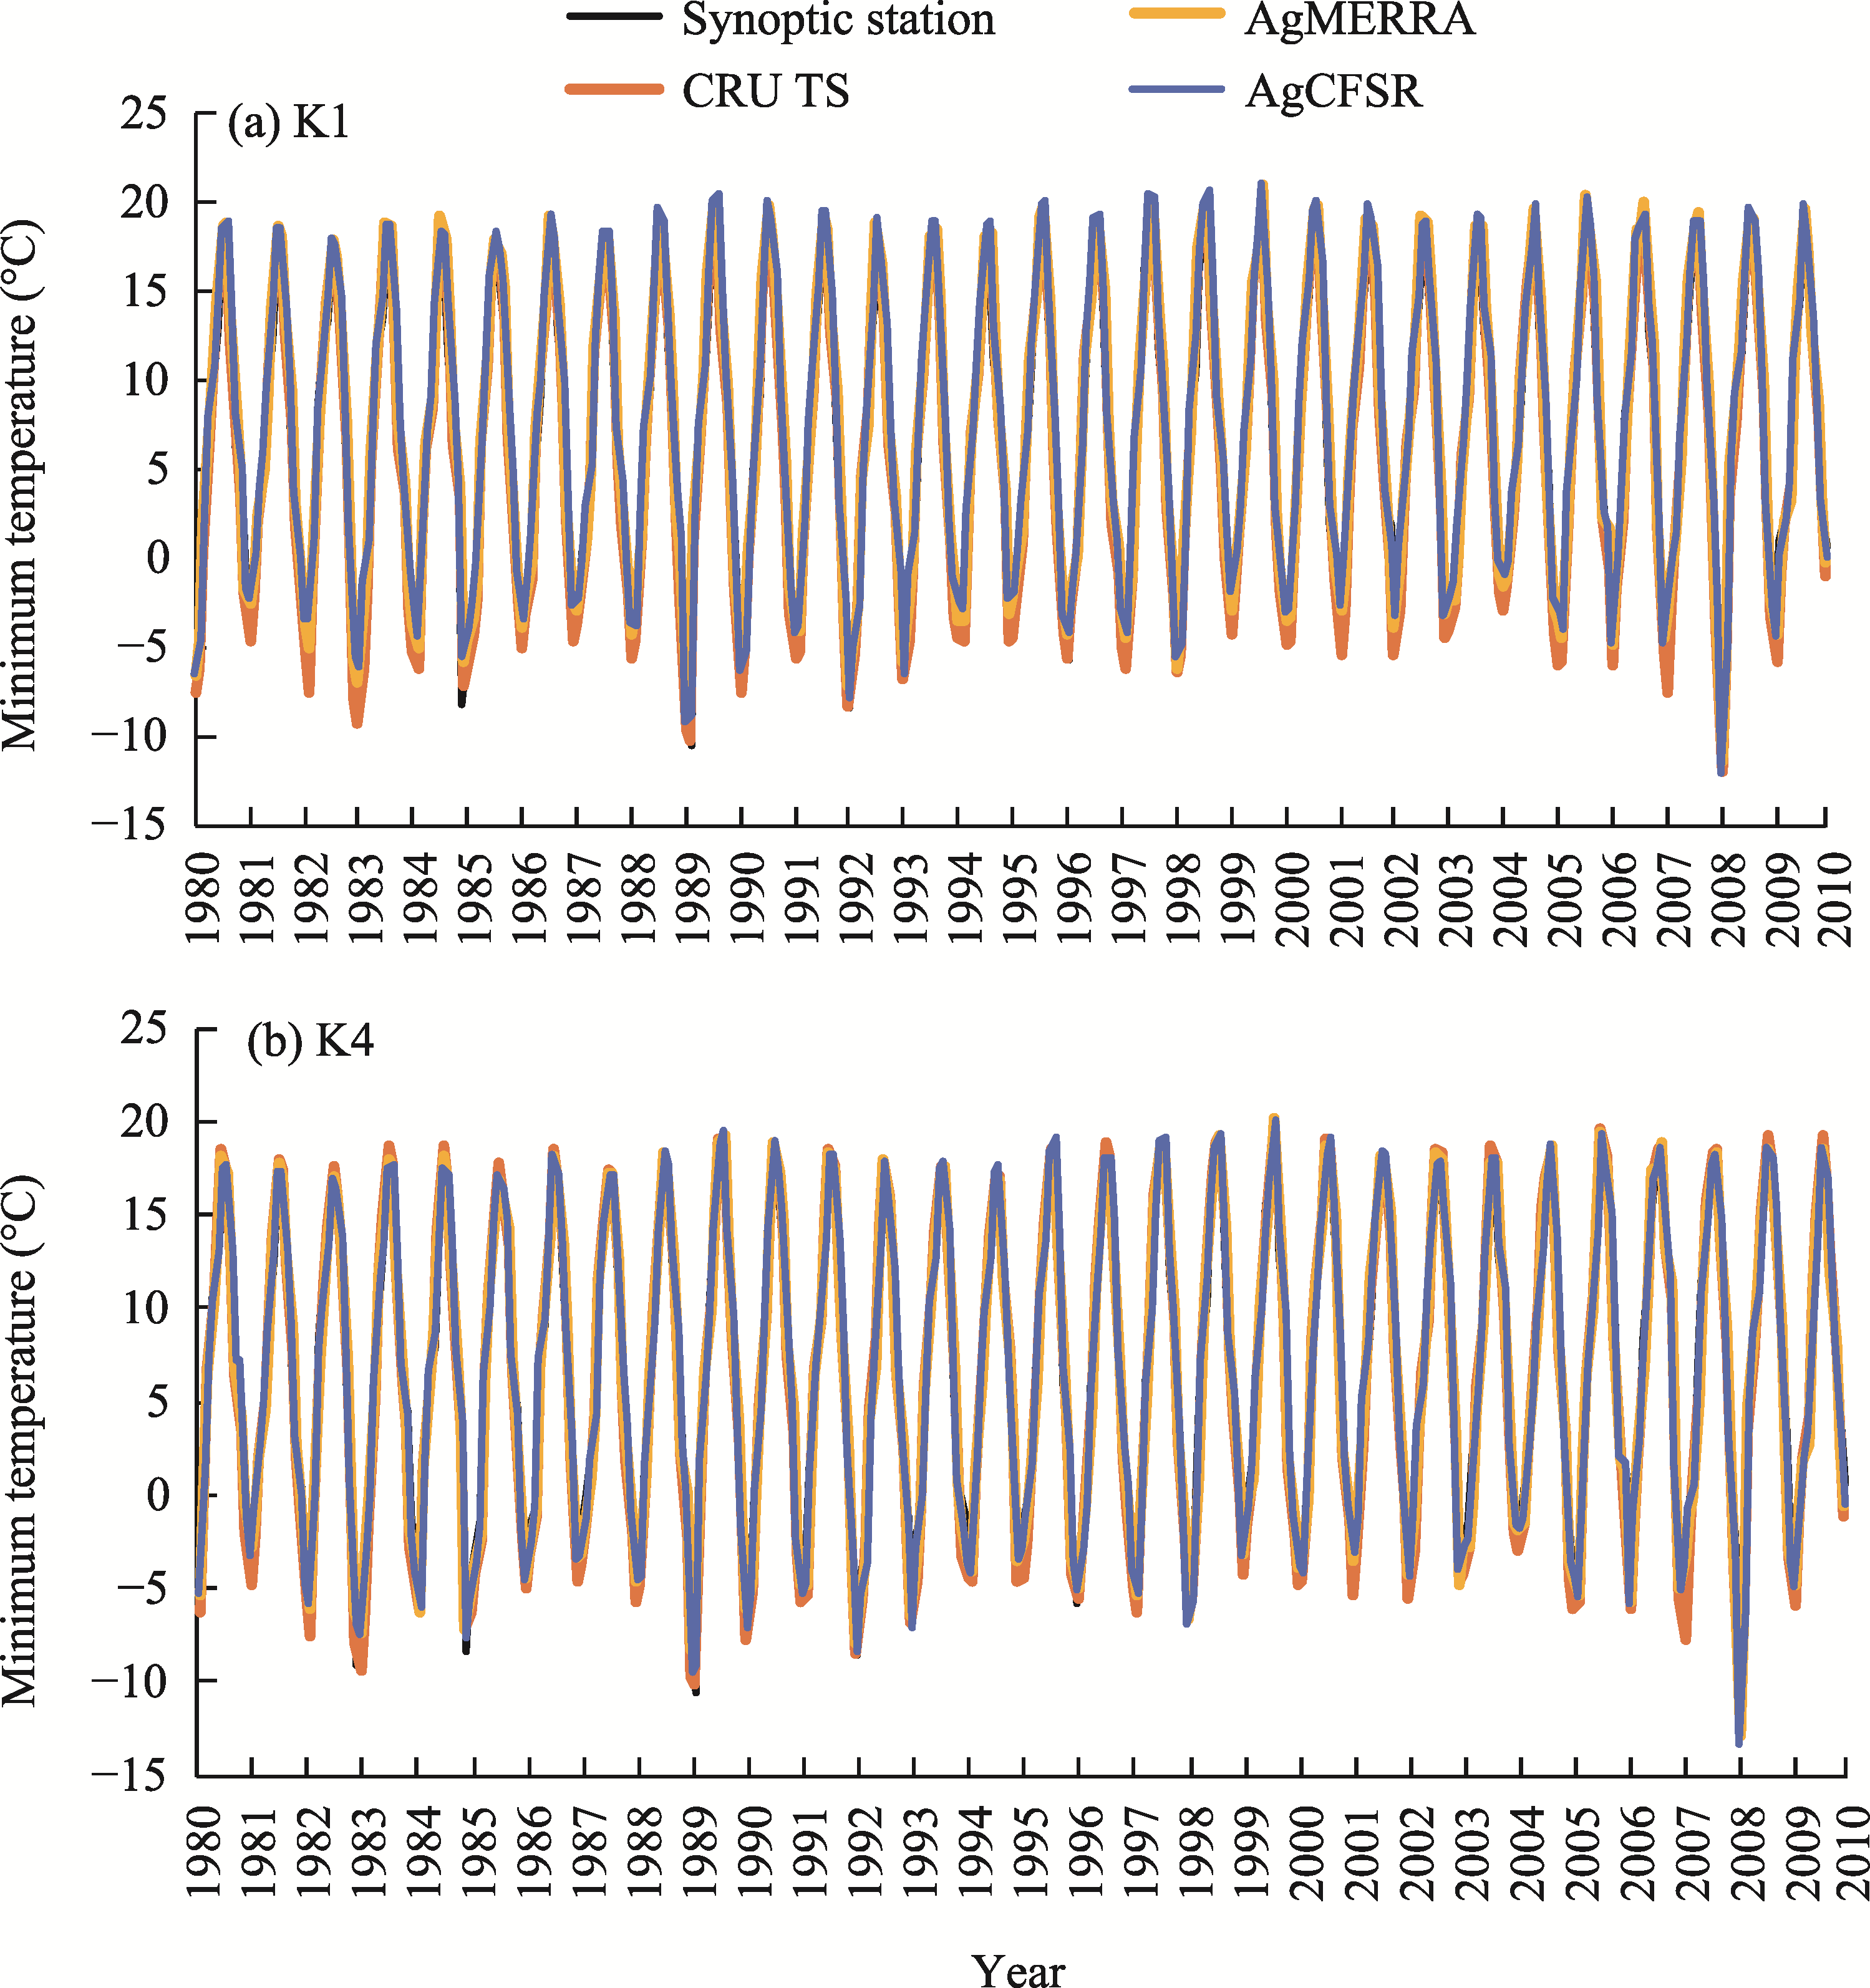
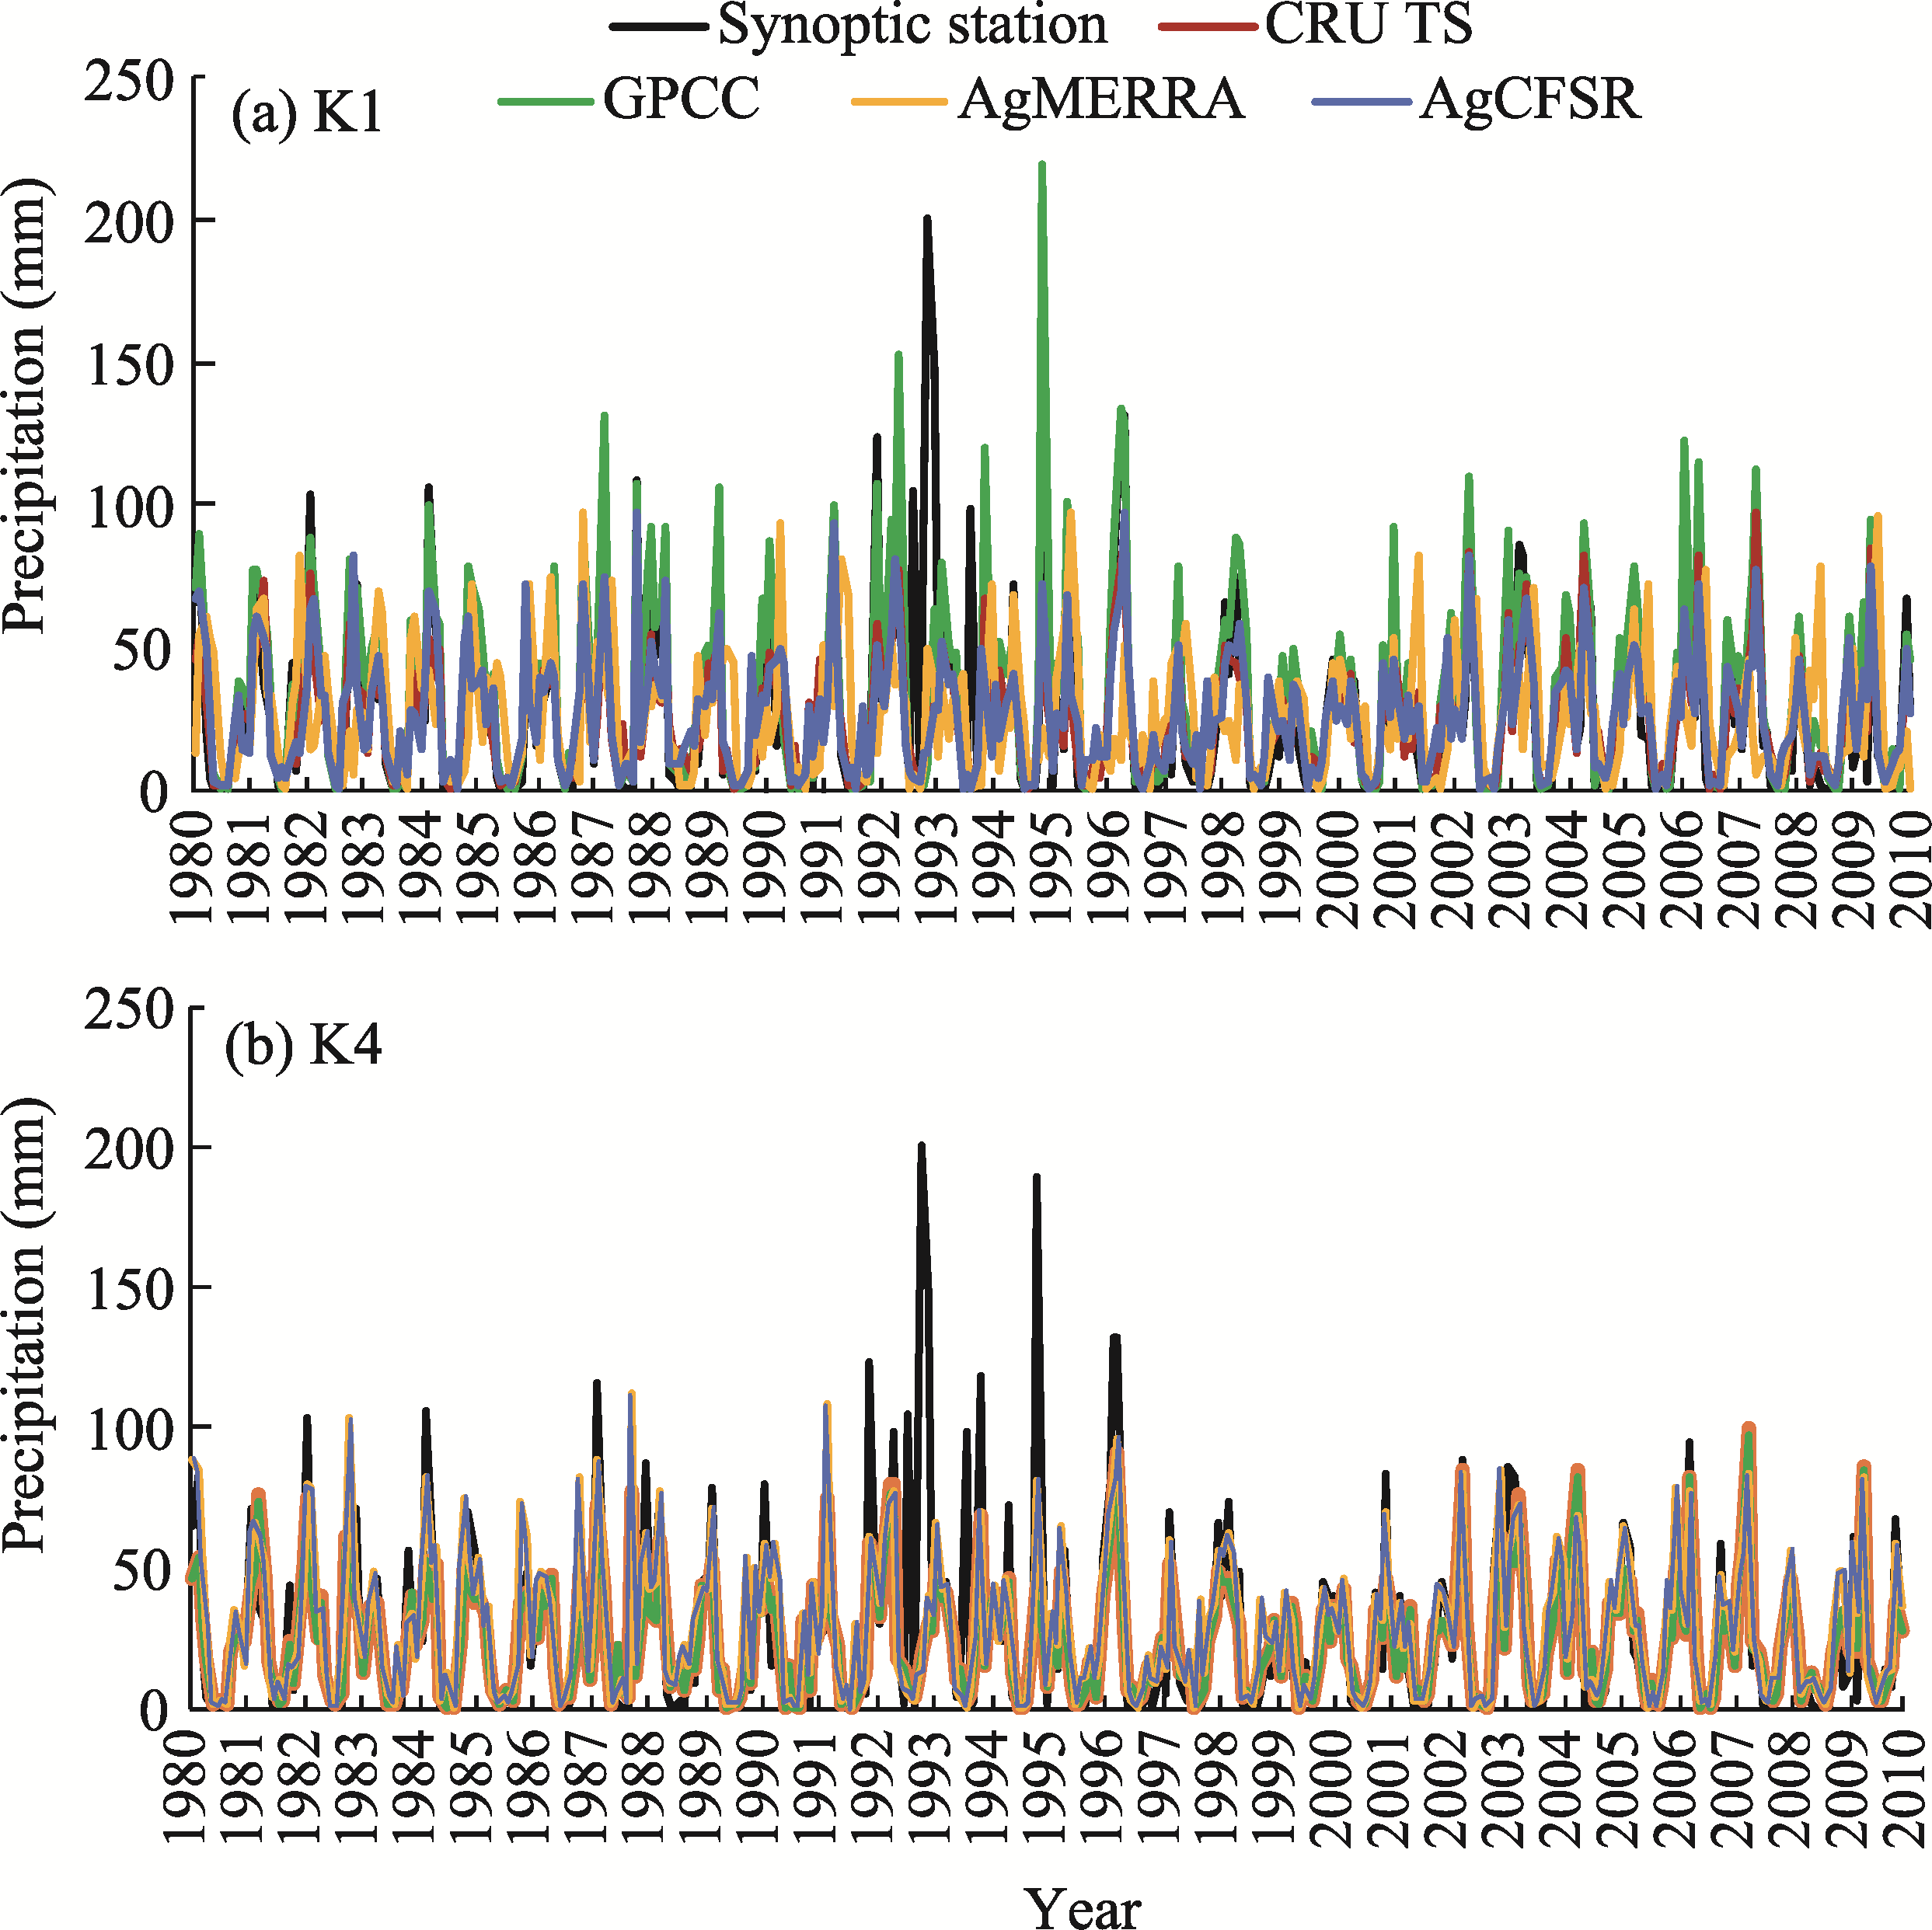
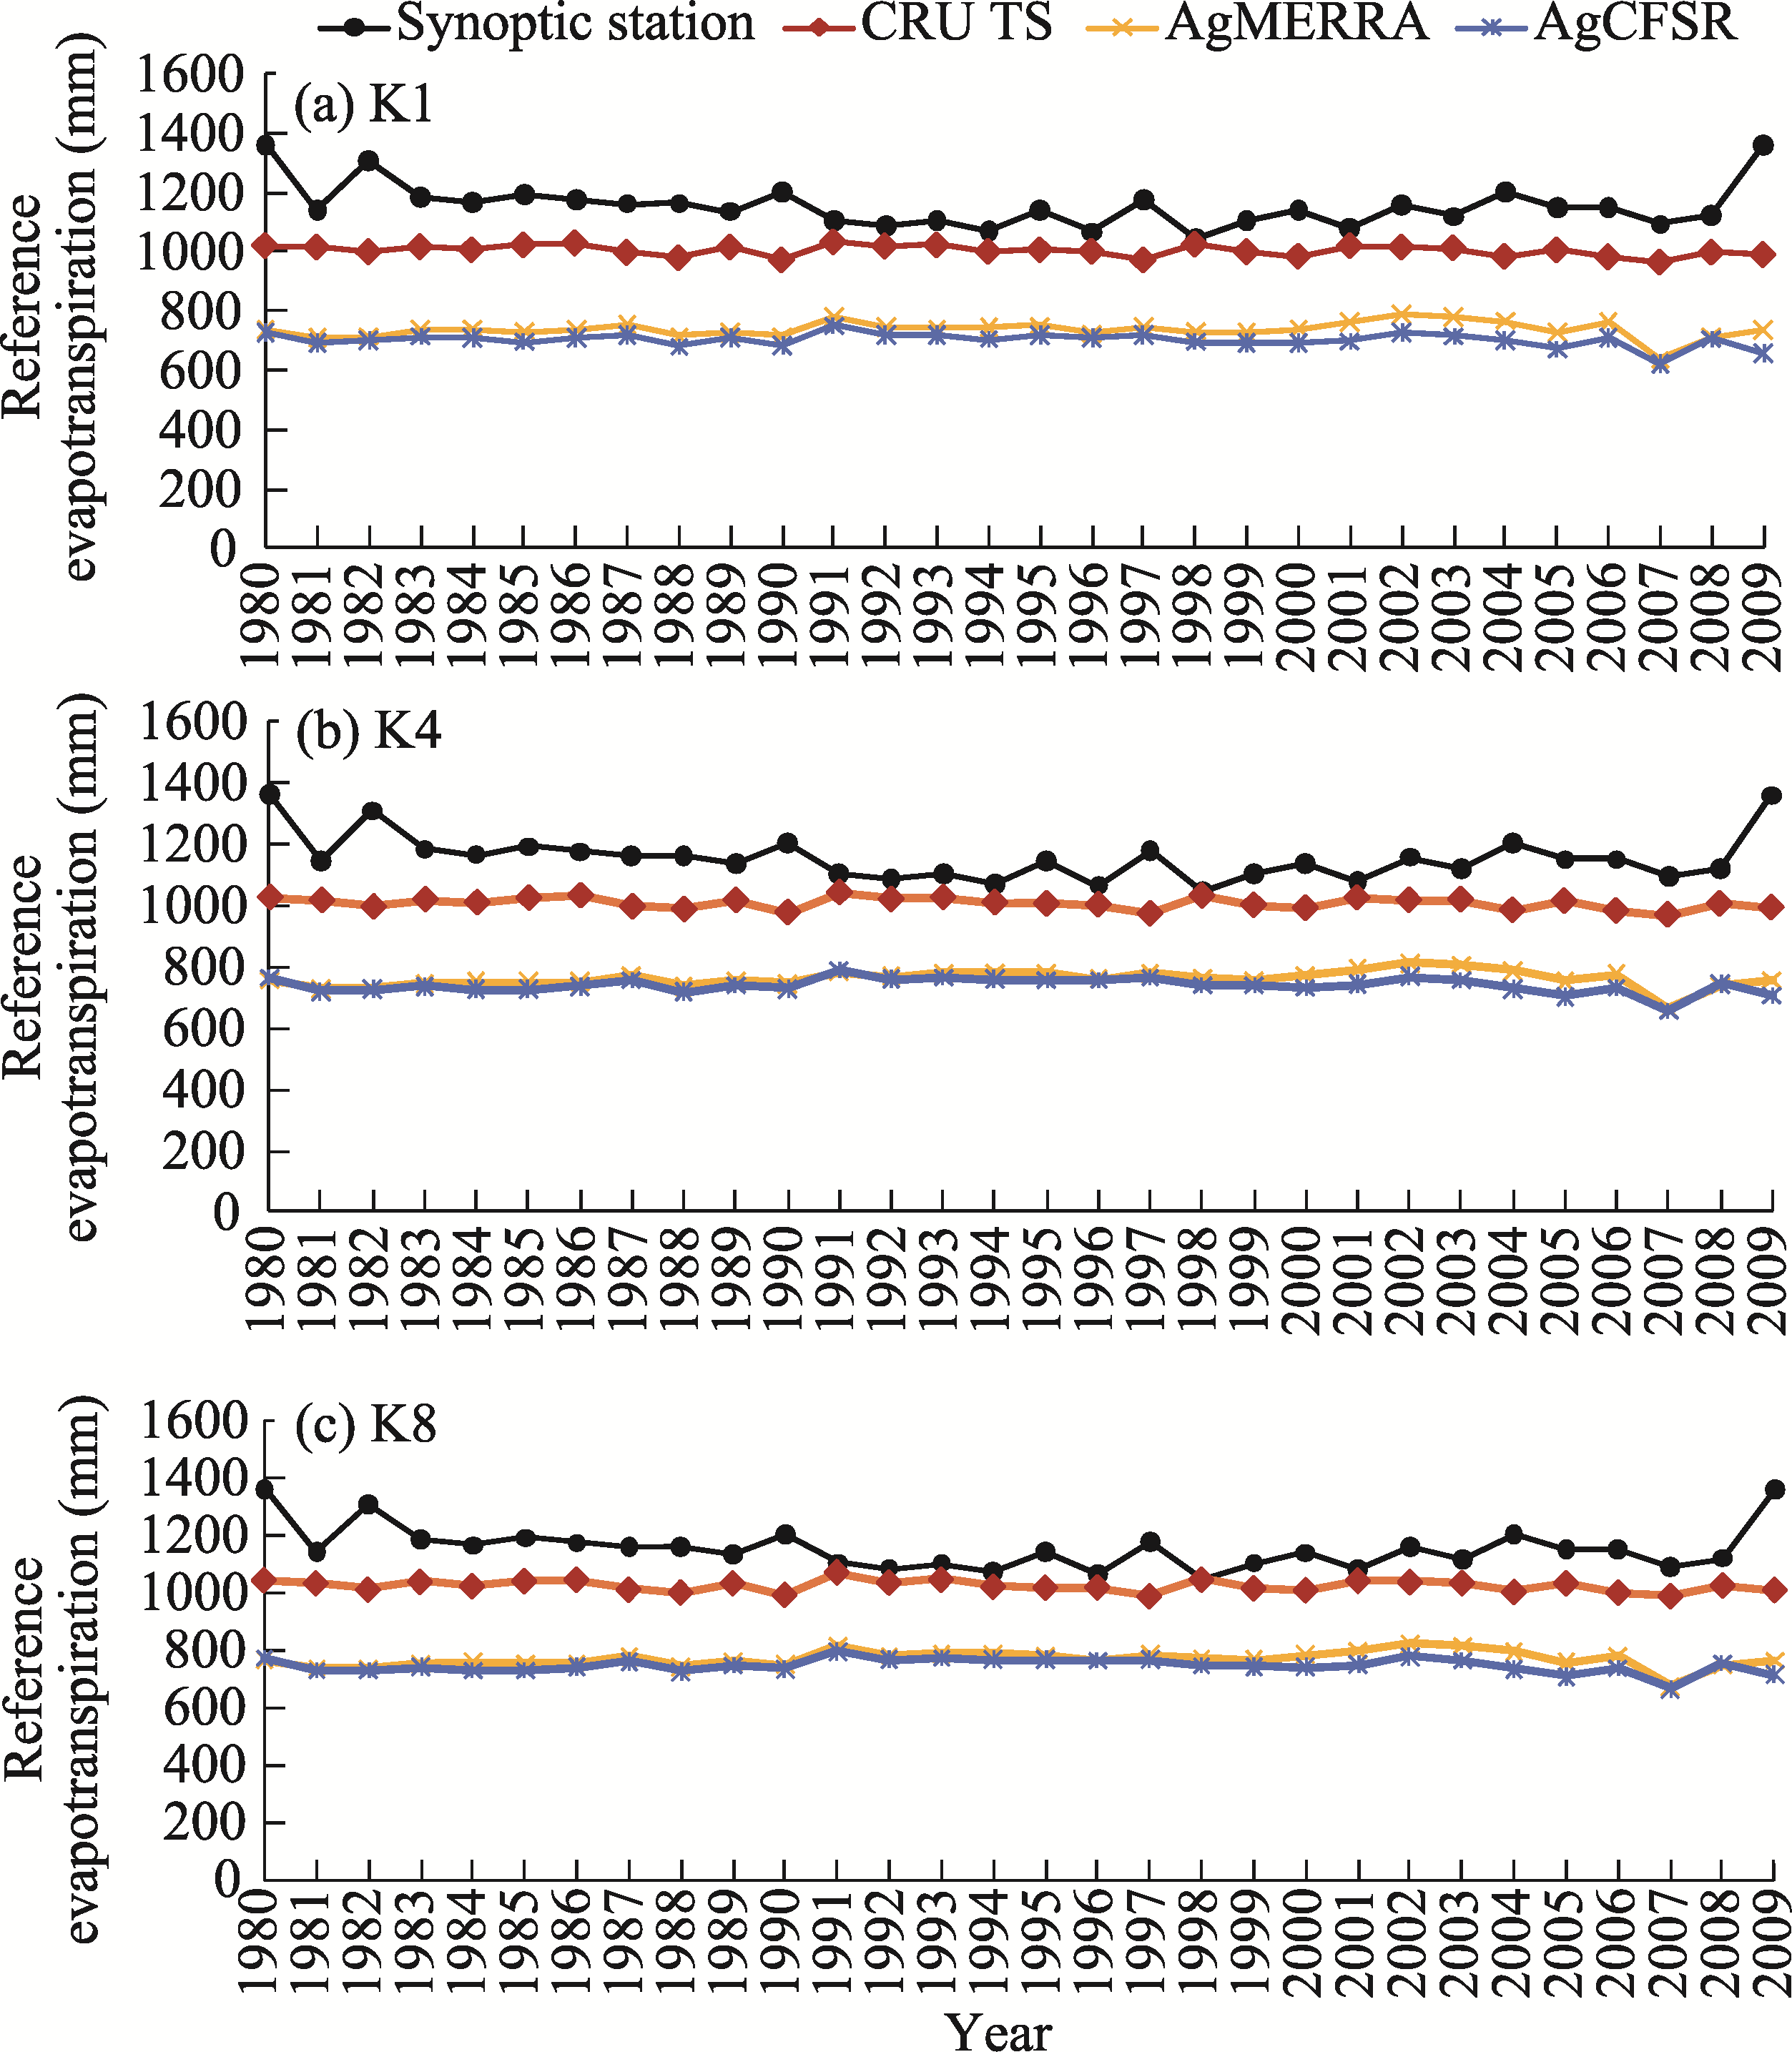
Abstract In the past few decades, meteorological datasets from remote sensing techniques in agricultural and water resources management have been used by various researchers and managers. Based on the literature, meteorological datasets are not more accurate than synoptic stations, but their various advantages, such as spatial coverage, time coverage, accessibility, and free use, have made these techniques superior, and sometimes we can use them instead of synoptic stations. In this study, we used four meteorological datasets, including Climatic Research Unit gridded Time Series (CRU TS), Global Precipitation Climatology Centre (GPCC), Agricultural National Aeronautics and Space Administration Modern-Era Retrospective Analysis for Research and Applications (AgMERRA), Agricultural Climate Forecast System Reanalysis (AgCFSR), to estimate climate variables, i.e., precipitation, maximum temperature, and minimum temperature, and crop variables, i.e., reference evapotranspiration, irrigation requirement, biomass, and yield of maize, in Qazvin Province of Iran during 1980-2009. At first, data were gathered from the four meteorological datasets and synoptic station in this province, and climate variables were calculated. Then, after using the AquaCrop model to calculate the crop variables, we compared the results of the synoptic station and meteorological datasets. All the four meteorological datasets showed strong performance for estimating climate variables. AgMERRA and AgCFSR had more accurate estimations for precipitation and maximum temperature. However, their normalized root mean square error was inferior to CRU for minimum temperature. Furthermore, they were all very efficient for estimating the biomass and yield of maize in this province. For reference evapotranspiration and irrigation requirement CRU TS and GPCC were the most efficient rather than AgMERRA and AgCFSR. But for the estimation of biomass and yield, all the four meteorological datasets were reliable. To sum up, GPCC and AgCFSR were the two best datasets in this study. This study suggests the use of meteorological datasets in water resource management and agricultural management to monitor past changes and estimate recent trends.
|
|
Received: 04 July 2022
Published: 31 December 2022
|
|
Corresponding Authors:
*Faraz GORGIN PAVEH (E-mail: fgorginp@syr.edu)
|
|
|
| [1] |
Abedinpour M, Sarangi A, Rajput T B S, et al. 2012. Performance evaluation of AquaCrop model for maize crop in a semi-arid environment. Agricultural Water Management, 110: 55-66.
doi: 10.1016/j.agwat.2012.04.001
|
|
|
| [2] |
Ahmed K, Shahid S, Wang X, et al. 2019. Evaluation of gridded precipitation datasets over arid regions of Pakistan. Water, 11(2): 210, doi: 10.3390/w11020210.
doi: 10.3390/w11020210
|
|
|
| [3] |
Allen R G, Pereira L S, Raes D, et al. 1998. Crop evapotranspiration-Guidelines for computing crop water requirements. FAO Irrigation and Drainage Paper 56. Rome: FAO, 300(9): D05109.
|
|
|
| [4] |
Apan A A, Raine S R, Le Brocque A, et al. 2004. Spatial prioritization of revegetation sites for dryland salinity management: An analytical framework using GIS. Journal of Environmental Planning and Management, 47(6): 811-825.
doi: 10.1080/0964056042000284848
|
|
|
| [5] |
Bahrololoum R, Ramezani Etedali H, Azizian A, et al. 2020. Use of gridded weather datasets in simulation of wheat yield and water requirement (Case study: Iran's Qazvin Plain). Iranian Journal of Ecohydrology, 7(3): 691-706.
|
|
|
| [6] |
Benevides P, Catalao J, Nico G. 2019. Neural network approach to forecast hourly intense rainfall using GNSS precipitable water vapor and meteorological sensors. Remote Sensing, 11(8): 966, doi: 10.3390/rs11080966.
doi: 10.3390/rs11080966
|
|
|
| [7] |
Bosilovich M G, Chen J, Robertson F R, et al. 2008. Evaluation of global precipitation in reanalyses. Journal of Applied Meteorology and Climatology, 47(9): 2279-2299.
doi: 10.1175/2008JAMC1921.1
|
|
|
| [8] |
Bowen G J, Cai Z, Fiorella R P, et al. 2019. Isotopes in the water cycle: Regional- to global-scale patterns and applications. Annual Review of Earth and Planetary Sciences, 47: 453-479.
doi: 10.1146/annurev-earth-053018-060220
|
|
|
| [9] |
Ceglar A, Toreti A, Balsamo G, et al. 2017. Precipitation over monsoon Asia: A comparison of reanalyses and observations. Journal of Climate, 30(2): 465-476.
doi: 10.1175/JCLI-D-16-0227.1
|
|
|
| [10] |
Confalonieri R, Orlando F, Paleari L, et al. 2016. Uncertainty in crop model predictions: what is the role of users? Environmental Modelling & Software, 81: 165-173.
|
|
|
| [11] |
Daly C, Neilson R P, Phillips D L. 1994. A statistical-topographic model for mapping climatological precipitation over mountainous terrain. Journal of Applied Meteorology and Climatology, 33(2): 140-158.
|
|
|
| [12] |
Dorenbos J, Kassam A H. 1979. Yield Response to Water. In: Food and Agriculture Organization of the United Nations. Rome, Italy.
|
|
|
| [13] |
Duethmann D, Zimmer J, Gafurov A, et al. 2013. Evaluation of areal precipitation estimates based on downscaled reanalysis and station data by hydrological modelling. Hydrology and Earth System Sciences, 17(7): 2415-2434.
doi: 10.5194/hess-17-2415-2013
|
|
|
| [14] |
El-mageed A, Ibrahim M M, Elbeltagi A M. 2017. The effect of water stress on nitrogen status as well as water use efficiency of potato crop under drip irrigation system. Misr Journal of Agricultural Engineering, 34(3): 1351-1374.
doi: 10.21608/mjae.2017.97473
|
|
|
| [15] |
Ge Y, Zhang K, Yang X. 2019. A 110-year pollen record of land use and land cover changes in an anthropogenic watershed landscape, eastern China: Understanding past human-environment interactions. Science of the Total Environment, 650: 2906-2918.
doi: 10.1016/j.scitotenv.2018.10.058
|
|
|
| [16] |
Golabi M, Naseri A A. 2015. Assessment Aquacrop model to predict the sugarcane yield and soil salinity profiles under salinity stress. Iranian Journal of Soil and Water Research, 4(46): 685-694.
|
|
|
| [17] |
Gorgin Paveh F, Ramezani Etedali R, Kakvand P. 2020. Estimation of Wheat Water Footprint Based on CRU and AgMERRA Gridded Datasets. [2022-06-23]. https://osau.edu.ua/en/iv-mizhnarodnyj-yevrazijskyj-kongres-z-silskogo-gospodarstva-ta-pryrodnychyh-nauk/.
|
|
|
| [18] |
Harris I, Jones P D, Osborn T J, et al. 2014. Updated high-resolution grids of monthly climatic observations-the CRU TS3.10 Dataset. International Journal of Climatology, 34(3): 623-642.
doi: 10.1002/joc.3711
|
|
|
| [19] |
Harris I, Osborn T J, Jones P, et al. 2020. Version 4 of the CRU TS monthly high-resolution gridded multivariate climate dataset. Scientific Data, 7(1): 1-18.
doi: 10.1038/s41597-019-0340-y
|
|
|
| [20] |
Hellal F, Mansour H, Abdel-Hady M, et al. 2019. Assessment water productivity of barley varieties under water stress by AquaCrop model. AIMS Agriculture and Food, 4(3): 501-517.
doi: 10.3934/agrfood.2019.3.501
|
|
|
| [21] |
Javanmard S, Yatagai A, Nodzu M I, et al. 2010. Comparing high-resolution gridded precipitation data with satellite rainfall estimates of TRMM-3B42 over Iran. Advances in Geosciences, 25: 119-125.
doi: 10.5194/adgeo-25-119-2010
|
|
|
| [22] |
Johansson B, Chen D. 2003. The influence of wind and topography on precipitation distribution in Sweden: Statistical analysis and modelling. International Journal of Climatology: A Journal of the Royal Meteorological Society, 23(12): 1523-1535.
|
|
|
| [23] |
Kakvand P, Ramezani Etedali R, Gorgin Paveh F. 2020. Estimation of Maize Water Footprint Based on GPCC and AgCFSR Gridded Datasets. [2022-06-23]. https://osau.edu.ua/en/iv-mizhnarodnyj-yevrazijskyj-kongres-z-silskogo-gospodarstva-ta-pryrodnychyh-nauk/.
|
|
|
| [24] |
Katiraie-Boroujerdy P S, Nasrollahi N, Hsu K. et al. 2013. Evaluation of satellite-based precipitation estimation over Iran. Journal of Arid Environments, 97: 205-219.
doi: 10.1016/j.jaridenv.2013.05.013
|
|
|
| [25] |
Keating B A, Carberry P S, Hammer G L, et al. 2003. An overview of APSIM, a model designed for farming systems simulation. European Journal of Agronomy, 18(3-4): 267-288.
doi: 10.1016/S1161-0301(02)00108-9
|
|
|
| [26] |
Kreuzer D, Munz M, Schlüter S. 2020. Short-term temperature forecasts using a convolutional neural network-An application to different weather stations in Germany. Machine Learning with Applications, 2: 100007, doi: 10.1016/j.mlwa.2020.100007.
doi: 10.1016/j.mlwa.2020.100007
|
|
|
| [27] |
Lashkari A, Salehnia N, Asadi S, et al. 2018. Evaluation of different gridded rainfall datasets for rainfed wheat yield prediction in an arid environment. International Journal of Biometeorology, 62(8): 1543-1556.
doi: 10.1007/s00484-018-1555-x
pmid: 29740702
|
|
|
| [28] |
Li J, Tian L, Wang Y, et al. 2021. Optimal sampling strategy of water quality monitoring at high dynamic lakes: A remote sensing and spatial simulated annealing integrated approach. Science of the Total Environment, 777: 146113, doi: 10.1016/j.scitotenv.2021.146113.
doi: 10.1016/j.scitotenv.2021.146113
|
|
|
| [29] |
Massah A R, Morid S. 2005. Effects of climate change on Zayandeh Rud river flows. Journal of Science and Technology of Agriculture and Natural Resources, 4: 17-27.
|
|
|
| [30] |
Mitchell T D, Carter T R, Jones P D, et al. 2004. A comprehensive set of high-resolution grids of monthly climate for Europe and the globe: the observed record (1901-2000) and 16 scenarios (2001-2100). Geography, 55: 25, doi: 10.1002/joc.1181.
doi: 10.1002/joc.1181
|
|
|
| [31] |
Mitchell T D, Jones P D. 2005. An improved method of constructing a database of monthly climate observations and associated high-resolution grids. International Journal of Climatology, 25(6): 693-712.
doi: 10.1002/joc.1181
|
|
|
| [32] |
New M, Hulme M, Jones P. 1999. Representing twentieth-century space-time climate variability. Part I: Development of a 1961-90 mean monthly terrestrial climatology. Journal of Climate, 12(3): 829-856.
doi: 10.1175/1520-0442(1999)012<0829:RTCSTC>2.0.CO;2
|
|
|
| [33] |
New M, Hulme M, Jones P. 2000. Representing twentieth-century space-time climate variability. Part II: Development of 1901-96 monthly grids of terrestrial surface climate. Journal of Climate, 13(13): 2217-2238.
|
|
|
| [34] |
New M, Todd M, Hulme M, et al. 2001. Precipitation measurements and trends in the twentieth century. International Journal of Climatology, 21(15): 1889-1922.
doi: 10.1002/joc.680
|
|
|
| [35] |
Olivera Rodriguez P, Holzman M E, Degano M F, et al. 2021. Spatial variability of the green water footprint using a medium-resolution remote sensing technique: The case of soybean production in the Southeast Argentine Pampas. Science of the Total Environment, 763: 142963, doi: 10.1016/j.scitotenv.2020.142963.
doi: 10.1016/j.scitotenv.2020.142963
|
|
|
| [36] |
Ollivier C, Olioso A, Carrière S D, et al. 2021. An evapotranspiration model driven by remote sensing data for assessing groundwater resource in karst watershed. Science of the Total Environment, 781: 146706, doi: 10.1016/j.scitotenv.2021. 146706.
doi: 10.1016/j.scitotenv.2021. 146706
|
|
|
| [37] |
Ordikhani H, Parashkoohi M G, Zamani D M, et al. 2021. Energy-environmental life cycle assessment and cumulative exergy demand analysis for horticultural crops (Case study: Qazvin province). Energy Reports, 7: 2899-2915.
doi: 10.1016/j.egyr.2021.05.022
|
|
|
| [38] |
Queyrel W, Habets F, Blanchoud H, et al. 2016. Pesticide fate modeling in soils with the crop model STICS: Feasibility for assessment of agricultural practices. Science of the Total Environment, 542: 787-802.
doi: 10.1016/j.scitotenv.2015.10.066
|
|
|
| [39] |
Ramezani Etedali H, Ahmadi M. 2021. Evaluation of various meteorological datasets in estimation yield and actual evapotranspiration of wheat and maize (case study: Qazvin plain). Agricultural Water Management, 256: 107080, doi: 10.1016/j.agwat.2021.107080.
doi: 10.1016/j.agwat.2021.107080
|
|
|
| [40] |
Ramezani Etedali H, Gorgin F, Kakvand P. 2022. Study of the performance of two meteorological datasets in estimating the maize water footprint, a case study: Qazvin Plain. Iranian Journal of Irrigation and Drainage, 15(6): 1394-1403.
|
|
|
| [41] |
Reichle R H, Koster R D, De Lannoy G J M, et al. 2011. Assessment and enhancement of MERRA land surface hydrology estimates. Journal of Climate, 24(24): 6322-6338.
doi: 10.1175/JCLI-D-10-05033.1
|
|
|
| [42] |
Rodriguez J, Ustin S, Sandoval-Solis S, et al. 2015. Food, water, and fault lines: Remote sensing opportunities for earthquake-response management of agricultural water. Science of the Total Environment, 565: 1020-1027.
doi: 10.1016/j.scitotenv.2016.05.146
|
|
|
| [43] |
Ruane A C, Goldberg R, Chryssanthacopoulos J. 2015. Climate forcing datasets for agricultural modeling: Merged products for gap-filling and historical climate series estimation. Agricultural and Forest Meteorology, 200: 233-248.
doi: 10.1016/j.agrformet.2014.09.016
|
|
|
| [44] |
Saeidi R, Ramezani Etedali H, Sotoodehnia A, et al. 2021. Evaluation of AquaCrop model for estimating of changes process of soil moisture, evapotranspiration and yield of maize under salinity and fertility stresses. Environmental Stresses in Crop Sciences, 14(1): 195-210.
|
|
|
| [45] |
Salehnia N, Zare H, Kolsoumi S, et al. 2018. Predictive value of Keetch-Byram Drought Index for cereal yields in a semi-arid environment. Theoretical and Applied Climatology, 134(3): 1005-1014.
doi: 10.1007/s00704-017-2315-2
|
|
|
| [46] |
Schneider U, Becker A, Finger P, et al. 2014. GPCC's new land surface precipitation climatology based on quality-controlled in situ data and its role in quantifying the global water cycle. Theoretical and Applied Climatology, 115(1): 15-40.
doi: 10.1007/s00704-013-0860-x
|
|
|
| [47] |
Shi H, Li T, Wei J. 2017. Evaluation of the gridded CRU TS precipitation dataset with the point raingauge records over the Three-River Headwaters Region. Journal of Hydrology, 548: 322-332.
doi: 10.1016/j.jhydrol.2017.03.017
|
|
|
| [48] |
Stöckle C O, Donatelli M, Nelson R. 2003. CropSyst, a cropping systems simulation model. European Journal of Agronomy, 18(3-4): 289-307.
doi: 10.1016/S1161-0301(02)00109-0
|
|
|
| [49] |
Strangeways I. 2006. Precipitation:Theory, Measurement and Distribution. Cambridge: Cambridge University Press.
|
|
|
| [50] |
Valéry A, Andréassian V, Perrin C. 2010. Regionalization of precipitation and air temperature over high-altitude catchments-learning from outliers. Hydrological Sciences Journal-Journal des Sciences Hydrologiques, 55(6): 928-940.
doi: 10.1080/02626667.2010.504676
|
|
|
| [51] |
Vorosmarty C J, Sahagian D. 2000. Anthropogenic disturbance of the terrestrial water cycle. BioScience, 50(9): 753-765.
doi: 10.1641/0006-3568(2000)050[0753:ADOTTW]2.0.CO;2
|
|
|
| [52] |
White J L, Knapp A K, Kelly E F. 2008. Increasing precipitation event size increases aboveground net primary productivity in a semi-arid grassland. Oecologia, 158(1): 129-140.
doi: 10.1007/s00442-008-1116-9
|
|
|
| [53] |
WMO, ICSU. 1990. The Global Precipitation Climatology Project-Implementation and data management plan. [2022-08-17]. https://library.wmo.int/index.php?lvl=notice_display&id=11757#.Y4ZbLnZBzIU.
|
|
|
| [54] |
Worqlul A W, Collick A S, Tilahun S A, et al. 2015. Comparing TRMM 3B42, CFSR and ground-based rainfall estimates as input for hydrological models, in data scarce regions: the Upper Blue Nile Basin, Ethiopia. Hydrology and Earth System Sciences Discussions, 12(2): 2081-2112.
|
|
|
| [55] |
Yang H S, Dobermann A, Lindquist J L, et al. 2004. Hybrid-maize-A maize simulation model that combines two crop modeling approaches. Field Crops Research, 87(2-3): 131-154.
doi: 10.1016/j.fcr.2003.10.003
|
|
|
| [56] |
Yao T, Xue Y, Chen D, et al. 2019. Recent third pole's rapid warming accompanies cryospheric melt and water cycle intensification and interactions between monsoon and environment: Multidisciplinary approach with observations, modeling, and analysis. Bulletin of the American Meteorological Society, 100(3): 423-444.
doi: 10.1175/BAMS-D-17-0057.1
|
|
|
| [57] |
Zhu X, Xu K, Liu Y, et al. 2021. Assessing the vulnerability and risk of maize to drought in China based on the AquaCrop model. Agricultural Systems, 189: 103040, doi: 10.1016/j.agsy.2020.103040.
doi: 10.1016/j.agsy.2020.103040
|
|
|
|
Viewed |
|
|
|
Full text
|
|
|
|
|
Abstract
|
|
|
|
|
Cited |
|
|
|
|
| |
Shared |
|
|
|
|
| |
Discussed |
|
|
|
|