| Research article |
|


|
|
|
| Projections of temperature extremes based on preferred CMIP5 models: a case study in the Kaidu-Kongqi River basin in Northwest China |
CHEN Li1, XU Changchun1,2,*( ), LI Xiaofei1 ), LI Xiaofei1 |
1MOE Key Laboratory of Oasis Ecology, College of Resource and Environment Sciences, Xinjiang University, Urumqi 830000, China
2School of Civil Engineering and Environmental Science, University of Oklahoma, Norman OK 73072, USA |
|
|
|
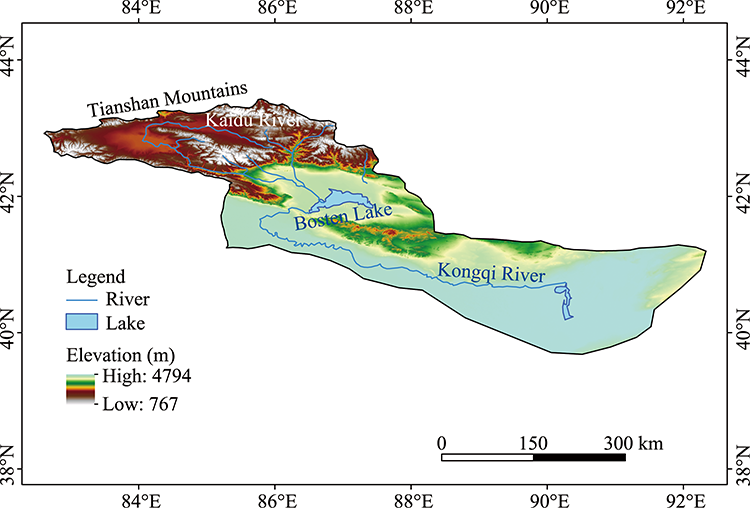
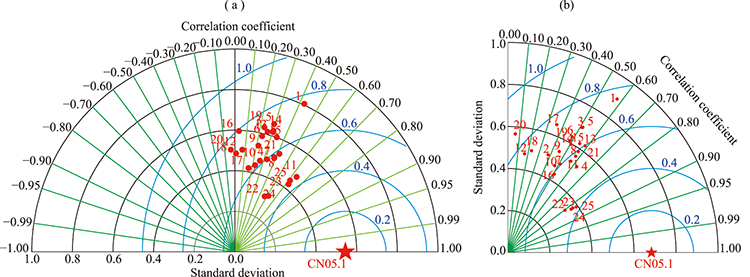
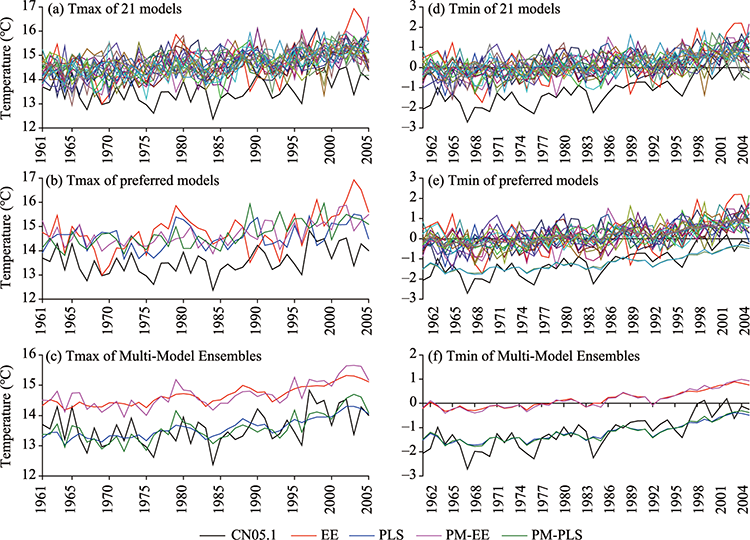
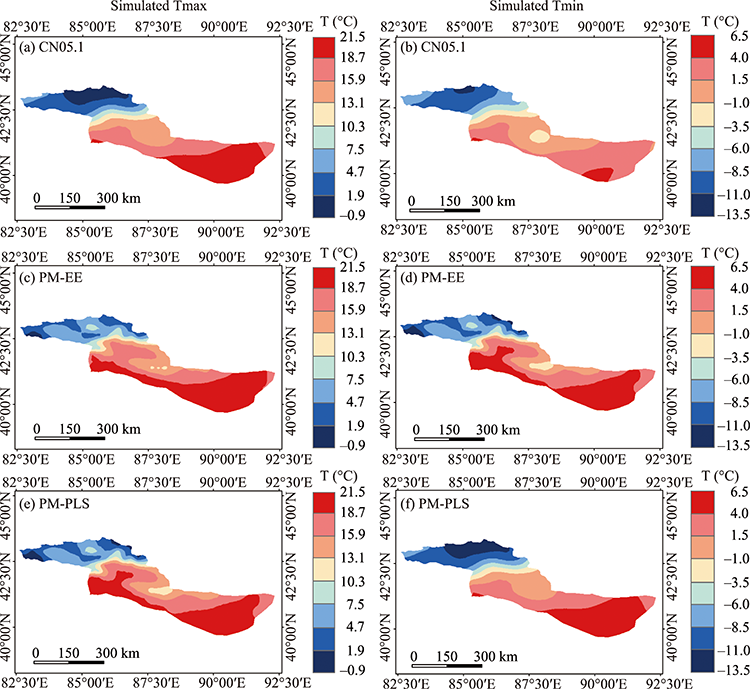
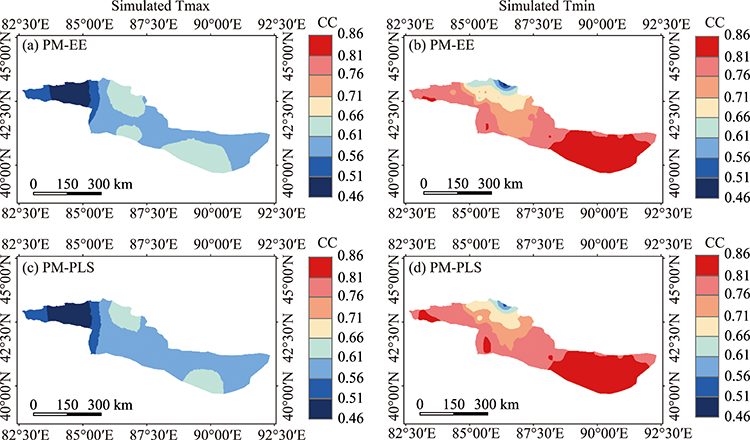
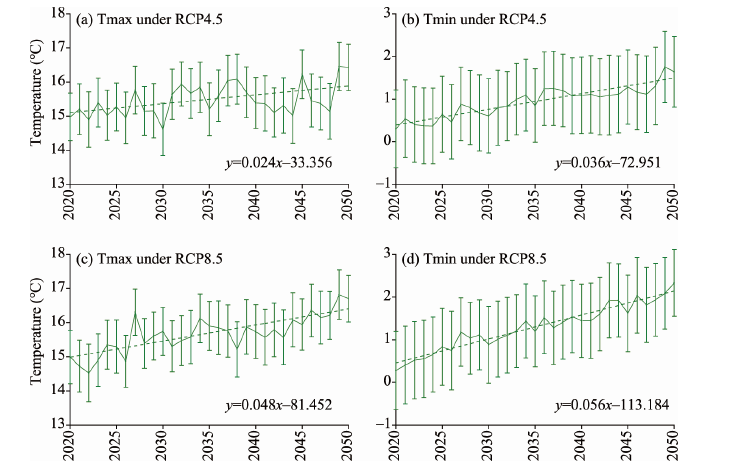
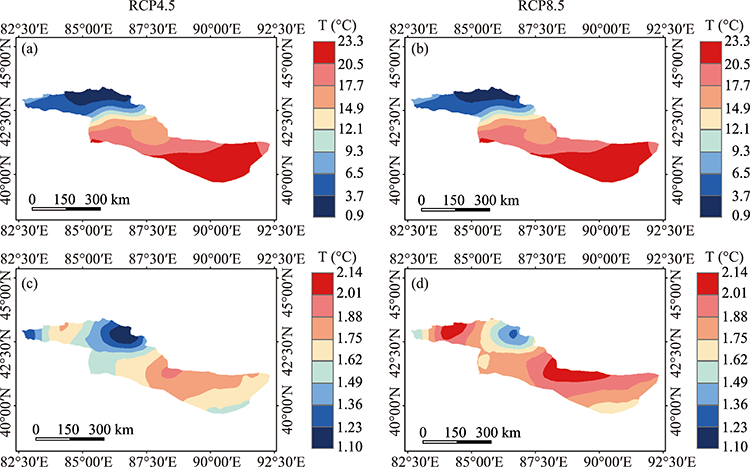
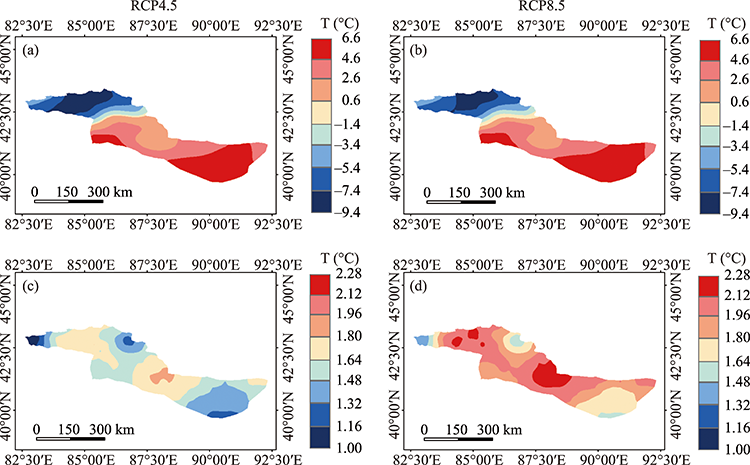
Abstract The extreme temperature has more outstanding impact on ecology and water resources in arid regions than the average temperature. Using the downscaled daily temperature data from 21 Coupled Model Inter-comparison Project (CMIP) models of NASA Earth Exchange Global Daily Downscaled Projections (NEX-GDDP) and the observation data, this paper analyzed the changes in temporal and spatiotemporal variation of temperature extremes, i.e., the maximum temperature (Tmax) and minimum temperature (Tmin), in the Kaidu-Kongqi River basin in Northwest China over the period 2020-2050 based on the evaluation of preferred Multi-Model Ensemble (MME). Results showed that the Partial Least Square ensemble mean participated by Preferred Models (PM-PLS) was better representing the temporal change and spatial distribution of temperature extremes during 1961-2005 and was chosen to project the future change. In 2020-2050, the increasing rate of Tmax (Tmin) under RCP (Representative Concentration Pathway) 8.5 will be 2.0 (1.6) times that under RCP4.5, and that of Tmin will be larger than that of Tmax under each corresponding RCP. Tmin will keep contributing more to global warming than Tmax. The spatial distribution characteristics of Tmax and Tmin under the two RCPs will overall the same; but compared to the baseline period (1986-2005), the increments of Tmax and Tmin in plain area will be larger than those in mountainous area. With the emission concentration increased, however, the response of Tmax in mountainous area will be more sensitive than that in plain area, and that of Tmin will be equivalently sensitive in mountainous area and plain area. The impacts induced by Tmin will be universal and far-reaching. Results of spatiotemporal variation of temperature extremes indicate that large increases in the magnitude of warming in the basin may occur in the future. The projections can provide the scientific basis for water and land plan management and disaster prevention and mitigation in the inland river basin.
|
|
Received: 22 September 2020
Published: 10 June 2021
|
|
Corresponding Authors:
|
About author: XU Changchun (E-mail: xcc0110@163.com)
|
|
|
| [1] |
Almazroui M, Saeed F, Islam M N, et al. 2016. Assessing the robustness and uncertainties of projected changes in temperature and precipitation in AR4 global climate models over the Arabian Peninsula. Atmospheric Research, 182:163-175.
doi: 10.1016/j.atmosres.2016.07.025
|
|
|
| [2] |
Almazroui M, Nazrul I M, Saeed S, et al. 2017a. Assessment of uncertainties in projected temperature and precipitation over the Arabian Peninsula using three categories of Cmip5 multimodel ensembles. Earth Systems and Environment, 23(2017), doi: 10.1007/s41748-017-0027-5.
doi: 10.1007/s41748-017-0027-5
|
|
|
| [3] |
Almazroui M, Tayeb O, Mashat A S, et al. 2017b. Saudi-KAU coupled global climate model: description and performance. Earth Systems and Environment, 7(2017), doi: 10.1007/s41748-017-0009-7.
doi: 10.1007/s41748-017-0009-7
|
|
|
| [4] |
Barriopedro D, Fischer E M, Luterbacher J, et al. 2011. The hot summer of 2010: redrawing the temperature record map of Europe. Science, 332(6026):220-224.
doi: 10.1126/science.1201224
pmid: 21415316
|
|
|
| [5] |
Chen H P, Sun J Q. 2013. Projected change in East Asian summer monsoon precipitation under RCP scenario. Meteorology and Atmospheric Physics, 121(1-2):55-77.
doi: 10.1007/s00703-013-0257-5
|
|
|
| [6] |
Chen S F, Wu R G, Song L Y, et al. 2019. Present-day status and future projection of spring Eurasian surface air temperature in CMIP5 model simulations. Climate Dynamics, 52:5431-5449.
doi: 10.1007/s00382-018-4463-1
|
|
|
| [7] |
Chen W L, Jiang Z H, Huang Q. 2012. Projection and simulation of climate extremes over the Yangtze and Huaihe River Basins based on a Statistical Downscaling Model. Transactions of Atmospheric Sciences, 35(5):578-590. (in Chinese)
|
|
|
| [8] |
Chen Y N, Li Z, Fang G H, et al. 2017. Impact of climate change on water resources in the Tianshan Mountians, Central Asia. Acta Geographica Sinica, 72(1):18-26. (in Chinese)
|
|
|
| [9] |
Guan Y H, Zhang X C, Zheng F L, et al. 2015. Trends and variability of daily temperature extremes during 1960-2012 in the Yangtze River Basin, China. Global and Planetary Change, 124:79-94.
doi: 10.1016/j.gloplacha.2014.11.008
|
|
|
| [10] |
He D D, Xu C C, Liu J C. 2018. Future climate scenarios projection in the Kaidu River basin based on ASD statistical down-scaling model. Pearl River, 39(9):25-32. (in Chinese)
|
|
|
| [11] |
Hu Q, Jiang D B, Fan G Z. 2014. Evaluation of CMIP5 models over the Qinghai-Tibetan Plateau. Chinese Journal of Atmospheric Sciences, 38(5):924-938. (in Chinese)
|
|
|
| [12] |
Huang J P, Yu H P, Guan X D, et al. 2016. Accelerated dryland expansion under climate change. Nature Climate Change, 6(2):166-171.
doi: 10.1038/nclimate2837
|
|
|
| [13] |
IPCC (Intergovernmental Panel on Climate Change). 2014. Climate Change 2014: impacts, adaptation, and vulnerability. Part A. Global and Sectoral Aspects. Contribution of working groups I, II and III to the Fifth Assessment Report of the Intergovernmental Panel on Climate Change. Cambridge: Cambridge University Press.
|
|
|
| [14] |
Jiang D B, Tian Z P, Lang X M. 2016. Reliability of climate models for China through the IPCC Third to Fifth Assessment Reports. International Journal of Climatology, 36(3):1114-1133.
doi: 10.1002/joc.4406
|
|
|
| [15] |
Jiang S, Jiang Z H, Li W, et al. 2017. Evaluation of the extreme temperature and its trend in China simulated by CMIP5 models. Climate Change Research, 13(1):11-24. (in Chinese)
|
|
|
| [16] |
Jiang Y M, Wu H M. 2013. Simulation Capabilities of 20 CMIP5 Models for Annual Mean Air Temperatures in Central Asia. Progressus Inquisitiones DE Mutatione Climatis, 9(2):110-116. (in Chinese)
|
|
|
| [17] |
Keellings D, Waylen P. 2012. The stochastic properties of high daily maximum temperatures applying crossing theory to modeling high-temperature event variables. Theoretical and Applied Climatology, 108:579-590.
doi: 10.1007/s00704-011-0553-2
|
|
|
| [18] |
Li H L, Wang H J, Yin Y Z. 2012. Interdecadal variation of the West African summer monsoon during 1979-2010 and associated variability. Climate Dynamics, 39(12):2883-2894.
doi: 10.1007/s00382-012-1426-9
|
|
|
| [19] |
Li X F, Xu C C, Li L, et al. 2019a. Projection of future climate change in the Kaidu-Kongqi River Basin in the 21st Century. Arid Zone Research, 36(3):556-566. (in Chinese)
|
|
|
| [20] |
Li X F, Xu C C, Li L, et al. 2019b. Evaluation of air temperature of the typical river basin in desert area of Northwest China by the CMIP5 models: A case of the Kaidu-Kongqi River Basin. Resources Science, 41(6):1141-1153. (in Chinese)
|
|
|
| [21] |
Li X M, Simonovic S P, Li L H, et al. 2020. Performance and uncertainty analysis of a short-term climate reconstruction based on multi-source data in the Tianshan Mountains region, China. Journal of Arid Land, 12(3):374-396.
doi: 10.1007/s40333-020-0065-y
|
|
|
| [22] |
Qin D H. 2014. Climate change science and sustainable development. Progress in Geography, 33(7):874-883. (in Chinese)
|
|
|
| [23] |
Raghavan S V, Hur J, Liong S. 2018. Evaluations of NASA NEX-GDDP data over Southeast Asia: present and future climates. Climatic Change, 148:503-518.
doi: 10.1007/s10584-018-2213-3
|
|
|
| [24] |
Raisanen J, Ylhaisi J S. 2011. How much should climate model output be smoothed in space? Journal of Climate, 24(3):867-880.
doi: 10.1175/2010JCLI3872.1
|
|
|
| [25] |
Rosenzweig C, Iglesias A, Yang X B, et al. 2001. Climate change and extreme weather events; implications for food production, plant diseases, and pests. Global Change and Human Health, 2:90-104.
doi: 10.1023/A:1015086831467
|
|
|
| [26] |
Shang S S, Lian L Z, Ma T, et al. 2018. Spatiotemporal variation of temperature and precipitation in Northwest China in recent 54 years. Arid Zone Research, 35(1):68-76. (in Chinese)
|
|
|
| [27] |
Shi Y F, Shen Y P, Hu R J. 2002. Preliminary study on signal, impact and foreground of climatic shift from warm-dry to warm- humid in Northwest China. Journal of Glaciology and Geocryology, 24(3):219-226. (in Chinese)
|
|
|
| [28] |
Su B D, Huang J L, Gemmer M, et al. 2016. Statistical downscaling of CMIP5 multi-model ensemble for projected changes of climate in the Indus River Basin. Atmospheric Research, 178-179:138-149.
doi: 10.1016/j.atmosres.2016.03.023
|
|
|
| [29] |
Sun Q H, Miao C Y, Duan Q Y. 2016. Extreme climate events and agricultural climate indices in China: CMIP5 model evaluation and projections. International Journal of Climatology, 36(1):43-61.
doi: 10.1002/joc.4328
|
|
|
| [30] |
Taylor K E. 2001. Summarizing multiple aspects of model performance in a single diagram. Geophysical Research Letters, 106(D7):7183-7192
|
|
|
| [31] |
Wang L, Guo S L, Hong X J, et al. 2017. Projected hydrologic regime changes in the Poyang Lake Basin due to climate change. Frontiers of Earth Science, 11:95-113.
doi: 10.1007/s11707-016-0580-5
|
|
|
| [32] |
Wang M H, Li H L, Sun X T. 2018. Quantitative evaluation on the interannual and interdecadal precipitation variability simulated by six CMIP5 models of China. Meteorological Monthly, 44(5):634-644. (in Chinese)
|
|
|
| [33] |
Wu D, Yan D H. 2013. Projections of future climate change over Huaihe River basin by multi-model ensembles under SRES scenarios. Journal of Lake Sciences, 25(4):565-575. (in Chinese)
doi: 10.18307/2013.0415
|
|
|
| [34] |
Wu J, Gao X J. 2013. A gridded daily observation dataset over China region and comparison with the other datasets. Chinese Journal of Geophysics, 56(4):1102-1111. (in Chinese)
|
|
|
| [35] |
Xu C H, Shen X Y, Xu Y. 2007. An analysis of climate change in East Asia by using the IPCC AR4 simulations. Advances in Climate Change Research, 3(5):287-292. (in Chinese)
|
|
|
| [36] |
Xu C H, Xu Y. 2012a. The projection of temperature and precipitation over China under RCP scenarios using a CMIP5 multi-model ensemble. Atmospheric and Oceanic Science Letters, 5(6):527-533.
doi: 10.1080/16742834.2012.11447042
|
|
|
| [37] |
Xu Y, Gao X J, Shen Y, et al. 2009. A daily temperature dataset over China and its application in validating a RCM simulation. Advances in Atmospheric Sciences, 26(4):763-772.
doi: 10.1007/s00376-009-9029-z
|
|
|
| [38] |
Xu Y, Xu C H. 2012b. Preliminary assessment of simulations of climate changes over China by CMIP5 multi-models. Atmospheric and Oceanic Science Letters, 5(6):47-52.
|
|
|
| [39] |
Yang X L, Zheng W F, Lin C Q. 2017. Prediction of drought in the Yellow River Basin based on statistical downscaling study and SPI. Journal of Hohai University (Natural Sciences), 45(5):377-383. (in Chinese)
|
|
|
| [40] |
Yao P Z. 1995. The climate features of summer low temperature cold damage in northeast China during recent 40 years. Journal of Catastrophology, 10(1):51-56. (in Chinese)
|
|
|
| [41] |
Yao Y, Luo Y, Huang J B. 2012. Evaluation and projection of temperature extremes over China based on 8 modeling data from CMIP5. Advances in Climate Change Research, 3(4):179-185.
doi: 10.3724/SP.J.1248.2012.00179
|
|
|
| [42] |
Ye L M, Yang G X, van Ranst E, et al. 2013. Time-series modeling and prediction of global monthly absolute temperature for environmental decision making. Advance in Atmospheric Sciences, 30(2):382-396.
|
|
|
| [43] |
Yu E T, Sun J Q. 2019. Extreme temperature projection over northwestern China based on multiple regional climate models. Transactions of Atmospheric Sciences, 42(1):46-57. (in Chinese)
|
|
|
| [44] |
Yu Y, Pi Y Y, Yu X, et al. 2019. Climate change, water resources and sustainable development in the arid and semi-arid lands of Central Asia in the past 30 years. Journal of Arid Land, 11(1):1-14.
doi: 10.1007/s40333-018-0073-3
|
|
|
| [45] |
Zhang X Z, Li X X, Xu X C, et al. 2017. Ensemble projection of climate change scenarios of China in the 21st century based on the preferred climate models. Acta Geographica Sinica, 72(9):1555-1568. (in Chinese)
|
|
|
| [46] |
Zhao T B, Chen L, Ma Z G. 2014. Simulation of historical and projected climate change in arid and semiarid areas by CMIP5 models. Chinese Science Bulletin, 59(4):1148-1163.
|
|
|
| [47] |
Zhi X F, Zhao H, Zhu S P, et al. 2016. Superensemble hindcast of surface air temperature using CMIP5 multimodel data. Transactions of Atmospheric Science, 39(1):64-71. (in Chinese)
|
|
|
|
Viewed |
|
|
|
Full text
|
|
|
|
|
Abstract
|
|
|
|
|
Cited |
|
|
|
|
| |
Shared |
|
|
|
|
| |
Discussed |
|
|
|
|