| Research article |
|

|
|
|
| Future meteorological drought conditions in southwestern Iran based on the NEX-GDDP climate dataset |
Sakine KOOHI, Hadi RAMEZANI ETEDALI( ) ) |
| Department of Water Engineering, Faculty of Agriculture and Natural Resources, Imam Khomeini International University, Qazvin 96818, Iran |
|
|
|
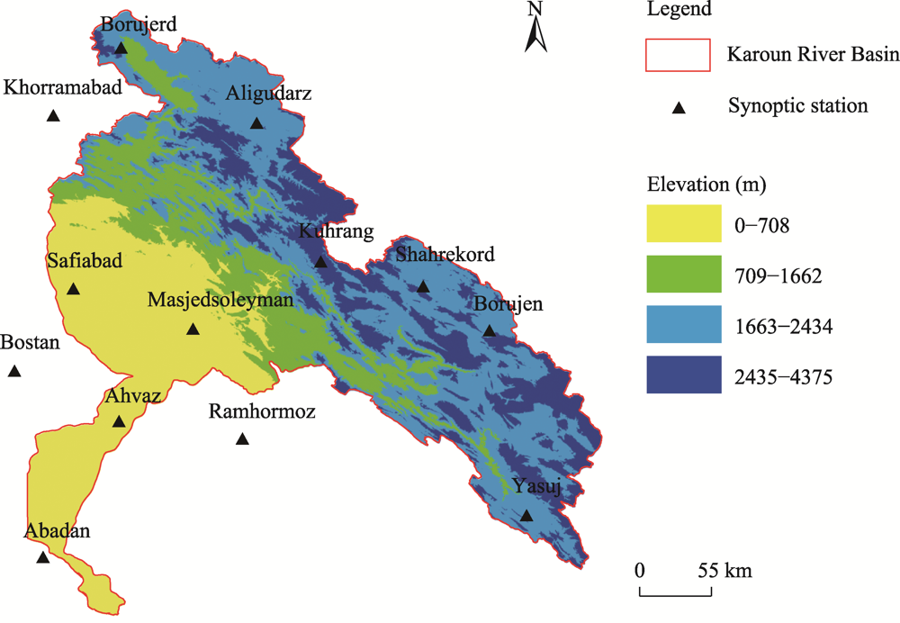
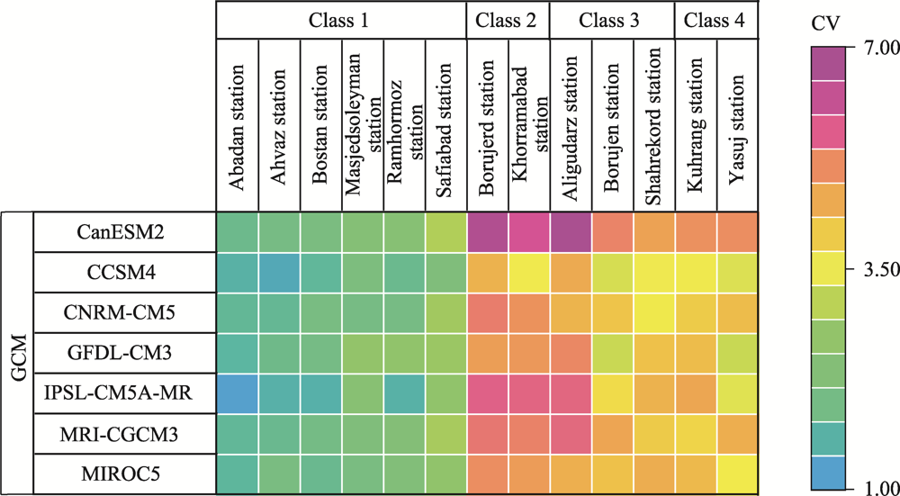
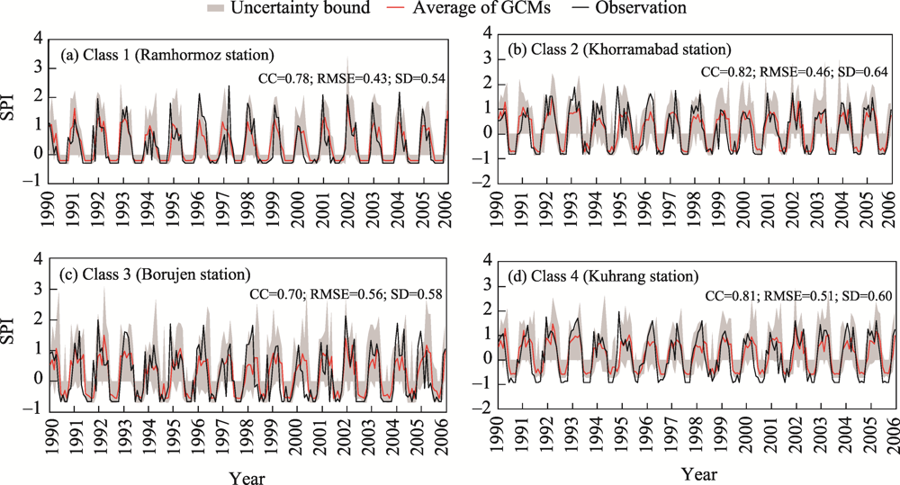
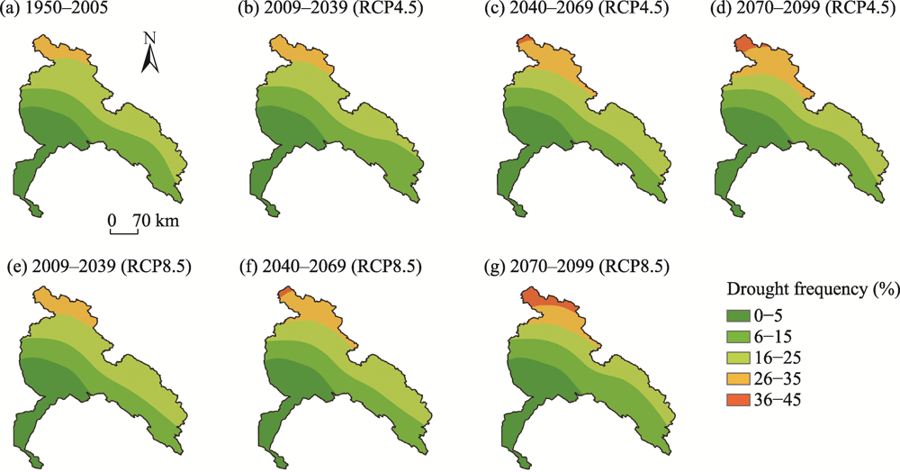
Abstract Investigation of the climate change effects on drought is required to develop management strategies for minimizing adverse social and economic impacts. Therefore, studying the future meteorological drought conditions at a local scale is vital. In this study, we assessed the efficiency of seven downscaled Global Climate Models (GCMs) provided by the NASA Earth Exchange Global Daily Downscaled Projections (NEX-GDDP), and investigated the impacts of climate change on future meteorological drought using Standard Precipitation Index (SPI) in the Karoun River Basin (KRB) of southwestern Iran under two Representative Concentration Pathway (RCP) emission scenarios, i.e., RCP4.5 and RCP8.5. The results demonstrated that SPI estimated based on the Meteorological Research Institute Coupled Global Climate Model version 3 (MRI-CGCM3) is consistent with the one estimated by synoptic stations during the historical period (1990-2005). The root mean square error (RMSE) value is less than 0.75 in 77% of the synoptic stations. GCMs have high uncertainty in most synoptic stations except those located in the plain. Using the average of a few GCMs to improve performance and reduce uncertainty is suggested by the results. The results revealed that with the areas affected by wetness decreasing in the KRB, drought frequency in the North KRB is likely to increase at the end of the 21st century under RCP4.5 and RCP8.5 scenarios. At the seasonal scale, the decreasing trend for SPI in spring, summer, and winter shows a drought tendency in this region. The climate-induced drought hazard can have vast consequences, especially in agriculture and rural livelihoods. Accordingly, an increasing trend in drought during the growing seasons under RCP scenarios is vital for water managers and farmers to adopt strategies to reduce the damages. The results of this study are of great value for formulating sustainable water resources management plans affected by climate change.
|
|
Received: 04 March 2022
Published: 30 April 2023
|
|
Corresponding Authors:
*Hadi RAMEZANI ETEDALI (E-mail: ramezani@eng.ikiu.ac.ir)
|
|
|
| [1] |
Ababaei B, Ramezani Etedali H. 2019. Investigating climate change over 1957-2016 in an arid environment with three drought indexes. Theoretical and Applied Climatology, 137: 2977-2992.
doi: 10.1007/s00704-019-02793-0
|
|
|
| [2] |
Adamson P, Bird J. 2010. The Mekong: A drought-prone tropical environment? International Journal of Water Resources Development, 26(4): 579-594.
doi: 10.1080/07900627.2010.519632
|
|
|
| [3] |
Aziz A, Umar M, Mansha M, et al. 2018. Assessment of drought conditions using HJ-1A/1B data: a case study of Potohar region, Pakistan. Geomatics, Natural Hazards and Risk, 9(1): 1019-1036.
doi: 10.1080/19475705.2018.1499558
|
|
|
| [4] |
Bhalme H N, Mooley D A. 1980. Large-scale droughts/floods and monsoon circulation. Monthly Weather Review, 108(8): 1197-1211.
doi: 10.1175/1520-0493(1980)108<1197:LSDAMC>2.0.CO;2
|
|
|
| [5] |
Bower E, Meneghetti L, O'Connor K. 2015. Global Estimates 2015: People Displaced by Disasters. [2022-04-24]. https://www.internal-displacement.org/publications/global-estimates-2015-people-displaced-by-disasters.
|
|
|
| [6] |
Brown C E. 1998. Coefficient of variation. In: Brown C E. Applied Multivariate Statistics in Geohydrology and Related Sciences. Heidelberg: Springer.
|
|
|
| [7] |
Cao F Q, Gao T. 2019. Effect of climate change on the centennial drought over China using high-resolution NASA-NEX downscaled climate ensemble data. Theoretical and Applied Climatology, 138(1-2): 1189-1202.
doi: 10.1007/s00704-019-02895-9
|
|
|
| [8] |
Chikabvumbwa S R, Salehnia N, Manzanas R, et al. 2022. Assessing the effect of spatial-temporal droughts on dominant crop yield changes in Central Malawi. Environmental Monitoring and Assessment, 194: 63, doi: 10.1007/s10661-021-09709-4.
doi: 10.1007/s10661-021-09709-4
pmid: 34993655
|
|
|
| [9] |
Cook B I, Ault T R, Smerdon J E. 2015. Unprecedented 21st century drought risk in the American Southwest and Central plains. Science Advances, 1(1), doi: 10.1126/sciadv.1400082.
doi: 10.1126/sciadv.1400082
|
|
|
| [10] |
Dai A. 2013. Increasing drought under global warming in observations and models. Nature Climate Change, 3(1): 52-58.
doi: 10.1038/nclimate1633
|
|
|
| [11] |
Das S, Das J, Umamahesh N V. 2021. Identification of future meteorological drought hotspots over Indian region: A study based on NEX-GDDP data. International Journal of Climatology, 41(12): 5644-5662.
doi: 10.1002/joc.v41.12
|
|
|
| [12] |
Dehghan S, Salehnia N, Sayari N, et al. 2020. Prediction of meteorological drought in arid and semi-arid regions using PDSI and SDSM: A case study in Fars Province, Iran. Journal of Arid Land, 12(2): 318-330.
|
|
|
| [13] |
Edwards D C. 1997. Characteristics of 20th Century Drought in the United States at Multiple Time Scales. Colorado: Colorado State University.
|
|
|
| [14] |
Efron B. 1979. Bootstrap methods: another look at the Jackknife. The Annals of Statistics, 7(1): 1-26.
|
|
|
| [15] |
Efron B, Gong G. 1983. A leisurely look at the bootstrap, the Jackknife, and cross-validation. The American Statistician, 37(1): 36-48.
|
|
|
| [16] |
Efron B, Tibshirani R J. 1993. An Introduction to the Bootstrap. New York: Chapman and Hall Press.
|
|
|
| [17] |
Fattahi E, Habibi M, Kouhi M. 2015. Climate change impact on drought intensity and duration in West of Iran. Journal of Earth Science & Climatic Change, 6(10), doi: 10.4172/2157-7617.1000319.
doi: 10.4172/2157-7617.1000319
|
|
|
| [18] |
Feng S, Trnka M, Hayes M, et al. 2017. Why do different drought indices show distinct future drought risk outcomes in the U.S. great plains? Journal of Climate, 30(1): 265-278.
doi: 10.1175/JCLI-D-15-0590.1
|
|
|
| [19] |
Fooladi M, Golmohammadi M H, Safavi H R, et al. 2021. Fusion-based framework for meteorological drought modeling using remotely sensed datasets under climate change scenarios: Resilience, vulnerability, and frequency analysis. Journal of Environmental Management, 297: 113283, doi: 10.1016/j.jenvman.2021.113283.
doi: 10.1016/j.jenvman.2021.113283
|
|
|
| [20] |
Gaitán E, Monjo R, Pórtoles J, et al. 2020. Impact of climate change on drought in Aragon (NE Spain). Science of the Total Environment, 740: 140094, doi: 10.1016/j.scitotenv.2020.140094.
doi: 10.1016/j.scitotenv.2020.140094
|
|
|
| [21] |
Gibbs W J, Maher J V. 1967. Rainfall Deciles as Drought Indicates. Melbourne: Bureau of Meteorology Press.
|
|
|
| [22] |
Haile G G, Tang Q, Sun S, et al. 2019. Droughts in East Africa: causes, impacts and resilience. Earth-Science Reviews, 193: 146-161.
doi: 10.1016/j.earscirev.2019.04.015
|
|
|
| [23] |
Haile G G, Tang Q, Hosseini Moghari S M, et al. 2020. Projected impacts of climate change on drought patterns over East Africa. Earth's Future, 8(7), doi: 10.1029/2020EF001502.
doi: 10.1029/2020EF001502
|
|
|
| [24] |
Hayes M, Svoboda M, Wall N, et al. 2011. The lincoln declaration on drought indices: universal meteorological drought index recommended. Bulletin of the American Meteorological Society, 92(4): 485-488.
doi: 10.1175/2010BAMS3103.1
|
|
|
| [25] |
Hyndman R J, Koehler A B. 2006. Another look at measures of forecast accuracy. International Journal of Forecasting, 22(4): 679-688.
doi: 10.1016/j.ijforecast.2006.03.001
|
|
|
| [26] |
Ionita M, Scholz P, Chelcea S. 2016. Assessment of droughts in Romania using the standardized precipitation index. Natural Hazards, 81: 1483-1498.
doi: 10.1007/s11069-015-2141-8
|
|
|
| [27] |
IPCC Intergovernmental Panel on Climate Change. 2013. Climate change 2013:the physical science basis. In:Contribution of Working Group I to the Fifth Assessment Report of the Intergovernmental Panel on Climate Change. Geneva, Switzerland.
|
|
|
| [28] |
Karamouz M, Nazif S, Falahi M. 2013. Hydrology and Hydroclimatology Principles and Applications (1st ed.). Florida: CRC Press.
|
|
|
| [29] |
Khan J U, Islam A K M S, Das M K, et al. 2020. Future changes in meteorological drought characteristics over Bangladesh projected by the CMIP 5 multi-model ensemble. Climatic Change, 162(2): 667-685.
doi: 10.1007/s10584-020-02832-0
|
|
|
| [30] |
Li Y S, Lu H, Yang K, et al. 2021. Meteorological and hydrological droughts in Mekong river basin and surrounding areas under climate change. Journal of Hydrology: Regional Studies, 36: 100873, doi: 10.1016/j.ejrh.2021.100873.
doi: 10.1016/j.ejrh.2021.100873
|
|
|
| [31] |
Madani K. 2014. Water management in Iran: what is causing the looming crisis? Journal of Environmental Studies and Sciences, 4(4): 315-328.
doi: 10.1007/s13412-014-0182-z
|
|
|
| [32] |
Maraun D. 2016. Bias correcting climate change simulations - a critical review. Current Climate Change Reports, 2: 211-220.
doi: 10.1007/s40641-016-0050-x
|
|
|
| [33] |
McKee T B, Doesken N J, Kleist J. 1993. The relationship of drought frequency and duration to time scales. In:8th Conference on Applied Climatology. Anaheim, USA.
|
|
|
| [34] |
Mirgol B, Nazari M, Ramezani Etedali H, et al. 2021. Past and future drought trends, duration, and frequency in the semi-arid Urmia lake basin under a changing climate. Meteorological Applications, 28(4): 1-19.
|
|
|
| [35] |
Modarresi Rad A, AghaKouchak A, Navari M, et al. 2021. Progress, challenges, and opportunities in remote sensing of drought. In: Wu H, Lettenmaier D P, Tang Q H, et al. Global Drought and Flood: Observation, Modeling, and Prediction. Global Drought and Flood: Observation, Modeling, and Prediction. Massachusetts: American Geophysical Union.
|
|
|
| [36] |
Nam W H, Hayes M J, Svoboda M D, et al. 2015. Drought hazard assessment in the context of climate change for South Korea. Agricultural Water Management, 160: 106-117.
doi: 10.1016/j.agwat.2015.06.029
|
|
|
| [37] |
Noorisameleh Z, Khaledi S, Shakiba A, et al. 2020. Comparative evaluation of impacts of climate change and droughts on river flow vulnerability in Iran. Water Science and Engineering, 13(4): 265-274.
doi: 10.1016/j.wse.2020.05.001
|
|
|
| [38] |
Osuch M, Romanowicz R J, Lawrence D, et al. 2016. Trends in projections of standardized precipitation indices in a future climate in Poland. Hydrology and Earth System Sciences, 20(5): 1947-1969.
doi: 10.5194/hess-20-1947-2016
|
|
|
| [39] |
Padiyedath Gopalan S, Kawamura A, Amaguchi H, et al. 2019. A bootstrap approach for the parameter uncertainty of an urban-specific rainfall-runoff model. Journal of Hydrology, 579, doi: 10.1016/j.jhydrol.2019.124195.
doi: 10.1016/j.jhydrol.2019.124195
|
|
|
| [40] |
Pearson K. 1894. On the dissection of asymmetrical frequency curves. Philosophical Transactions of the Royal Society A, 185: 71-100.
|
|
|
| [41] |
Pearson K. 1896. Mathematical contributions to the theory of evolution-on a form of spurious correlation which may arise when indices are used in the measurement of organs. Proceedings of the Royal Society of London, 60: 489-498.
|
|
|
| [42] |
Rahimi J, Ebrahimpour M, Khalili A. 2013. Spatial changes of extended De Martonne climatic zones affected by climate change in Iran. Theoretical and Applied Climatology, 112: 409-418.
doi: 10.1007/s00704-012-0741-8
|
|
|
| [43] |
Salehnia N, Hosseini F, Farid A, et al. 2019. Comparing the performance of dynamical and statistical downscaling on historical run precipitation data over a semi-arid region. Asia-Pacific Journal of Atmospheric Sciences, 55: 737-749.
doi: 10.1007/s13143-019-00112-1
|
|
|
| [44] |
Salehnia N, Salehnia N, Saradari Torshizi A, et al. 2020. Rainfed wheat (Triticum aestivum L.) yield prediction using economical, meteorological, and drought indicators through pooled panel data and statistical downscaling. Ecological Indicators, 111, doi: 10.1016/j.ecolind.2019.105991.
doi: 10.1016/j.ecolind.2019.105991
|
|
|
| [45] |
Schwalm C R, Anderegg W R L, Michalak A M, et al. 2017. Global patterns of drought recovery. Nature, 548: 202-205.
doi: 10.1038/nature23021
|
|
|
| [46] |
Sheffield J, Goteti G, Wood E F. 2006. Development of a 50-year high-resolution global dataset of meteorological forcings for land surface modeling. Journal of Climate, 19: 3088-3111.
doi: 10.1175/JCLI3790.1
|
|
|
| [47] |
Shelton M. 2018. Hydroclimatology Perspectives and Applications. Cambridge: Cambridge University Press.
|
|
|
| [48] |
Soltani M, Laux P, Kunstmann H, et al. 2016. Assessment of climate variations in temperature and precipitation extreme events over Iran. Theoretical and Applied Climatology, 126(3-4): 775-795.
doi: 10.1007/s00704-015-1609-5
|
|
|
| [49] |
Song Y H, Chung E S, Shiru M S. 2020. Uncertainty analysis of monthly precipitation in GCMs using multiple bias correction methods under different RCPs. Sustainability, 12(18), doi: 10.3390/su12187508.
doi: 10.3390/su12187508
|
|
|
| [50] |
SPI Standardized Precipitation Index. 2020. Copernicus European Drought Observatory Report, European Commission, Joint Research Centre. [2022-01-10]. https://edo.jrc.ec.europa.eu/documents/factsheets/factsheet_spi.pdf.
|
|
|
| [51] |
Sternberg T, Thomas D, Middleton N. 2011. Drought dynamics on the Mongolian steppe, 1970-2006. International Journal of Climatology, 31(12): 1823-1830.
|
|
|
| [52] |
Sunyer M A, Hundecha Y, Lawrence D, et al. 2015. Inter-comparison of statistical downscaling methods for projection of extreme precipitation in Europe. Hydrology and Earth System Sciences, 19(4): 1827-1847.
doi: 10.5194/hess-19-1827-2015
|
|
|
| [53] |
Thrasher B, Maurer E P, McKellar C, et al. 2012. Technical Note: Bias correcting climate model simulated daily temperature extremes with quantile mapping. Hydrology and Earth System Sciences, 16(9): 3309-3314.
doi: 10.5194/hess-16-3309-2012
|
|
|
| [54] |
Thrasher B, Nemani R. 2015. NASA Earth Exchange Global Daily Downscaled Projections (NEX-GDDP) Dataset. [2022-01-25]. https://www.nasa.gov/nex/gddp.
|
|
|
| [55] |
Vaghefi S A, Keykhai M, Jahanbakhshi F, et al. 2019. The future of extreme climate in Iran. Scientific Reports, 9(1), doi: 10.1038/s41598-018-38071-8.
doi: 10.1038/s41598-018-38071-8
|
|
|
| [56] |
Vahedifard F, AghaKouchak A, Ragno E, et al. 2017. Lessons from the Oroville dam. Science, 355(6330): 1139-1140.
doi: 10.1126/science.aan0171
pmid: 28302817
|
|
|
| [57] |
Vaittinada Ayar P, Vrac M, Bastin S, et al. 2016. Intercomparison of statistical and dynamical downscaling models under the EURO- and MED-CORDEX initiative framework: present climate evaluations. Climate Dynamics, 46: 1301-1329.
doi: 10.1007/s00382-015-2647-5
|
|
|
| [58] |
Van Dijk A I J M, Beck H E, Crosbie R S, et al. 2013. The millennium drought in southeast Australia (2001-2009): natural and human causes and implications for water resources, ecosystems, economy, and society. Water Resources Research, 49(2): 1040-1057.
doi: 10.1002/wrcr.20123
|
|
|
| [59] |
Vicente-Serrano S M, Beguería S, López-Moreno J I. 2010. A multiscalar drought index sensitive to global warming: the standardized precipitation evapotranspiration index. Journal of Climate, 23(7): 1696-1718.
doi: 10.1175/2009JCLI2909.1
|
|
|
| [60] |
Wang J S, Wang W, Cheng H, et al. 2021. Propagation from meteorological to hydrological drought and its influencing factors in the Huaihe River Basin. Water, 13(14), doi: 10.3390/w13141985.
doi: 10.3390/w13141985
|
|
|
| [61] |
Ward P J, Marleen C D R, Mård J, et al. 2020. The need to integrate flood and drought disaster risk reduction strategies. Water Security, 11, doi: 10.1016/j.wasec.2020.100070.
doi: 10.1016/j.wasec.2020.100070
|
|
|
| [62] |
WMO World Meteorological Organization, GWP (Global Water Partnership). 2016. Handbook of Drought Indicators and Indices. [2022-01-25]. https://library.wmo.int/doc_num.php?explnum_id=3057.
|
|
|
| [63] |
Wilby R L, Harris I. 2006. A framework for assessing uncertainties in climate change impacts: low flow scenarios for the river Thames, UK. Water Resources Research, 420(2), doi: 10.1029/2005WR004065.
doi: 10.1029/2005WR004065
|
|
|
| [64] |
Wilhite D A. 2000. Drought as a Natural Hazard:Concepts and Definitions. Drought:A Global Assessment. Nebraska: Nebraska University Press.
|
|
|
| [65] |
Wilks D S. 2019. Statistical Methods in the Atmospheric Sciences. [2022-01-25]. https://www.sciencedirect.com/book/9780128158234/statistical-methods-in-the-atmospheric-sciences.
|
|
|
| [66] |
Wood A W, Maurer E P, Kumar A, et al. 2002. Long-range experimental hydrologic forecasting for the eastern United States. Journal of Geophysical Research-Atmospheres, 107, doi: 10.1029/2001JD000659.
doi: 10.1029/2001JD000659
|
|
|
| [67] |
Wood A W, Leung L R, Sridhar V, et al. 2004. Hydrologic implications of dynamical and statistical approaches to downscaling climate model outputs. Climatic Change, 62: 189-216.
doi: 10.1023/B:CLIM.0000013685.99609.9e
|
|
|
| [68] |
Wu C, Yeh P J F, Chen Y Y, et al. 2020. Future precipitation-driven meteorological drought changes in the CMIP 5 multi-model ensembles under 1.5°C and 2°C global warming. Journal of Hydrometeorology, 21(9): 2177-2196.
doi: 10.1175/JHM-D-19-0299.1
|
|
|
| [69] |
Wu C, Yeh P J F, Ju J, et al. 2021. Assessing the spatiotemporal uncertainties in future meteorological droughts from CMIP 5 models, emission scenarios, and bias corrections. Journal of Climate, 34(5): 1903-1922.
doi: 10.1175/JCLI-D-20-0411.1
|
|
|
| [70] |
Wu H, Hayes M J, Weiss A, et al. 2001. An evaluation of the standardized precipitation index, the China-Z index and the statistical Z-score. International Journal of Climatology, 21(6): 745-758.
doi: 10.1002/(ISSN)1097-0088
|
|
|
| [71] |
Xu B B, Ju J L, Wu C H, et al. 2019. Projection and uncertainty of precipitation extremes in the CMIP5 multimodel ensembles over nine major basins in China. Atmospheric Research, 226: 122-137.
doi: 10.1016/j.atmosres.2019.04.018
|
|
|
|
Viewed |
|
|
|
Full text
|
|
|
|
|
Abstract
|
|
|
|
|
Cited |
|
|
|
|
| |
Shared |
|
|
|
|
| |
Discussed |
|
|
|
|