| Research article |
|


|
|
|
| Projection of hydrothermal condition in Central Asia under four SSP-RCP scenarios |
YAO Linlin1,2,3, ZHOU Hongfei1,2,*( ), YAN Yingjie1,2,3, LI Lanhai1,3,4,5,6, SU Yuan1,2,3 ), YAN Yingjie1,2,3, LI Lanhai1,3,4,5,6, SU Yuan1,2,3 |
1State Key Laboratory of Desert and Oasis Ecology, Xinjiang Institute of Ecology and Geography, Chinese Academy of Sciences, Urumqi 830011, China
2Fukang National Field Scientific Observation and Research Station for Desert Ecosystems, Chinese Academy of Sciences, Fukang 831505, China
3University of Chinese Academy of Sciences, Beijing 100049, China
4Ili Station for Watershed Ecosystem Research, Chinese Academy of Sciences, Xinyuan 835800, China
5CAS Research Center for Ecology and Environment of Central Asia, Urumqi 830011, China
6Xinjiang Key Laboratory of Water Cycle and Utilization in Arid Zone, Urumqi 830011, China |
|
|
|
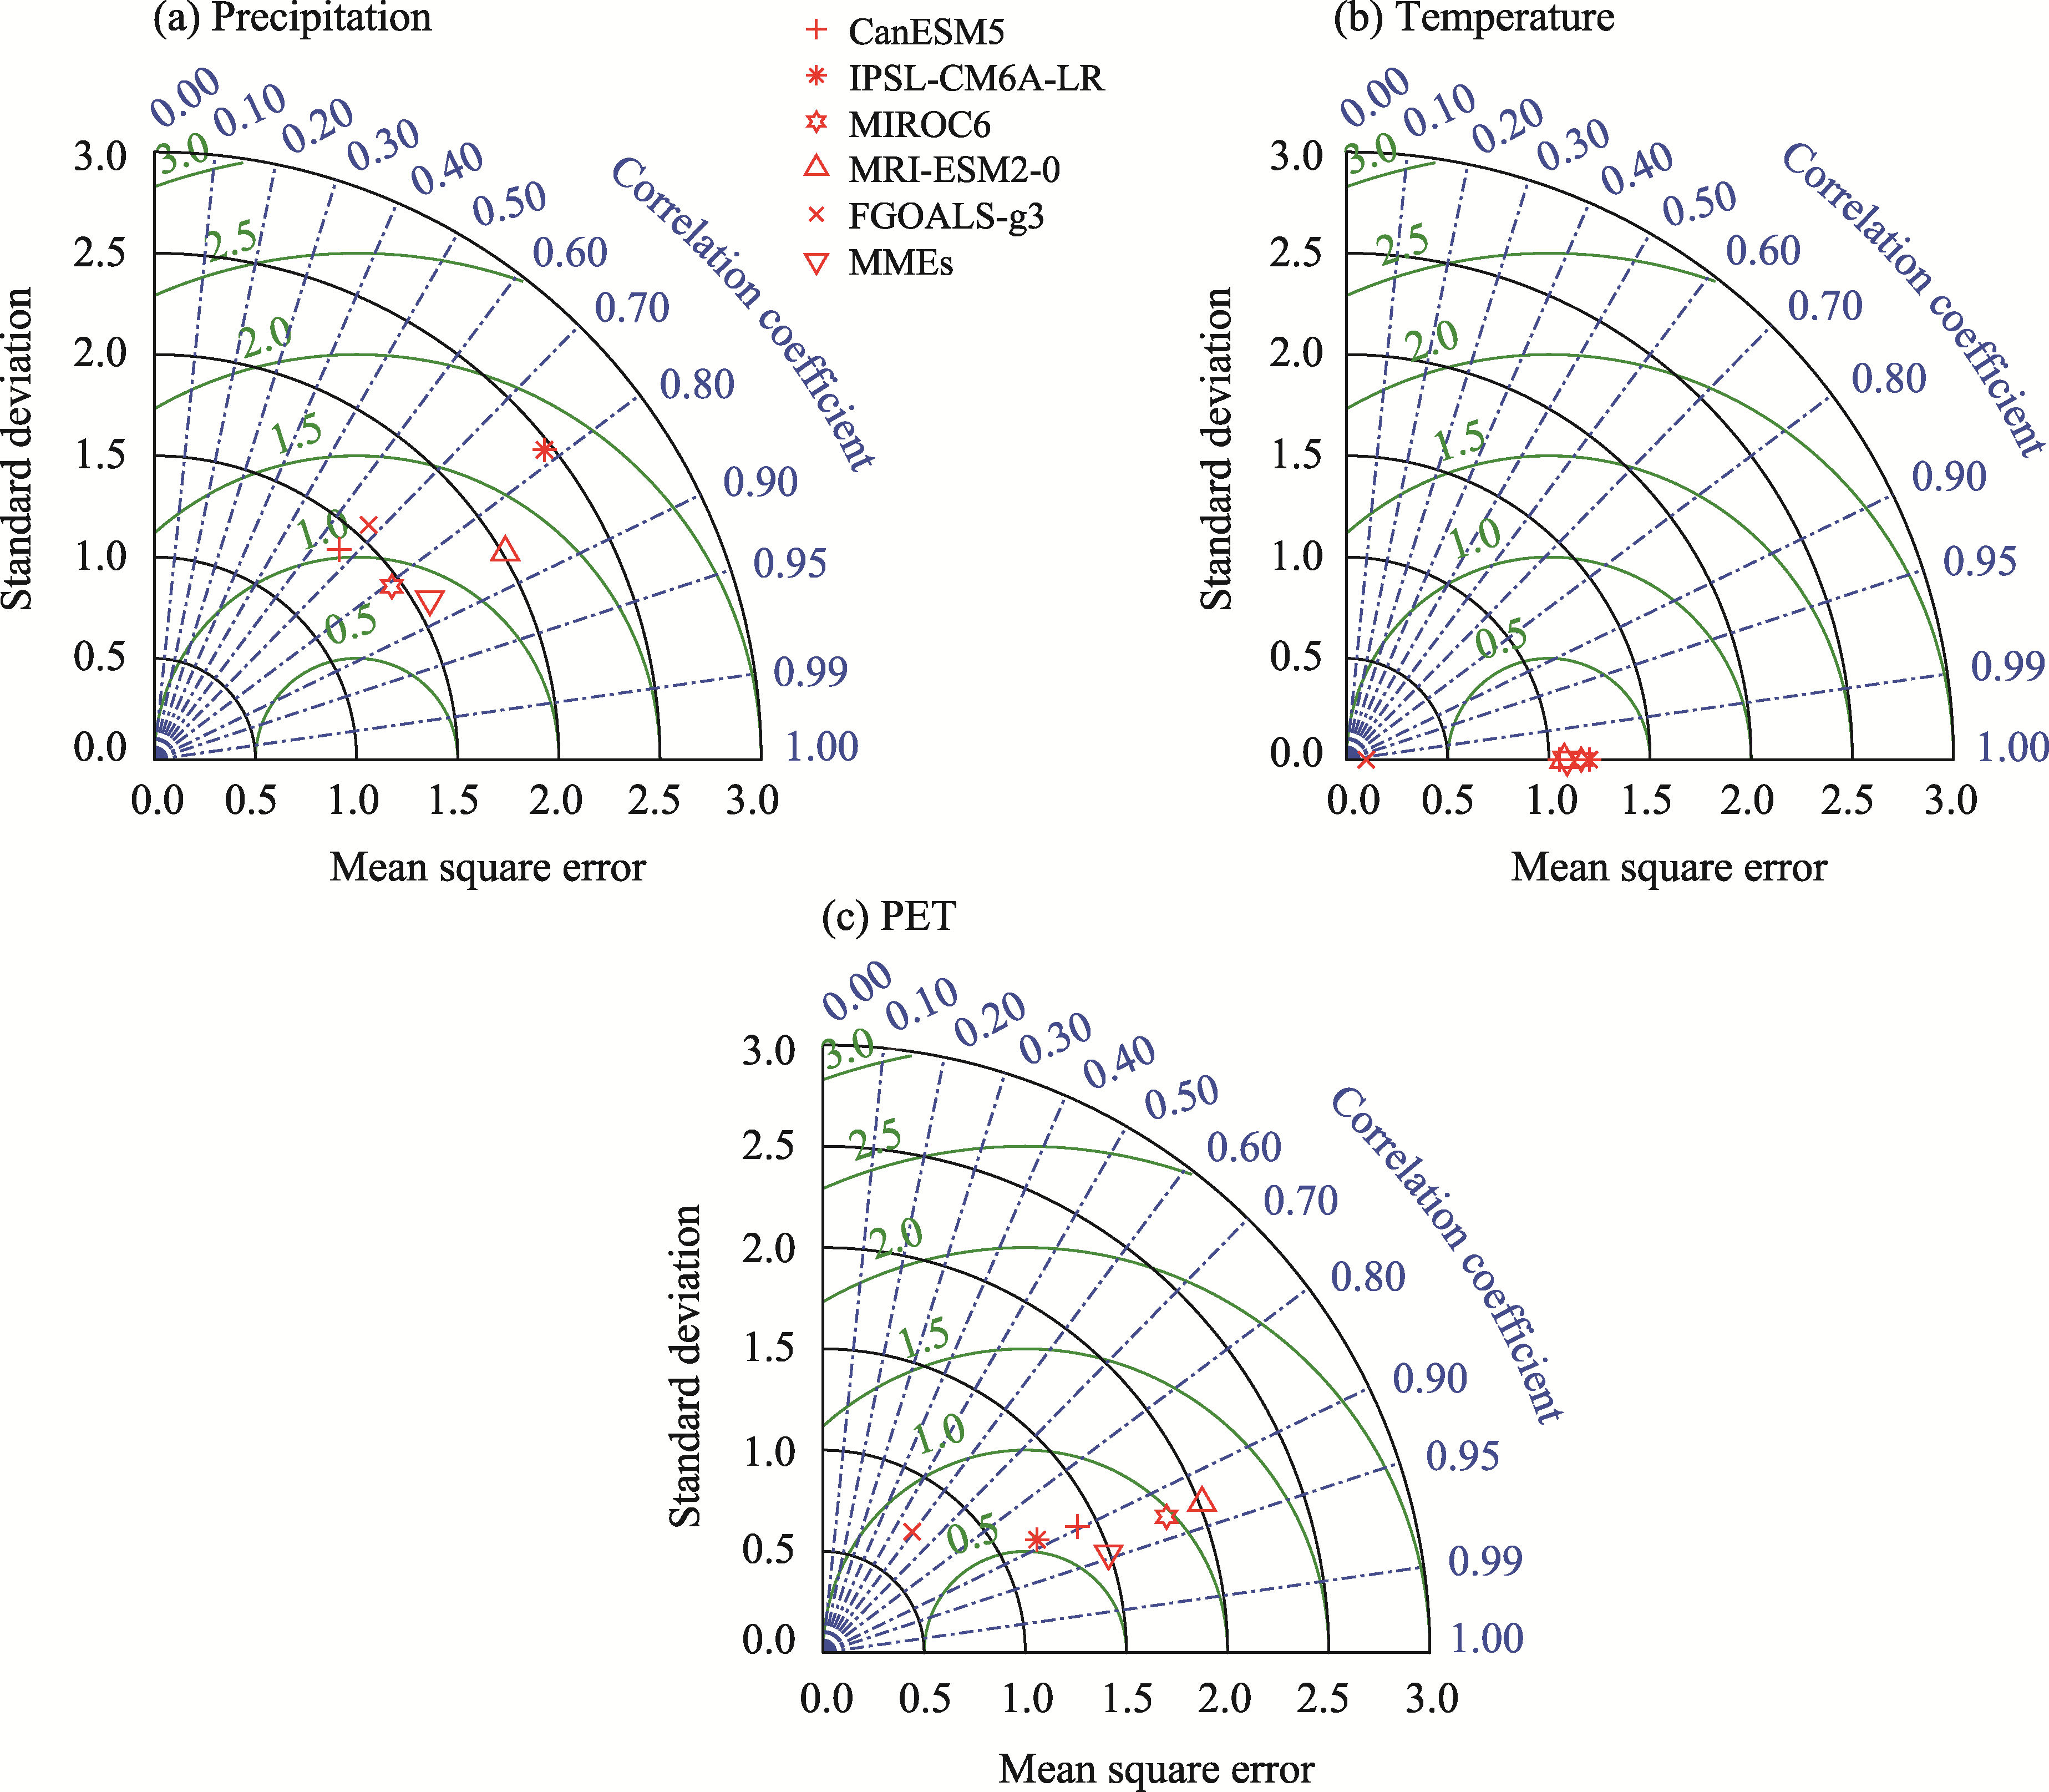
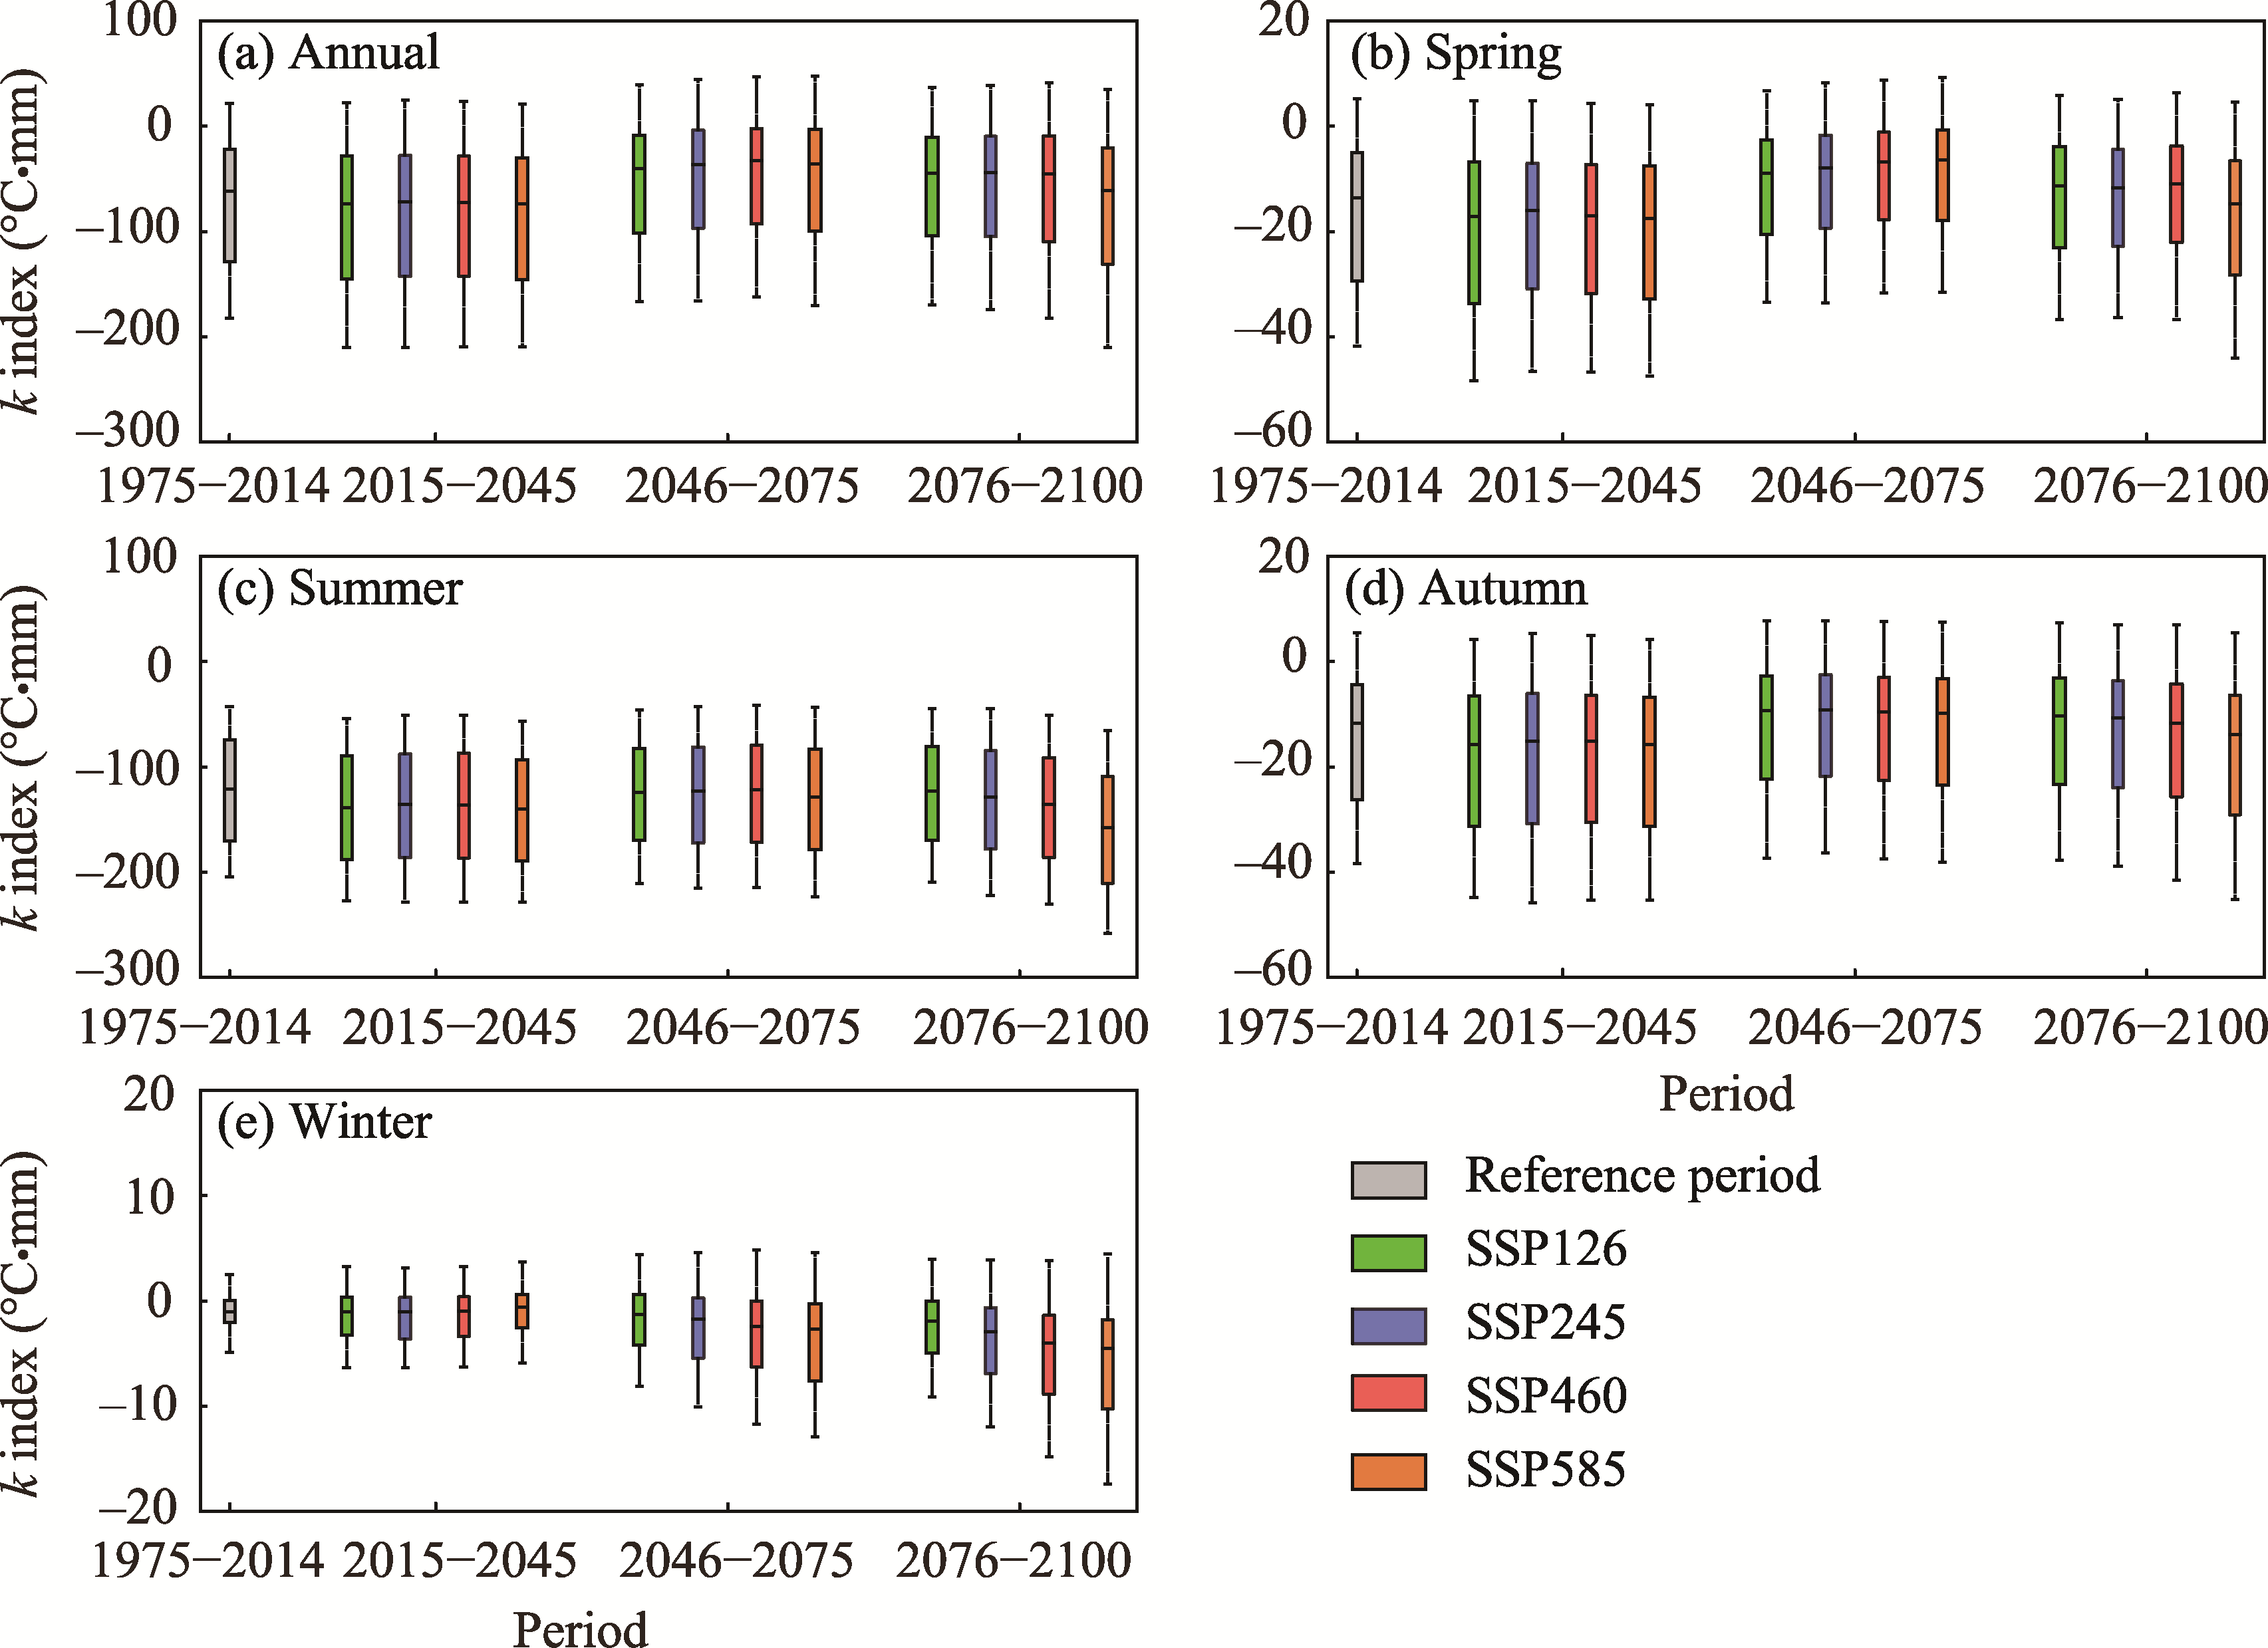
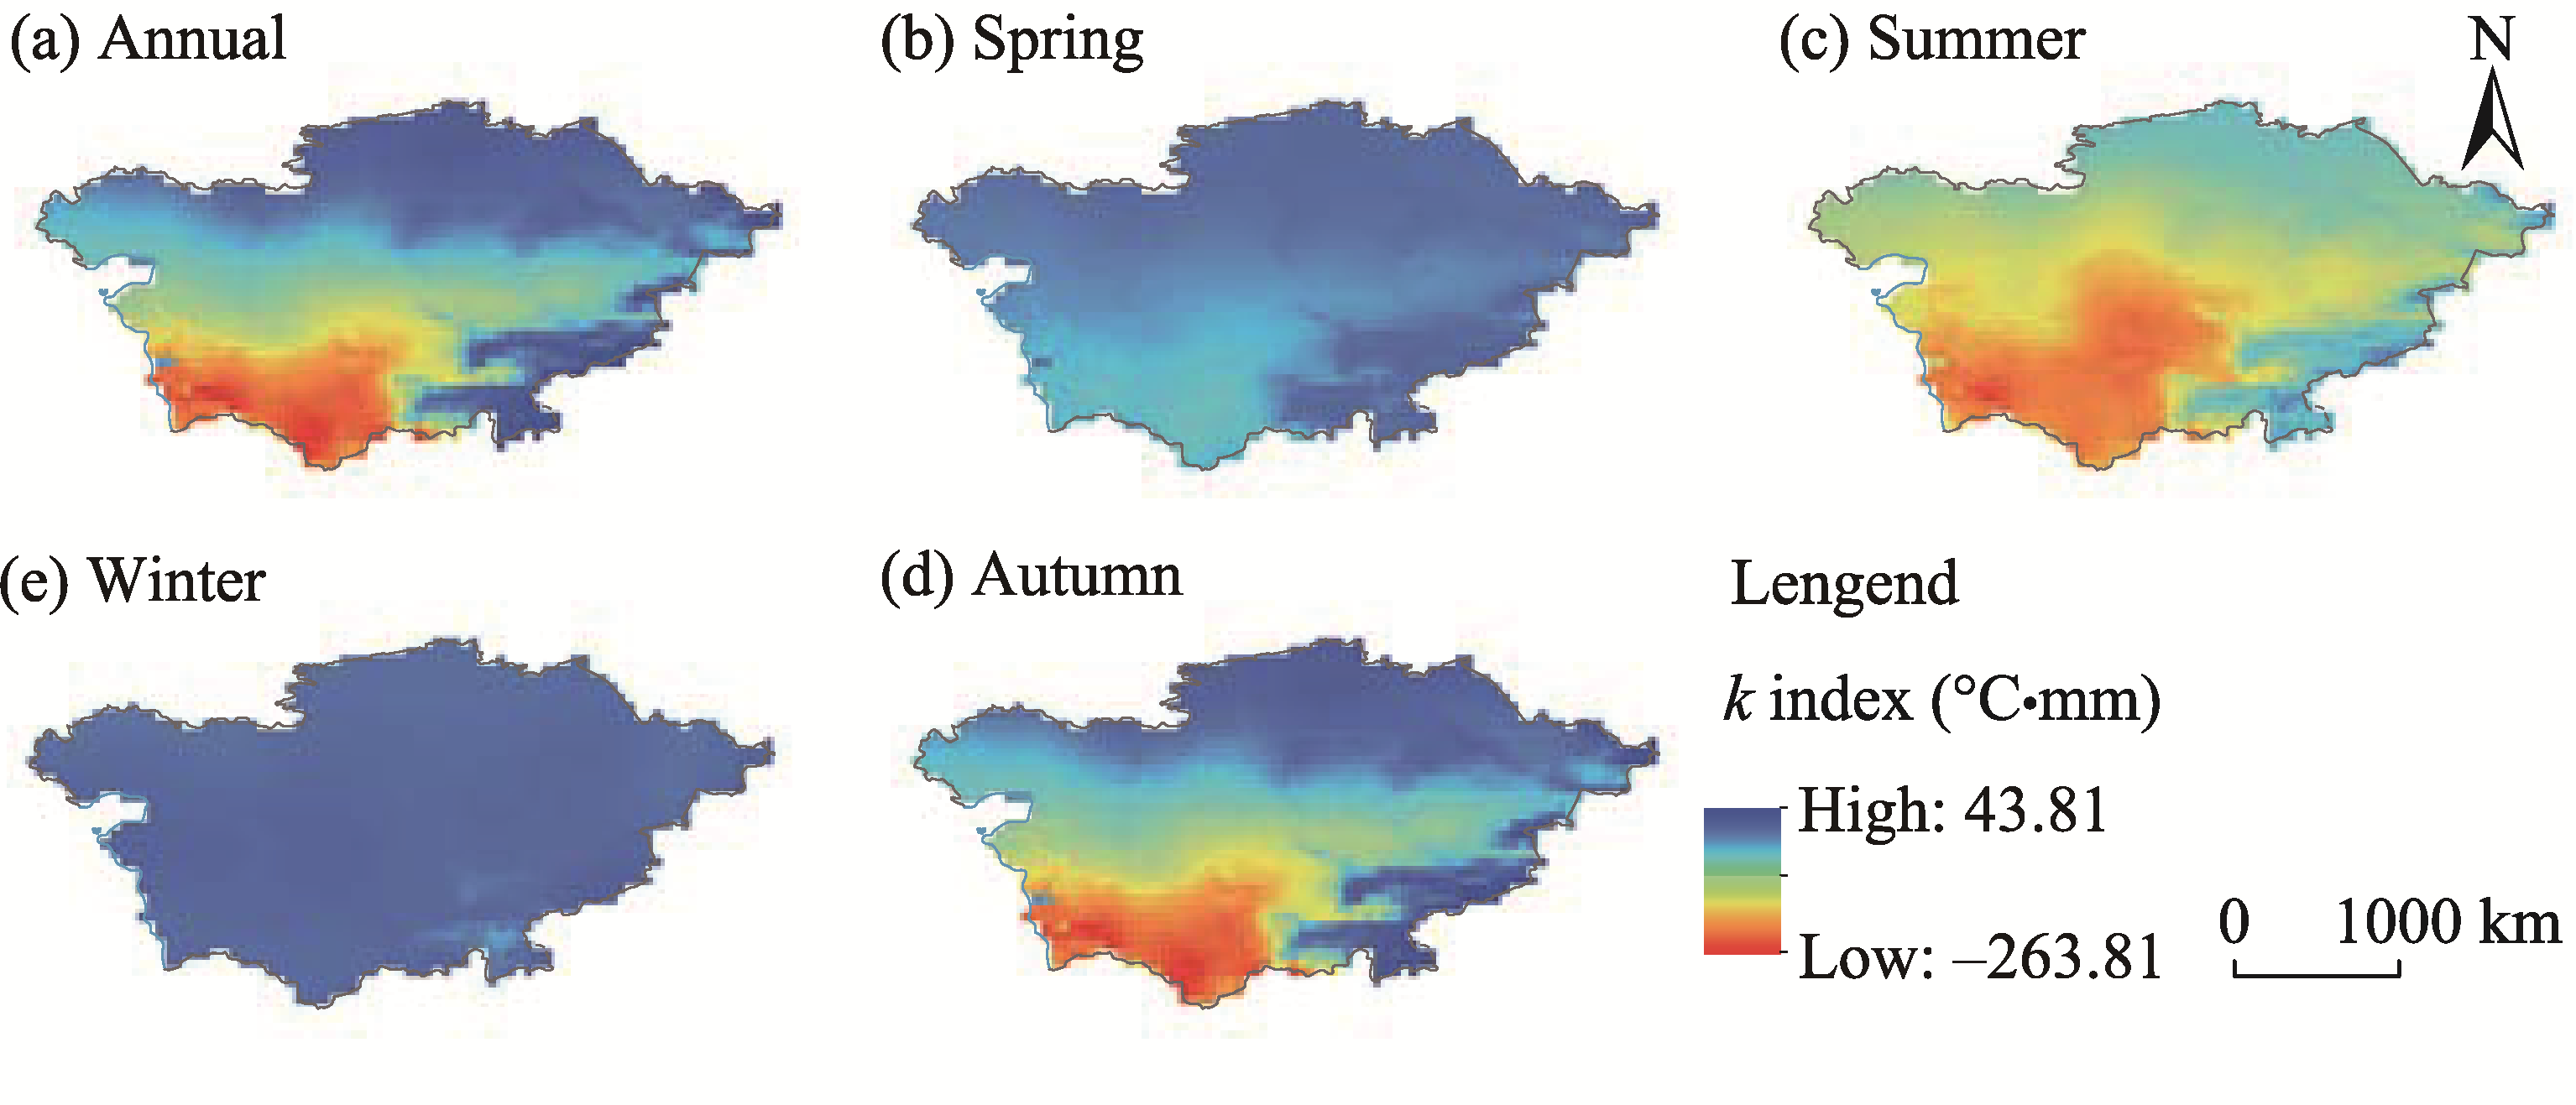
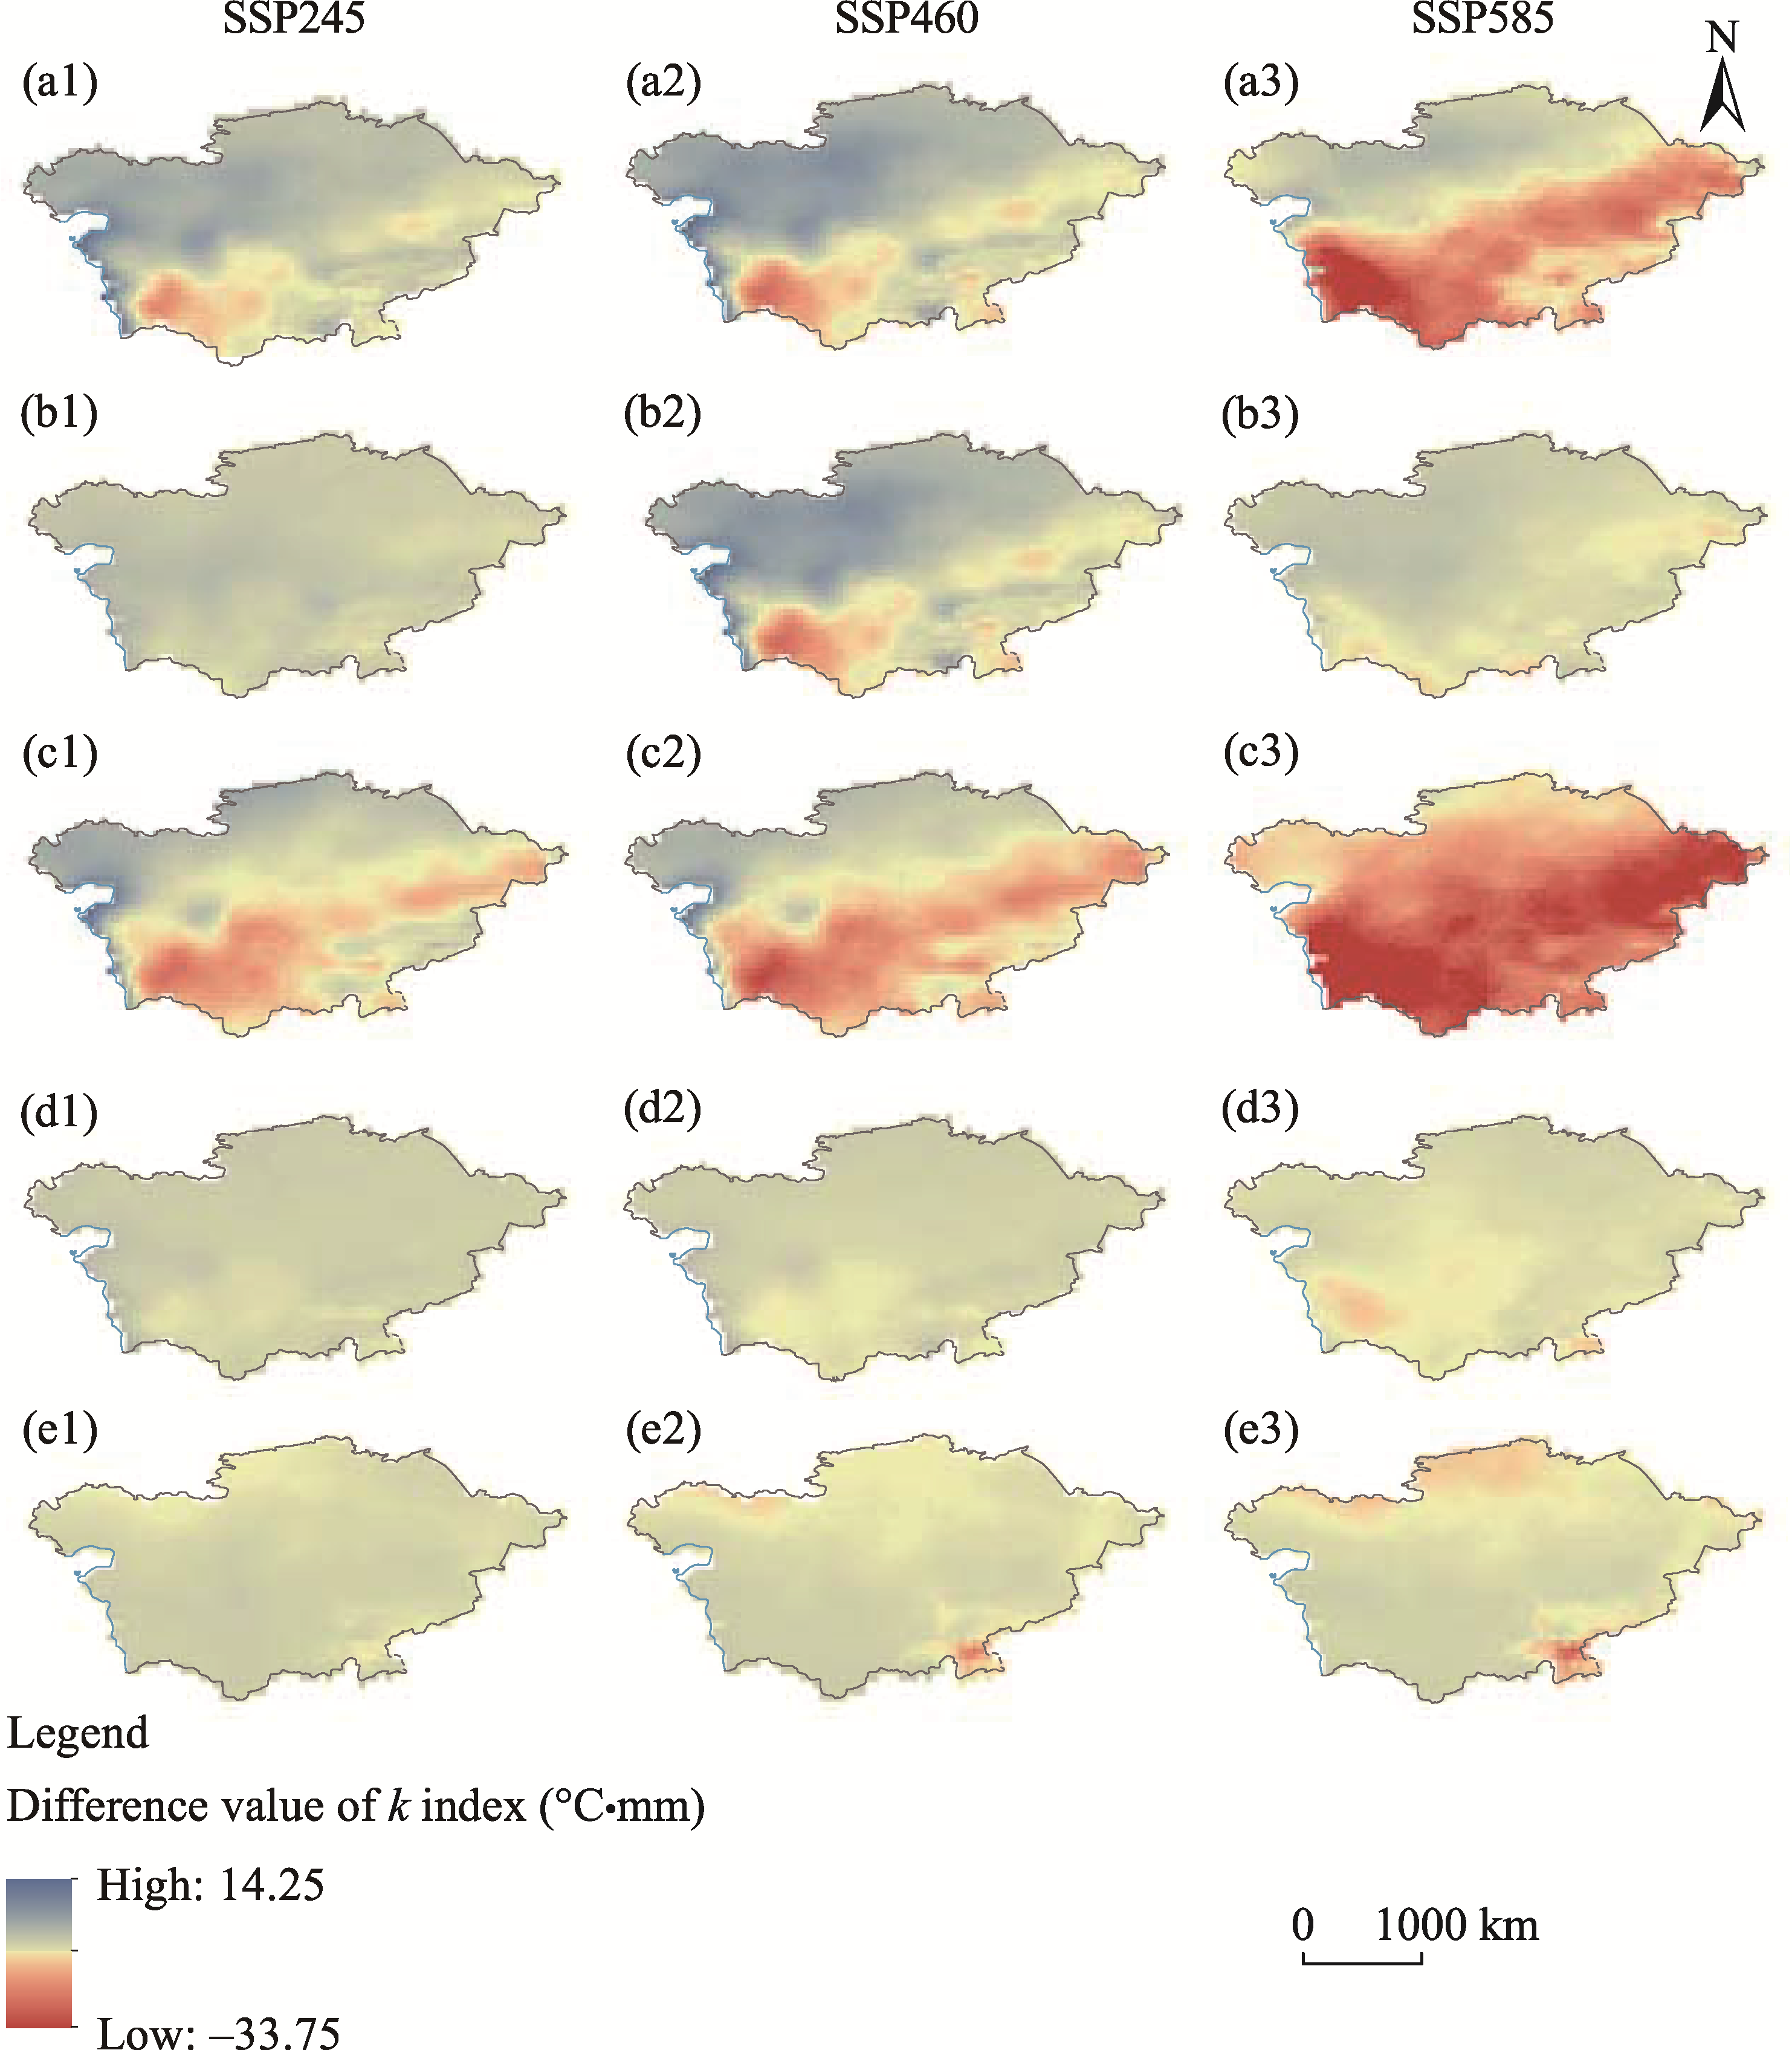
Abstract Hydrothermal condition is mismatched in arid and semi-arid regions, particularly in Central Asia (including Kazakhstan, Kyrgyzstan, Tajikistan, Uzbekistan, and Turkmenistan), resulting many environmental limitations. In this study, we projected hydrothermal condition in Central Asia based on bias-corrected multi-model ensembles (MMEs) from the Coupled Model Intercomparison Project Phase 6 (CMIP6) under four Shared Socioeconomic Pathway and Representative Concentration Pathway (SSP-RCP) scenarios (SSP126 (SSP1-RCP2.6), SSP245 (SSP2-RCP4.5), SSP460 (SSP4-RCP6.0), and SSP585 (SSP5-RCP8.5)) during 2015-2100. The bias correction and spatial disaggregation, water-thermal product index, and sensitivity analysis were used in this study. The results showed that the hydrothermal condition is mismatched in the central and southern deserts, whereas the region of Pamir Mountains and Tianshan Mountains as well as the northern plains of Kazakhstan showed a matched hydrothermal condition. Compared with the historical period, the matched degree of hydrothermal condition improves during 2046-2075, but degenerates during 2015-2044 and 2076-2100. The change of hydrothermal condition is sensitive to precipitation in the northern regions and the maximum temperatures in the southern regions. The result suggests that the optimal scenario in Central Asia is SSP126 scenario, while SSP585 scenario brings further hydrothermal contradictions. This study provides scientific information for the development and sustainable utilization of hydrothermal resources in arid and semi-arid regions under climate change.
|
|
Received: 22 December 2021
Published: 31 May 2022
|
| Fund: the Strategic Priority Research Program of Chinese Academy of Sciences, Pan-Third Pole Environment Study for a Green Silk Road (Pan-TPE) of China(XDA2004030202);Shanghai Cooperation and the Organization Science and Technology Partnership of China(2021E01019) |
|
Corresponding Authors:
*: ZHOU Hongfei (E-mail: zhouhongfei_ucas@163.com)
|
|
|
| [1] |
Abd-Elmabod S K, Muñoz-Rojas M, Jordán A, et al. 2020. Climate change impacts on agricultural suitability and yield reduction in a Mediterranean region. Geoderma, 374: 114453, doi: 10.1016/j.geoderma.2020.114453.
doi: 10.1016/j.geoderma.2020.114453
|
|
|
| [2] |
Ahmed K F, Wang G L, Silander J, et al. 2013. Statistical downscaling and bias correction of climate model outputs for climate change impact assessment in the U.S. northeast. Global and Planetary Change, 100: 320-332.
doi: 10.1016/j.gloplacha.2012.11.003
|
|
|
| [3] |
Alley W M. 1984. The Palmer drought severity index: limitations and assumptions. Journal of Applied Meteorology and Climatology, 23(7): 1100-1109.
|
|
|
| [4] |
Bannayan M, Sanjani S, Alizadeh A, et al. 2010. Association between climate indices, aridity index, and rainfed crop yield in northeast of Iran. Field Crops Research, 118(2): 105-114.
doi: 10.1016/j.fcr.2010.04.011
|
|
|
| [5] |
Beven K. 1979. A sensitivity analysis of the Penman-Monteith actual evapotranspiration estimates. Journal of Hydrology, 44(3-4): 169-190.
doi: 10.1016/0022-1694(79)90130-6
|
|
|
| [6] |
Cardoso A S, Alonso J, Rodrigues A S, et al. 2019. Agro-ecological terroir units in the North West Iberian Peninsula wine regions. Applied Geography, 107: 51-62.
doi: 10.1016/j.apgeog.2019.03.011
|
|
|
| [7] |
Carli C, Yuldashev F, Khalikov D, et al. 2014. Effect of different irrigation regimes on yield, water use efficiency and quality of potato (Solanum tuberosum L.) in the lowlands of Tashkent, Uzbekistan: A field and modeling perspective. Field Crops Research, 163: 90-99.
doi: 10.1016/j.fcr.2014.03.021
|
|
|
| [8] |
Chernozhukov V, Galichon A, Hallin M, et al. 2017. Monge-kantorovich depth, quantiles, ranks and signs. The Annals of Statistics, 45(1): 223-256.
|
|
|
| [9] |
Christensen J H, Boberg F, Christensen O B, et al. 2008. On the need for bias correction of regional climate change projections of temperature and precipitation. Geophysical Research Letters, 35(20): 6.
|
|
|
| [10] |
Deng H Y, Yin Y H, Han X. 2020. Vulnerability of vegetation activities to drought in Central Asia. Environmental Research Letters, 15(8): 12.
|
|
|
| [11] |
Dubovyk O, Ghazaryan G, Gonzalez J, et al. 2019. Drought hazard in Kazakhstan in 2000-2016: a remote sensing perspective. Environmental Monitoring and Assessment, 191(8): 1-17.
|
|
|
| [12] |
Eyring V, Bony S, Meehl G A, et al. 2016. Overview of the Coupled Model Intercomparison Project Phase 6 (CMIP6) experimental design and organization. Geoscientific Model Development, 9(5): 1937-1958.
doi: 10.5194/gmd-9-1937-2016
|
|
|
| [13] |
Fang W, Huang S, Huang Q, et al. 2019. Probabilistic assessment of remote sensing-based terrestrial vegetation vulnerability to drought stress of the Loess Plateau in China. Remote Sensing of Environment, 232: 111290, doi: 10.1016/j.rse.2019.111290.
doi: 10.1016/j.rse.2019.111290
|
|
|
| [14] |
Ge F, Zhu S P, Luo H L, et al. 2021. Future changes in precipitation extremes over Southeast Asia: insights from CMIP 6 multi-model ensemble. Environmental Research Letters, 16(2): 024013, doi: 10.1088/1748-9326/abd7ad.
doi: 10.1088/1748-9326/abd7ad
|
|
|
| [15] |
Geng H, Pan B, Huang B, et al. 2017. The spatial distribution of precipitation and topography in the Qilian Shan Mountains, northeastern Tibetan Plateau. Geomorphology, 297: 43-54.
doi: 10.1016/j.geomorph.2017.08.050
|
|
|
| [16] |
Gidden M J, Riahi K, Smith S J, et al. 2019. Global emissions pathways under different socioeconomic scenarios for use in CMIP6: a dataset of harmonized emissions trajectories through the end of the century. Geoscientific Model Development, 12(4): 1443-1475.
doi: 10.5194/gmd-12-1443-2019
|
|
|
| [17] |
Guo H, Bao A M,Chen T, et al. 2021. Assessment of CMIP6 in simulating precipitation over arid Central Asia. Atmospheric Research, 252: 105451, doi: 10.1016/j.atmosres.2021.105451.
doi: 10.1016/j.atmosres.2021.105451
|
|
|
| [18] |
Harris I, Jones P D, Osborn T J, et al. 2014. Updated high-resolution grids of monthly climatic observations - the CRU TS3.10 Dataset. International Journal of Climatology, 34(3): 623-642.
doi: 10.1002/joc.3711
|
|
|
| [19] |
Horion S, Prishchepov A V, Verbesselt J, et al. 2016. Revealing turning points in ecosystem functioning over the Northern Eurasian agricultural frontier. Global Change Biology, 22(8): 2801-2817.
doi: 10.1111/gcb.13267
|
|
|
| [20] |
Ji X, Li Y, Luo X, et al. 2020. Evaluation of bias correction methods for APHRODITE data to improve hydrologic simulation in a large Himalayan basin. Atmospheric Research, 242: 104964, doi: 10.1016/j.atmosres.2020.104964.
doi: 10.1016/j.atmosres.2020.104964
|
|
|
| [21] |
Jiang L L, Jiapaer G, Bao A M, et al. 2019. Monitoring the long-term desertification process and assessing the relative roles of its drivers in Central Asia. Ecological Indicators, 104: 195-208.
doi: 10.1016/j.ecolind.2019.04.067
|
|
|
| [22] |
Jiang L L, Bao A M,Jiapaer G, et al. 2022. Monitoring land degradation and assessing its drivers to support sustainable development goal 15.3 in Central Asia. Science of the Total Environment, 807: 150868, doi: 10.1016/j.scitotenv.2021.150868.
doi: 10.1016/j.scitotenv.2021.150868
|
|
|
| [23] |
Kienzler K M, Lamers J P A, McDonald A, et al. 2012. Conservation agriculture in Central Asia-What do we know and where do we go from here? Field Crops Research, 132: 95-105.
doi: 10.1016/j.fcr.2011.12.008
|
|
|
| [24] |
Konapala G, Mishra A K, Wada Y, et al. 2020. Climate change will affect global water availability through compounding changes in seasonal precipitation and evaporation. Nature Communications, 11(1): 3044, doi: 10.1038/s41467-020-16 757-w.
doi: 10.1038/s41467-020-16757-w
pmid: 32576822
|
|
|
| [25] |
Lacombe G, Hoanh C T, Smakhtin V. 2012. Multi-year variability or unidirectional trends? Mapping long-term precipitation and temperature changes in continental Southeast Asia using PRECIS regional climate model. Climatic Change, 113: 285-299.
doi: 10.1007/s10584-011-0359-3
|
|
|
| [26] |
Li J, Fei L, Li S, et al. 2020. Development of "water-suitable" agriculture based on a statistical analysis of factors affecting irrigation water demand. Science of the Total Environment, 744: 140986, doi: 10.1016/j.scitotenv.2020.140986.
doi: 10.1016/j.scitotenv.2020.140986
|
|
|
| [27] |
Li M X, Ma Z G. 2018. Decadal changes in summer precipitation over arid northwest China and associated atmospheric circulations. International Journal of Climatology, 38(12): 4496-4508.
doi: 10.1002/joc.5682
|
|
|
| [28] |
Li W, Li C, Liu X, et al. 2018. Analysis of spatial-temporal variation in NPP based on hydrothermal conditions in the Lancang-Mekong River Basin from 2000 to 2014. Environmental Monitoring and Assessment, 190(6): 321, doi: 10.1007/s10661-018-6690-7.
doi: 10.1007/s10661-018-6690-7
|
|
|
| [29] |
Li Z, Fang G, Chen Y, et al. 2020. Agricultural water demands in Central Asia under 1.5 degrees C and 2.0 degrees C global warming. Agricultural Water Management, 231: 106020, doi: 10.1016/j.agwat.2020.106020.
doi: 10.1016/j.agwat.2020.106020
|
|
|
| [30] |
Lioubimtseva E, Henebry G M. 2009. Climate and environmental change in arid Central Asia: Impacts, vulnerability, and adaptations. Journal of Arid Environments, 73(11): 963-977.
doi: 10.1016/j.jaridenv.2009.04.022
|
|
|
| [31] |
Luo M, Liu T, Meng F H, et al. 2019. Spatiotemporal characteristics of future changes in precipitation and temperature in Central Asia. International Journal of Climatology, 39(3): 1571-1588.
doi: 10.1002/joc.5901
|
|
|
| [32] |
Mannig B, Muller M, Starke E, et al. 2013. Dynamical downscaling of climate change in Central Asia. Global and Planetary Change, 110: 26-39.
doi: 10.1016/j.gloplacha.2013.05.008
|
|
|
| [33] |
Martonne E D. 1926. A new ciimatological function: the aridity index. La Météorologie, 2: 449-458. (in French)
|
|
|
| [34] |
McCain C M, Colwell R K. 2011. Assessing the threat to montane biodiversity from discordant shifts in temperature and precipitation in a changing climate. Ecology Letters, 14(12): 1236-1245.
doi: 10.1111/j.1461-0248.2011.01695.x
|
|
|
| [35] |
Meng M, Ni J, Zhang Z G. 2004. Aridity index and its applications in geo-ecological study. Acta Phytoecologica Sinica, 28: 853-861. (in Chinese)
|
|
|
| [36] |
Mondal S K, Huang J, Wang Y, et al. 2021. Doubling of the population exposed to drought over South Asia: CMIP6 multi-model-based analysis. Science of the Total Environment, 771: 145186, doi: 10.1016/j.scitotenv.2021.145186.
doi: 10.1016/j.scitotenv.2021.145186
|
|
|
| [37] |
Ni J, Zhang X S. 1997. Estimation of water and thermal product index and its application to the study of vegetation-climate interaction in China. Acta Botanica Sinica, 12: 1147-1159. (in Chinese)
|
|
|
| [38] |
Reshmidevi T V, Eldho T I, Jana R. 2009. A GIS-integrated fuzzy rule-based inference system for land suitability evaluation in agricultural watersheds. Agricultural Systems, 101(1-2): 101-109.
doi: 10.1016/j.agsy.2009.04.001
|
|
|
| [39] |
Rivera J A,Arnould G. 2020. Evaluation of the ability of CMIP 6 models to simulate precipitation over Southwestern South America: Climatic features and long-term trends (1901-2014). Atmospheric Research, 241: 104953, doi: 10.1016/j.atmosres.2020.104953.
doi: 10.1016/j.atmosres.2020.104953
|
|
|
| [40] |
Schierhorn F, Hofmann M, Adrian I, et al. 2020. Spatially varying impacts of climate change on wheat and barley yields in Kazakhstan. Journal of Arid Environments, 178: 104164, doi: 10.1016/j.jaridenv.2020.104164.
doi: 10.1016/j.jaridenv.2020.104164
|
|
|
| [41] |
Seljaninov G T. 1966. Agroclimatic Map of the World. Leningrad: Hydrometeoizdat Publishing House.
|
|
|
| [42] |
Seo K H, Ok J. 2013. Assessing future changes in the East Asian summer monsoon using CMIP 3 models: results from the best model ensemble. Journal of Climate, 26(5): 1807-1817.
doi: 10.1175/JCLI-D-12-00109.1
|
|
|
| [43] |
Su B, Huang J, Mondal S K, et al. 2021. Insight from CMIP6 SSP-RCP scenarios for future drought characteristics in China. Atmospheric Research, 250: 105375, doi: 10.1016/j.atmosres.2020.105375.
doi: 10.1016/j.atmosres.2020.105375
|
|
|
| [44] |
Sun F Y, Mejia A, Zeng P, et al. 2019. Projecting meteorological, hydrological and agricultural droughts for the Yangtze River basin. Science of the Total Environment, 696: 134076, doi: 10.1016/j.scitotenv.2019.134076.
doi: 10.1016/j.scitotenv.2019.134076
|
|
|
| [45] |
Taylor K E. 2001. Summarizing multiple aspects of model performance in a single diagram. Journal of Geophysical Research-Atmospheres, 106(D7): 7183-7192.
doi: 10.1029/2000JD900719
|
|
|
| [46] |
Teutschbein C, Seibert J. 2012. Bias correction of regional climate model simulations for hydrological climate-change impact studies: Review and evaluation of different methods. Journal of Hydrology, 456: 12-29.
|
|
|
| [47] |
Vicente-Serrano S M, Begueria S, Lopez-Moreno J I. 2010. A multiscalar drought index sensitive to global warming: the standardized precipitation evapotranspiration index. Journal of Climate, 23(7): 1696-1718.
doi: 10.1175/2009JCLI2909.1
|
|
|
| [48] |
Wang H, Zang F, Zhao C, et al. 2022. A GWR downscaling method to reconstruct high-resolution precipitation dataset based on GSMaP-Gauge data: A case study in the Qilian Mountains, Northwest China. Science of the Total Environment, 810: 1522066, doi: 10.1016/j.scitotenv.2021.152066.
doi: 10.1016/j.scitotenv.2021.152066
|
|
|
| [49] |
Wang J S, Chen F H, Jin L Y, et al. 2010. Characteristics of the dry/wet trend over arid central Asia over the past 100 years. Climate Research, 41: 51-59.
doi: 10.3354/cr00837
|
|
|
| [50] |
Wang T, Tu X, Singh V P, et al. 2021. Global data assessment and analysis of drought characteristics based on CMIP6. Journal of Hydrology, 596: 126091, doi: 10.1016/j.jhydrol.2021.126091.
doi: 10.1016/j.jhydrol.2021.126091
|
|
|
| [51] |
Weiland F C S, van Beek L P H, Weerts A H, et al. 2012. Extracting information from an ensemble of GCMs to reliably assess future global runoff change. Journal of Hydrology, 412: 66-75.
|
|
|
| [52] |
Weltzin J F, Loik M E, Schwinning S, et al. 2003. Assessing the response of terrestrial ecosystems to potential changes in precipitation. Bioscience, 53(10): 941-952.
doi: 10.1641/0006-3568(2003)053[0941:ATROTE]2.0.CO;2
|
|
|
| [53] |
Wood A W, Maurer E P, Kumar A, et al. 2002. Long-range experimental hydrologic forecasting for the eastern United States. Journal of Geophysical Research-Atmospheres, 107(D20): 15, doi: 10.1029/2001jd000659.
doi: 10.1029/2001jd000659
|
|
|
| [54] |
Wood A W, Leung L R, Sridhar V, et al. 2004. Hydrologic implications of dynamical and statistical approaches to downscaling climate model outputs. Climatic Change, 62(1-3): 189-216.
doi: 10.1023/B:CLIM.0000013685.99609.9e
|
|
|
| [55] |
Wu H, Huang A, He Q, et al. 2013. Projection of the spatial and temporal variation characteristics of precipitation over Central Asia of 10 CMIP5 models in the next 50years. Arid Land Geography, 36(4): 669-679. (in Chinese)
|
|
|
| [56] |
Wu Z T, Dijkstra P, Koch G W, et al. 2011. Responses of terrestrial ecosystems to temperature and precipitation change: a meta-analysis of experimental manipulation. Global Change Biology, 17(2): 927-942.
doi: 10.1111/j.1365-2486.2010.02302.x
|
|
|
| [57] |
Xu H j, Wang X P, Zhang X X. 2016. Decreased vegetation growth in response to summer drought in Central Asia from 2000 to 2012. International Journal of Applied Earth Observation and Geoinformation, 52: 390-402.
doi: 10.1016/j.jag.2016.07.010
|
|
|
| [58] |
Yu Y, Chen X, Disse M, et al. 2020. Climate change in Central Asia: Sino-German cooperative research findings. Science Bulletin, 65(9): 689-692.
doi: 10.1016/j.scib.2020.02.008
|
|
|
| [59] |
Yuan Y, Bao A, Jiang P, et al. 2022. Probabilistic assessment of vegetation vulnerability to drought stress in Central Asia. Journal of Environmental Management, 310: 114504, doi: 10.1016/j.jenvman.2022.114504.
doi: 10.1016/j.jenvman.2022.114504
|
|
|
| [60] |
Zeng P, Sun F,Liu Y, et al. 2021. Mapping future droughts under global warming across China: A combined multi-timescale meteorological drought index and SOM-Kmeans approach. Weather and Climate Extremes, 31: 100304, doi: 10.1016/j.wace.2021.100304.
doi: 10.1016/j.wace.2021.100304
|
|
|
| [61] |
Zhan Y J, Ren G Y, Yang S. 2018. Change in precipitation over the Asian continent from 1901-2016 based on a new multi-source dataset. Climate Research, 76(1): 41-57.
doi: 10.3354/cr01523
|
|
|
| [62] |
Zhang J, Su Y, Wu J, et al. 2015. GIS based land suitability assessment for tobacco production using AHP and fuzzy set in Shandong province of China. Computers and Electronics in Agriculture, 114: 202-211.
doi: 10.1016/j.compag.2015.04.004
|
|
|
|
Viewed |
|
|
|
Full text
|
|
|
|
|
Abstract
|
|
|
|
|
Cited |
|
|
|
|
| |
Shared |
|
|
|
|
| |
Discussed |
|
|
|
|