| Research article |
|


|
|
|
| Adjustment of precipitation measurements using Total Rain weighing Sensor (TRwS) gauges in the cryospheric hydrometeorology observation (CHOICE) system of the Qilian Mountains, Northwest China |
ZHAO Yanni1,2, CHEN Rensheng1,3,*( ), HAN Chuntan1,2, WANG Lei4 ), HAN Chuntan1,2, WANG Lei4 |
1Qilian Alpine Ecology and Hydrology Research Station, Northwest Institute of Eco-Environment and Resources, Chinese Academy of Sciences, Lanzhou 730000, China
2University of Chinese Academy of Sciences, Beijing 100049, China
3College of Urban and Environment Sciences, Northwest University, Xi'an 710127, China
4College of Geography and Environment, Shandong Normal University, Jinan 250014, China |
|
|
|
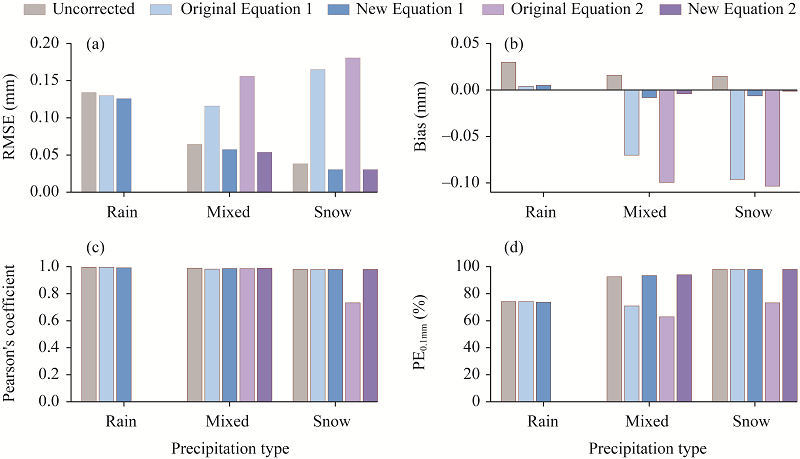
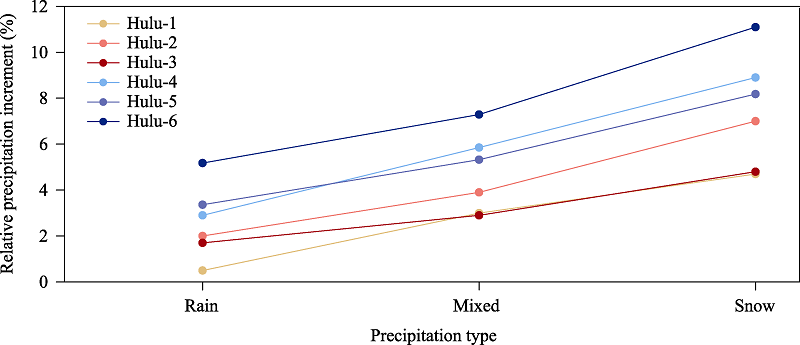
Abstract Precipitation is one of the most important indicators of climate data, but there are many errors in precipitation measurements due to the influence of climatic conditions, especially those of solid precipitation in alpine mountains and at high latitude areas. The measured amount of precipitation in those areas is frequently less than the actual amount of precipitation. To understand the impact of climatic conditions on precipitation measurements in the mountainous areas of Northwest China and the applicability of different gauges in alpine mountains, we established a cryospheric hydrometeorology observation (CHOICE) system in 2008 in the Qilian Mountains, which consists of six automated observation stations located between 2960 and 4800 m a.s.l. Total Rain weighing Sensor (TRwS) gauges tested in the World Meteorological Organization-Solid Precipitation Intercomparison Experiment (WMO-SPICE) were used at observation stations with the CHOICE system. To study the influence of climatic conditions on different types of precipitation measured by the TRwS gauges, we conducted an intercomparison experiment of precipitation at Hulu-1 station that was one of the stations in the CHOICE system. Moreover, we tested the application of transfer functions recommended by the WMO-SPICE at this station using the measurement data from a TRwS gauge from August 2016 to December 2020 and computed new coefficients for the same transfer functions that were more appropriate for the dataset from Hulu-1 station. The new coefficients were used to correct the precipitation measurements of other stations in the CHOICE system. Results showed that the new parameters fitted to the local dataset had better correction results than the original parameters. The environmental conditions of Hulu-1 station were very different from those of observation stations that provided datasets to create the transfer functions. Thus, root-mean-square error (RMSE) of solid and mixed precipitation corrected by the original parameters increased significantly by the averages of 0.135 (353%) and 0.072 mm (111%), respectively. RMSE values of liquid, solid and mixed precipitation measurements corrected by the new parameters decreased by 6%, 20% and 13%, respectively. In addition, the new parameters were suitable for correcting precipitation at other five stations in the CHOICE system. The relative precipitation (RP) increment of different types of precipitation increased with rising altitude. The average RP increment value of snowfall at six stations was the highest, reaching 7%, while that of rainfall was the lowest, covering 3%. Our results confirmed that the new parameters could be used to correct precipitation measurements of the CHOICE system.
|
|
Received: 14 November 2021
Published: 31 March 2022
|
|
Corresponding Authors:
*CHEN Rensheng (E-mail: crs2008@lzb.ac.cn)
|
|
|
| [1] |
Barnett T P, Adam J C, Lettenmaier D P. 2005. Potential impacts of a warming climate on water availability in snow-dominated regions. Nature, 438: 303-309.
doi: 10.1038/nature04141
|
|
|
| [2] |
Buisán S T, Smith C D, Ross A, et al. 2020. The potential for uncertainty in Numerical Weather Prediction model verification when using solid precipitation observations. Atmospheric Science Letters, 21(7): e976, doi: 10.1002/asl.976.
|
|
|
| [3] |
Cai Z, Liu J, Li X, et al. 2019. CFD simulation of wind field impact on gauge precipitation. Advances in Science and Technology of Water Resources, 39(6): 17-23. (in Chinese)
|
|
|
| [4] |
Chen R, Song Y, Kang E, et al. 2014. A cryosphere-hydrology observation system in a small alpine watershed in the Qilian Mountains of China and its meteorological gradient. Arctic, Antarctic, and Alpine Research, 46(2): 505-523.
doi: 10.1657/1938-4246-46.2.505
|
|
|
| [5] |
Chen R, Liu J, Kang E, et al. 2015. Precipitation measurement intercomparison in the Qilian Mountains, north-eastern Tibetan Plateau. The Cryosphere, 9: 2201-2230.
doi: 10.5194/tc-9-2201-2015
|
|
|
| [6] |
Christensen J H, Boberg F, Christensen O B, et al. 2008. On the need for bias correction of regional climate change projections of temperature and precipitation. Geophysical Research Letters, 35(20): 1-6.
|
|
|
| [7] |
CMA (China Meteorological Administration). 2007. Observation of Weather Phenomenon. Specifications for Surface Meteorological Observation (QX/T 48-2007). Beijing: China Meteorological Press, 2. (in Chinese)
|
|
|
| [8] |
Ding Y J, Zhang S Q, Chen R S, et al. 2020. Hydrological basis and discipline system of cryohydrology: From a perspective of cryospheric science. Frontiers in Earth Science, 8: 1-12.
doi: 10.3389/feart.2020.00001
|
|
|
| [9] |
Duchon C E, Essenberg G R. 2001. Comparative rainfall observations from pit and aboveground rain gauges with and without wind shields. Water Resource Research, 37(12): 3253-3263.
doi: 10.1029/2001WR000541
|
|
|
| [10] |
Goodison B. 1978. Accuracy of Canadian snow gage measurements. Journal of Applied Meteorology, 17: 1542-1548.
doi: 10.1175/1520-0450(1978)017<1542:AOCSGM>2.0.CO;2
|
|
|
| [11] |
Goodison B E, Ferguson H L, McKay G A. 1981. Comparison of point snowfall measurement techniques. In: Gray D M, Male M D. Handbook of Snow. Canada: Pergamon Press, 200-210.
|
|
|
| [12] |
Goodison B, Louie B, Yang D. 1998. The WMO Solid Precipitation Measurement Intercomparison. Geneva: World Meteorological Organization Publications, 1-6.
|
|
|
| [13] |
Han C, Chen R, Liu Z, et al. 2018. Cryospheric hydrometeorology observation in the Hulu catchment (CHOICE), Qilian Mountains, China. Vadose Zone Journal, 17(1): 1-18.
|
|
|
| [14] |
Kochendorfer J, Rasmussen R, Wolff M, et al. 2017a. The quantification and correction of wind-induced precipitation measurement errors. Hydrology and Earth System Science, 21: 1973-1989.
doi: 10.5194/hess-21-1973-2017
|
|
|
| [15] |
Kochendorfer J, Nitu R, Wolff M, et al. 2017b. Analysis of single-Alter-shielded and unshielded measurements of mixed and solid precipitation from WMO-SPICE. Hydrology and Earth System Science, 21: 3525-3542.
doi: 10.5194/hess-21-3525-2017
|
|
|
| [16] |
Kochendorfer J, Nitu R, Wolff M, et al. 2018. Testing and development of transfer functions for weighing precipitation gauges in WMO-SPICE. Hydrology and Earth System Science, 22: 1437-1452.
doi: 10.5194/hess-22-1437-2018
|
|
|
| [17] |
Kochendorfer J, Earle M, Rasmussen R, et al. 2021. How well are we measuring snow post-SPICE?. Bulletin of the American Meteorological Society, 102: 1-49.
|
|
|
| [18] |
Liu J, Chen R. 2016. Discriminating types of precipitation in Qilian Mountains, Tibetan Plateau. Journal of Hydrology: Regional Studies, 5: 20-32.
doi: 10.1016/j.ejrh.2015.11.013
|
|
|
| [19] |
Nalder I A, Wein R W. 1998. Spatial interpolation of climatic normals: Test of a new method in the Canadian boreal forest. Agricultural and Forest Meteorology, 92(4): 211-225.
doi: 10.1016/S0168-1923(98)00102-6
|
|
|
| [20] |
Nitu R, Wong K. 2010. CIMO Survey on National Summaries of Methods and Instruments for Solid Precipitation Measurement at Automatic Weather Stations. Geneva: World Meteorological Organization Publications, 6-22.
|
|
|
| [21] |
Nitu R, Rasmussen R, Baker B, et al. 2012. WMO intercomparison of instruments and methods for the measurement of solid precipitation and snow on the ground: Organization of the experiment. In: WMO Technical Conference on Meteorological and Environmental Instruments and Methods of Observation. Belgium: World Meteorological Organization. [2021-10-18]. https://library.wmo.int/pmb_ged/iom_109_en/Session1/O1_01_Nitu_SPICE.pdf
|
|
|
| [22] |
Nitu R, Roulet Y A, Wolff M, et al. 2018. WMO Solid Precipitation Intercomparison Experiment (SPICE) (2012-2015)(IOM Report No. 131). Geneva, Switzerland: World Meteorological Organization Publications, 30.
|
|
|
| [23] |
Rasmussen R, Baker B, Kochendorfer J, et al. 2012. How well are we measuring snow: The NOAA/FAA/NCAR winter precipitation test bed. Bulletin of the American Meteorological Society, 93(6): 811-829.
doi: 10.1175/BAMS-D-11-00052.1
|
|
|
| [24] |
Reverdin A, Earle M, Gaydos A, et al. 2016. Description of the quality control and event selection procedures used within the WMO-SPICE project. In: WMO Technical Conference on Meteorological and Environmental Instruments and Methods of Observation. Madrid: World Meteorological Organization,
|
|
|
| [25] |
Sevruk B, Klemm S. 1989. Catalogue of National Standard Precipitation Gauges. Geneva: World Meteorological Organization Publications, 12-17.
|
|
|
| [26] |
Sevruk B, Hertig J A, Spiess R. 1991. The effect of a precipitation gauge orifice rim on the wind field deformation as investigated in a wind tunnel. Atmospheric Environment, 25: 1173-1179.
|
|
|
| [27] |
Sevruk B, Nespor V. 1994. The effect of dimensions and shape of precipitation gauges on the wind-induced error. Series I: Global Environmental Change, 26: 231-246.
|
|
|
| [28] |
Sevruk B, Ondrás M, Chvíla B. 2009. The WMO precipitation measurement intercomparisons. Atmospheric Environment, 92(3): 376-380.
doi: 10.1016/j.atmosenv.2014.04.049
|
|
|
| [29] |
Sheffield J, Ziegler A D, Wood E F. 2004. Correction of the high-latitude rain day anomaly in the NCEP-NCAR reanalysis for land surface hydrological modeling. Journal of Climate, 17(19): 3814-3828.
doi: 10.1175/1520-0442(2004)017<3814:COTHRD>2.0.CO;2
|
|
|
| [30] |
Smith C, Ross A, Kochendorfer J, et al. 2020. Evaluation of the WMO Solid Precipitation Intercomparison Experiment (SPICE) transfer functions for adjusting the wind bias in solid precipitation measurements. Hydrology and Earth System Science, 24(8): 4025-4043.
doi: 10.5194/hess-24-4025-2020
|
|
|
| [31] |
Theriault J M, Rasmussen R, Ikeda K, et al. 2012. Dependence of snow gauge collection efficiency on snowflake characteristics. Journal of Applied Meteorology and Climatology, 51(4): 745-762.
doi: 10.1175/JAMC-D-11-0116.1
|
|
|
| [32] |
Wang S, Hui J, Zhang G, et al. 2017. Study on precipitation grades standard of short-term now casting meteorological service, the 34th Annual Meeting of China Meteorological Society. In: Proceedings of the 7th Meteorological Service Development Forum. Beijing: China Meteorological Society, (in Chinese)
|
|
|
| [33] |
Wolff M A, Isaksen K, Petersen-Overleir A, et al. 2015. Derivation of a new continuous adjustment function for correcting wind-induced loss of solid precipitation: results of a Norwegian field study. Hydrology and Earth System Science, 19: 951-967.
doi: 10.5194/hess-19-951-2015
|
|
|
| [34] |
Yang D. 1988. Research on analysis and correction of systematic errors in precipitation measurement in Urumqi River basin, Tianshan. PhD Dissertation. Lanzhou: Institute of Glaciology and Geocryology, Chinese Academy of Sciences,
|
|
|
| [35] |
Yang D, Shi Y, Kang E, et al. 1991. Results of solid precipitation measurement intercomparison in the Alpine area of Urumqi River basin. Chinese Science Bulletin, 36(13): 1105-1109.
|
|
|
| [36] |
Yang D, Goodison B, Metcalfe J, et al. 1995. Accuracy of Tretyakov precipitation gauge: Results of WMO intercomparison. Hydrological Processes, 9(8): 877-895.
doi: 10.1002/(ISSN)1099-1085
|
|
|
| [37] |
Yang D, Goodison B E, Metcalfe J R, et al. 1998. Accuracy of NWS 8 standard nonrecording precipitation gauge: Results and application of WMO intercomparison. Journal of Atmospheric and Oceanic Technology, 15(1): 54-68.
doi: 10.1175/1520-0426(1998)015<0054:AONSNP>2.0.CO;2
|
|
|
| [38] |
Yang D, Goodison B, Metcalfe J, et al. 1999. Quantification of precipitation measurement discontinuity induced by wind shields on national gauges. Water Resources Research, 35(2): 491-508.
doi: 10.1029/1998WR900042
|
|
|
| [39] |
Zhao Y, Chen R, Han C, et al. 2021. Correcting precipitation measurements made with Geonor T-200B weighing gauges near the august-one ice cap in the Qilian Mountains, Northwest China. Journal of Hydrometeorology, 22(8): 1973-1985.
|
|
|
| [40] |
Zheng Q, Chen R, Han C, et al. 2018. Adjusting precipitation measurements from the TRwS204 automatic weighing gauge in the Qilian Mountains, China. Journal of Mountain Science, 15: 2492-2504.
doi: 10.1007/s11629-018-4931-4
|
|
|
|
Viewed |
|
|
|
Full text
|
|
|
|
|
Abstract
|
|
|
|
|
Cited |
|
|
|
|
| |
Shared |
|
|
|
|
| |
Discussed |
|
|
|
|