| Research article |
|


|
|
|
| Predicting changes in the suitable habitats of six halophytic plant species in the arid areas of Northwest China |
YANG Ao1,2,3,4, TU Wenqin5, YIN Benfeng2,3,4, ZHANG Shujun2,3,4,6, ZHANG Xinyu7, ZHANG Qing2,3,4,8, HUANG Yunjie2,3,4,6, HAN Zhili2,3,4,9, YANG Ziyue1,2,3,10, ZHOU Xiaobing2,3,4, ZHUANG Weiwei1,*( ), ZHANG Yuanming2,3,4 ), ZHANG Yuanming2,3,4 |
1College of Life Sciences, Xinjiang Normal University/Xinjiang Key Laboratory of Special Species Conservation and Regulatory Biology/Key Laboratory of Special Environment Biodiversity Application and Regulation in Xinjiang/Key Laboratory of Plant Stress Biology in Arid Land, Urumqi 830054, China
2State Key Laboratory of Desert and Oasis Ecology, Key Laboratory of Ecological Safety and Sustainable Development in Arid Lands, Xinjiang Institute of Ecology and Geography, Chinese Academy of Sciences, Urumqi 830011, China
3Xinjiang Key Laboratory of Biodiversity Conservation and Application in Arid Lands, Xinjiang Institute of Ecology and Geography, Chinese Academy of Sciences, Urumqi 830011, China
4Xinjiang Field Scientific Observation Research Station of Tianshan Wild Fruit Forest Ecosystem, Yili Botanical Garden, Xinjiang Institute of Ecology and Geography, Chinese Academy of Sciences, Xinyuan 835800, China
5State Key Laboratory of Earth Surface Processes and Resource Ecology, College of Life Sciences, Beijing Normal University, Beijing 100875, China
6University of Chinese Academy of Sciences, Beijing 100049, China
7College of Biological Sciences, University of California Davis, Davis, CA 95616, USA
8College of Ecology and Environment, Xinjiang University, Urumqi 830017, China
9College of Resources and Environment/Xinjiang Key Laboratory of Soil and Plant Ecological Processes, Xinjiang Agricultural University, Urumqi 830052, China
10College of Grassland Science, Xinjiang Agricultural University, Urumqi 830052, China |
|
|
|
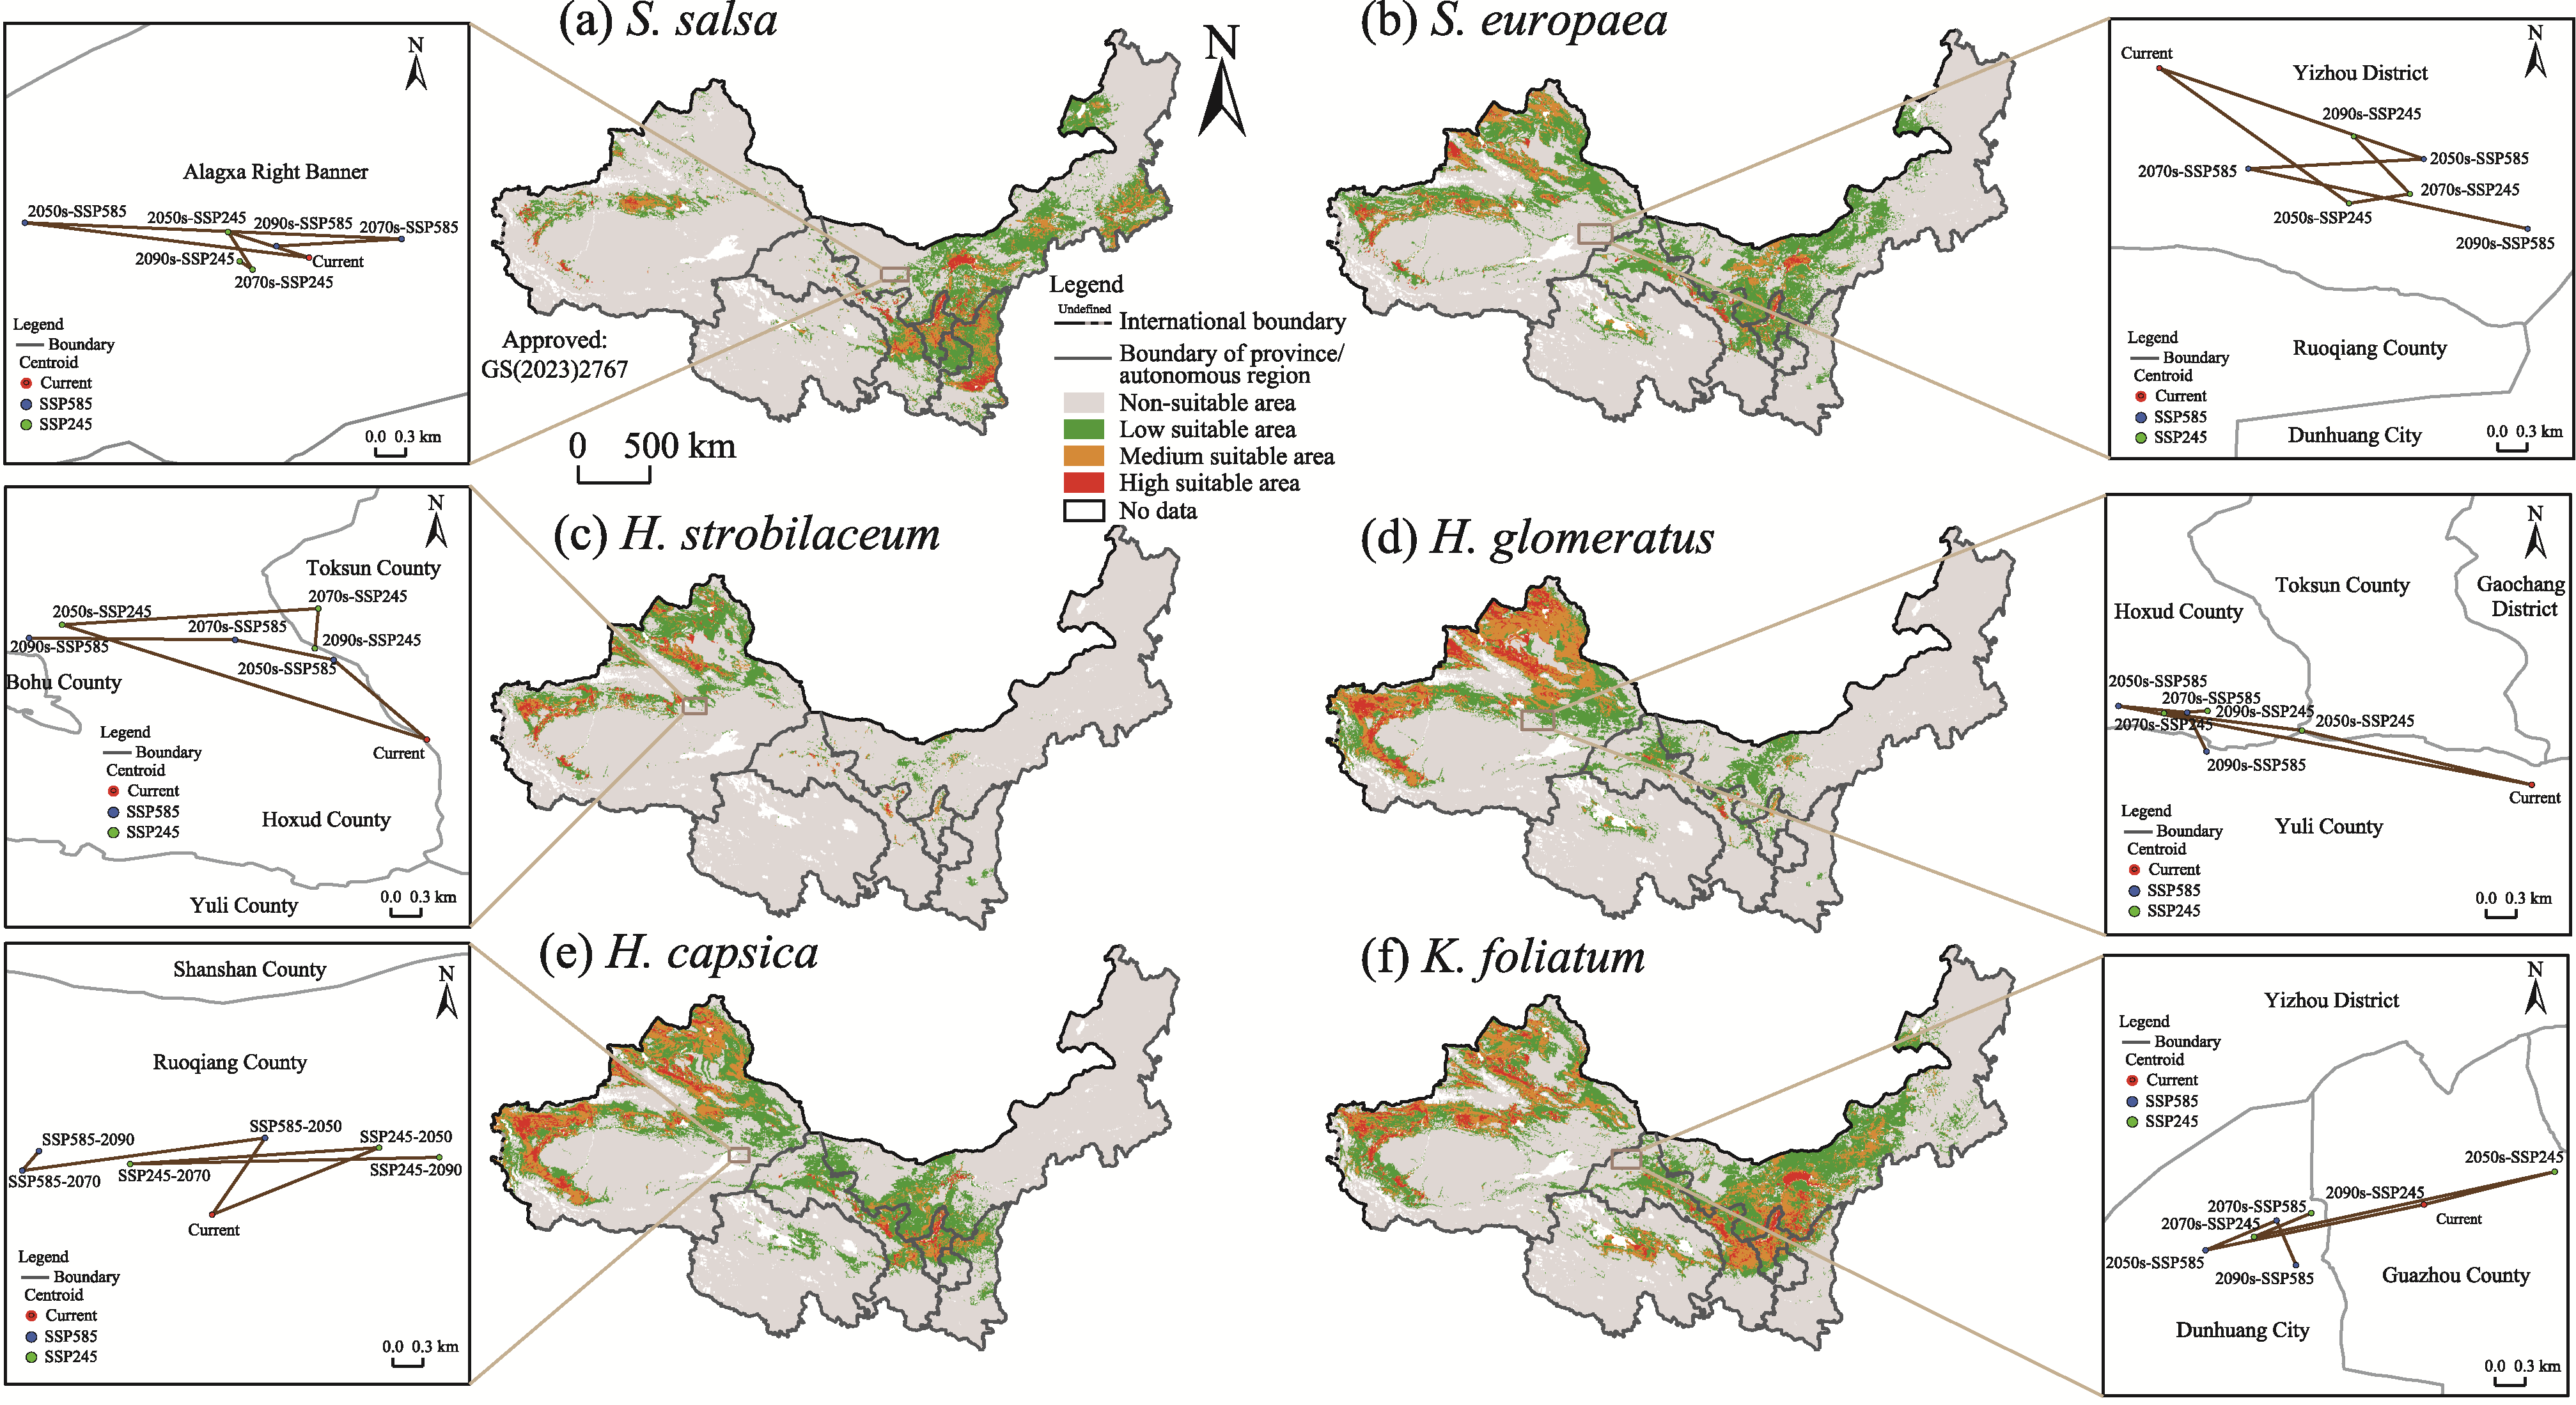
Abstract In the context of changes in global climate and land uses, biodiversity patterns and plant species distributions have been significantly affected. Soil salinization is a growing problem, particularly in the arid areas of Northwest China. Halophytes are ideal for restoring soil salinization because of their adaptability to salt stress. In this study, we collected the current and future bioclimatic data released by the WorldClim database, along with soil data from the Harmonized World Soil Database (v1.2) and A Big Earth Data Platform for Three Poles. Using the maximum entropy (MaxEnt) model, the potential suitable habitats of six halophytic plant species (Halostachys caspica (Bieb.) C. A. Mey., Halogeton glomeratus (Bieb.) C. A. Mey., Kalidium foliatum (Pall.) Moq., Halocnemum strobilaceum (Pall.) Bieb., Salicornia europaea L., and Suaeda salsa (L.) Pall.) were assessed under the current climate conditions (average for 1970-2000) and future (2050s, 2070s, and 2090s) climate scenarios (SSP245 and SSP585, where SSP is the Shared Socio-economic Pathway). The results revealed that all six halophytic plant species exhibited the area under the receiver operating characteristic curve values higher than 0.80 based on the MaxEnt model, indicating the excellent performance of the MaxEnt model. The suitability of the six halophytic plant species significantly varied across regions in the arid areas of Northwest China. Under different future climate change scenarios, the suitable habitat areas for the six halophytic plant species are expected to increase or decrease to varying degrees. As global warming progresses, the suitable habitat areas of K. foliatum, S. salsa, and H. strobilaceum exhibited an increasing trend. In contrast, the suitable habitat areas of H. glomeratus, S. europaea, and H. caspica showed an opposite trend. Furthermore, considering the ongoing global warming trend, the centroids of the suitable habitat areas for various halophytic plant species would migrate to different degrees, and four halophytic plant species, namely, S. salsa, H. strobilaceum, H. glomeratus, and H. capsica, would migrate to higher latitudes. Temperature, precipitation, and soil factors affected the possible distribution ranges of these six halophytic plant species. Among them, precipitation seasonality (coefficient of variation), precipitation of the warmest quarter, mean temperature of the warmest quarter, and exchangeable Na+ significantly affected the distribution of halophytic plant species. Our findings are critical to comprehending and predicting the impact of climate change on ecosystems. The findings of this study hold significant theoretical and practical implications for the management of soil salinization and for the utilization, protection, and management of halophytes in the arid areas of Northwest China.
|
|
Received: 18 March 2024
Published: 31 October 2024
|
|
Corresponding Authors:
* ZHUANG Weiwei (E-mail: zww8611@sina.com)
|
| About author: First author contact: The first, second, and third authors contributed equally to this work. |
| Cite this article:
YANG Ao, TU Wenqin, YIN Benfeng, ZHANG Shujun, ZHANG Xinyu, ZHANG Qing, HUANG Yunjie, HAN Zhili, YANG Ziyue, ZHOU Xiaobing, ZHUANG Weiwei, ZHANG Yuanming. Predicting changes in the suitable habitats of six halophytic plant species in the arid areas of Northwest China. Journal of Arid Land, 2024, 16(10): 1380-1408.
URL:
http://jal.xjegi.com/10.1007/s40333-024-0062-7 OR http://jal.xjegi.com/Y2024/V16/I10/1380
|
|
|
| [1] |
Abolmaali S M R, Torkesh Esfahani M, Boshri H. 2017. Assessing impacts of climate change on endangered Kelossia odoratissima Mozaff species distribution using Generalized Additive Model. Journal of Natural Environment, 70(2): 243-254.
|
|
|
| [2] |
Ahanger M A, Aziz U, Alsahli A A, et al. 2020. Influence of exogenous salicylic acid and nitric oxide on growth, photosynthesis, and ascorbate-glutathione cycle in salt stressed Vigna angularis. Biomolecules, 10(1): 42, doi: 10.3390/biom10010042.
|
|
|
| [3] |
Ahmadi F, Mohammadkhani N, Servati M. 2022. Halophytes play important role in phytoremediation of salt-affected soils in the bed of Urmia Lake, Iran. Scientific Reports, 12(1): 12223, doi: 10.1038/s41598-022-16266-4.
pmid: 35851138
|
|
|
| [4] |
An Y, Gao Y, Zhang Y, et al. 2019. Early establishment of Suaeda salsa population as affected by soil moisture and salinity: Implications for pioneer species introduction in saline-sodic wetlands in Songnen Plain, China. Ecological Indicators, 107: 105654, doi: 10.1016/j.ecolind.2019.105654.
|
|
|
| [5] |
Ardestani E G, Tarkesh M, Bassiri M, et al. 2015. Potential habitat modeling for reintroduction of three native plant species in central Iran. Journal of Arid Land, 7(3): 381-390.
doi: 10.1007/s40333-014-0050-4
|
|
|
| [6] |
Barbet-Massin M, Thuiller W, Jiguet F. 2012. The fate of European breeding birds under climate, land-use and dispersal scenarios. Global Change Biology, 18(3): 881-890.
|
|
|
| [7] |
Beaumont L J, Hughes L, Poulsen M. 2005. Predicting species distributions: use of climatic parameters in BIOCLIM and its impact on predictions of species' current and future distributions. Ecological Modelling, 186(2): 251-270.
|
|
|
| [8] |
Bezeng B S, Morales-Castilla I, van der Bank M, et al. 2017. Climate change may reduce the spread of non-native species. Ecosphere, 8(3): e01694, doi: 10.1002/ecs2.1694.
|
|
|
| [9] |
Brown J L. 2014. SDMtoolbox: a python-based GIS toolkit for landscape genetic, biogeographic and species distribution model analyses. Methods in Ecology and Evolution, 5(7): 694-700.
|
|
|
| [10] |
Cao B, Bai C K, Zhang L L, et al. 2016. Modeling habitat distribution of Cornus officinalis with Maxent modeling and fuzzy logics in China. Journal of Plant Ecology, 9(6): 742-751.
doi: 10.1093/jpe/rtw009
|
|
|
| [11] |
Cao C C, Su F L, Song F, et al. 2022. Distribution and disturbance dynamics of habitats suitable for Suaeda salsa. Ecological Indicators, 140: 108984, doi: 10.1016/j.ecolind.2022.108984.
|
|
|
| [12] |
Ceballos G, Ehrlich P R, Barnosky A D, et al. 2015. Accelerated modern human-induced species losses: Entering the sixth mass extinction. Science Advances, 1(5): e1400253, doi: 10.1126/sciadv.1400253.
|
|
|
| [13] |
Chen I C, Hill J K, Ohlemüller R, et al. 2011. Rapid range shifts of species associated with high levels of climate warming. Science, 333(6045): 1024-1026.
doi: 10.1126/science.1206432
pmid: 21852500
|
|
|
| [14] |
Chen Q H, Yin Y J, Zhao R, et al. 2019. Incorporating local adaptation into species distribution modeling of Paeonia mairei, an endemic plant to China. Frontiers in Plant Science, 10: 1717, doi: 10.3389/fpls.2019.01717.
|
|
|
| [15] |
Collen B, Dulvy N K, Gaston K J, et al. 2016. Clarifying misconceptions of extinction risk assessment with the IUCN Red List. Biology Letters, 12(4): 20150843, doi: 10.1098/rsbl.2015.0843.
|
|
|
| [16] |
Cong M Y, Xu Y Y, Tang L Y, et al. 2020. Predicting the dynamic distribution of Sphagnum bogs in China under climate change since the last interglacial period. PLoS ONE, 15(4): e0230969, doi: 10.1371/journal.pone.0230969.
|
|
|
| [17] |
Corlett R T, Westcott D A. 2013. Will plant movements keep up with climate change? Trends in Ecology & Evolution, 28(8): 482-488.
|
|
|
| [18] |
Cutler D R, Edwards T C, Beard K H, et al. 2007. Random forests for classification in ecology. Ecology, 88(11): 2783-2792.
doi: 10.1890/07-0539.1
pmid: 18051647
|
|
|
| [19] |
Elith J, Graham C H, Anderson R P, et al. 2006. Novel methods improve prediction of species' distributions from occurrence data. Ecography, 29(2): 129-151.
|
|
|
| [20] |
Elith J, Leathwick J R, Hastie T. 2008. A working guide to boosted regression trees. Journal of Animal Ecology, 77(4): 802-813.
doi: 10.1111/j.1365-2656.2008.01390.x
pmid: 18397250
|
|
|
| [21] |
Elith J, Leathwick J R. 2009. Species distribution models: ecological explanation and prediction across space and time. Annual Review of Ecology, Evolution, and Systematics, 40(1): 677-697.
|
|
|
| [22] |
Elith J, Phillips S J, Hastie T, et al. 2011. A statistical explanation of MaxEnt for ecologists. Diversity and Distributions, 17(1): 43-57.
|
|
|
| [23] |
Eswar D, Karuppusamy R, Chellamuthu S. 2021. Drivers of soil salinity and their correlation with climate change. Current Opinion in Environmental Sustainability, 50: 310-318.
|
|
|
| [24] |
Fang X M, Wang Q L, Zhou W M, et al. 2014. Land use effects on soil organic carbon, microbial biomass and microbial activity in Changbai Mountains of Northeast China. Chinese Geographical Science, 24(3): 297-306.
|
|
|
| [25] |
Fang Y Q, Zhang X H, Wei H Y, et al. 2021. Predicting the invasive trend of exotic plants in China based on the ensemble model under climate change: A case for three invasive plants of Asteraceae. Science of the Total Environment, 756: 143841, doi: 10.1016/j.scitotenv.2020.143841.
|
|
|
| [26] |
FAO Food Agriculture Organization. 2012. Harmonized World Soil Database (version 1.2). FAO, Rome, Italy and IIASA, Laxenburg, Austria. [2023-11-20]. http://webarchive.iiasa.ac.at/Research/LUC/External-World-soil-database/HTML/.
|
|
|
| [27] |
Feeley K J, Bravo-Avila C, Fadrique B, et al. 2020. Climate-driven changes in the composition of New World plant communities. Nature Climate Change, 10(10): 965-970.
|
|
|
| [28] |
Feng X, Park D S, Liang Y, et al. 2019. Collinearity in ecological niche modeling: Confusions and challenges. Ecology and Evolution, 9(18): 10365-10376.
doi: 10.1002/ece3.5555
|
|
|
| [29] |
Flowers T J, Colmer T D. 2008. Salinity tolerance in halophytes. New Phytologist, 179(4): 945-963.
doi: 10.1111/j.1469-8137.2008.02531.x
pmid: 18565144
|
|
|
| [30] |
Flowers T J, Galal H k, Bromham L. 2010. Evolution of halophytes: multiple origins of salt tolerance in land plants. Functional Plant Biology, 37(7): 604-612.
|
|
|
| [31] |
Foden W, Midgley G F, Hughes G, et al. 2007. A changing climate is eroding the geographical range of the Namib Desert tree Aloe through population declines and dispersal lags. Diversity and Distributions, 13(5): 645-653.
|
|
|
| [32] |
Foden W B, Young B E, Akçakaya H R, et al. 2019. Climate change vulnerability assessment of species. WIREs Climate Change, 10(1): e551, doi: 10.1002/wcc.551.
|
|
|
| [33] |
Fourcade Y, Besnard A G, Secondi J. 2018. Paintings predict the distribution of species, or the challenge of selecting environmental predictors and evaluation statistics. Global Ecology and Biogeography, 27(2): 245-256.
|
|
|
| [34] |
Gedan K B, Bertness M D. 2009. Experimental warming causes rapid loss of plant diversity in New England salt marshes. Ecology Letters, 12(8): 842-848.
doi: 10.1111/j.1461-0248.2009.01337.x
pmid: 19566785
|
|
|
| [35] |
Gessner U, Naeimi V, Klein I, et al. 2013. The relationship between precipitation anomalies and satellite-derived vegetation activity in Central Asia. Global and Planetary Change, 110: 74-87.
|
|
|
| [36] |
Gogol-Prokurat M. 2011. Predicting habitat suitability for rare plants at local spatial scales using a species distribution model. Ecological Applications, 21(1): 33-47.
doi: 10.1890/09-1190.1
pmid: 21516886
|
|
|
| [37] |
Grant P R, Grant B R. 2002. Unpredictable evolution in a 30-year study of Darwin's finches. Science, 296(5568): 707-711.
pmid: 11976447
|
|
|
| [38] |
Guo J R, Shan C D, Zhang Y F, et al. 2022. Mechanisms of salt tolerance and molecular breeding of salt-tolerant ornamental plants. Frontiers in Plant Science, 13: 854116, doi: 10.3389/fpls.2022.854116.
|
|
|
| [39] |
Hamani A K M, Wang G S, Soothar M K, et al. 2020. Responses of leaf gas exchange attributes, photosynthetic pigments and antioxidant enzymes in NaCl-stressed cotton (Gossypium hirsutum L.) seedlings to exogenous glycine betaine and salicylic acid. BMC Plant Biology, 20(1): 434, doi: 10.1186/s12870-020-02624-9.
|
|
|
| [40] |
Hammer E C, Nasr H, Wallander H. 2011. Effects of different organic materials and mineral nutrients on arbuscular mycorrhizal fungal growth in a Mediterranean saline dryland. Soil Biology and Biochemistry, 43(11): 2332-2337.
|
|
|
| [41] |
Han L P, Liu H T, Yu S H, et al. 2013. Potential application of oat for phytoremediation of salt ions in coastal saline-alkali soil. Ecological Engineering, 61: 274-281.
|
|
|
| [42] |
Hasanuzzaman M, Nahar K, Alam M M, et al. 2014. Potential use of halophytes to remediate saline soils. BioMed Research International, 2014: 589341, doi: 10.1155/2014/589341.
|
|
|
| [43] |
Hassani A, Azapagic A, Shokri N. 2021. Global predictions of primary soil salinization under changing climate in the 21st century. Nature communications, 12(1): 6663, doi: 10.1038/s41467-021-26907-3.
|
|
|
| [44] |
Hautier Y, Tilman D, Isbell F, et al. 2015. Anthropogenic environmental changes affect ecosystem stability via biodiversity. Science, 348(6232): 336-340.
doi: 10.1126/science.aaa1788
pmid: 25883357
|
|
|
| [45] |
Hernandez P A, Graham C H, Master L L, et al. 2006. The effect of sample size and species characteristics on performance of different species distribution modeling methods. Ecography, 29(5): 773-785.
|
|
|
| [46] |
Hirzel A H, Hausser J, Chessel D. 2002. Ecological-niche factor analysis: how to compute habitat-suitability maps without absence data? Ecology, 83(7): 2027-2036.
|
|
|
| [47] |
Hopmans J W, Qureshi A S, Kisekka I, et al. 2021. Critical knowledge gaps and research priorities in global soil salinity. Advances in Agronomy, 169: 1-191.
|
|
|
| [48] |
Hu X G, Jin Y Q, Wang X R, et al. 2015. Predicting impacts of future climate change on the distribution of the widespread conifer Platycladus orientalis. PLoS ONE, 10(7): e0132326, doi: 10.1371/journal.pone.0132326.
|
|
|
| [49] |
Huang Z B, Xie L N, Wang H W, et al. 2019. Geographic distribution and impacts of climate change on the suitable habitats of Zingiber species in China. Industrial Crops and Products, 138: 111429, doi: 10.1016/j.indcrop.2019.05.078.
|
|
|
| [50] |
IPBES Intergovernmental Science-Policy Platform on Biodiversity and Ecosystem Services. 2019. Global Assessment Report on Biodiversity and Ecosystem Services of the Intergovernmental Science-Policy Platform on Biodiversity and Ecosystem Services. In: Brondizio E S, Settele J, Díaz S, et al. Bonn: IPBES Secretariat, 1-1148.
|
|
|
| [51] |
Jesus J M, Danko A S, Fiúza A, et al. 2015. Phytoremediation of salt-affected soils: a review of processes, applicability, and the impact of climate change. Environmental Science and Pollution Research International, 22(9): 6511-6525.
doi: 10.1007/s11356-015-4205-4
pmid: 25854203
|
|
|
| [52] |
Ju F Y, Pang J L, Sun L Y, et al. 2023. Integrative transcriptomic, metabolomic and physiological analyses revealed the physiological and molecular mechanisms by which potassium regulates the salt tolerance of cotton (Gossypium hirsutum L.) roots. Industrial Crops and Products, 193: 116177, doi: 10.1016/j.indcrop.2022.116177.
|
|
|
| [53] |
Khajoei Nasab F, Mehrabian A, Mostafavi H. 2020. Mapping the current and future distributions of Onosma species endemic to Iran. Journal of Arid Land, 12(6): 1031-1045.
|
|
|
| [54] |
Khan W D, Tanveer M, Shaukat R, et al. 2020. An overview of salinity tolerance mechanism in plants. In: Hasanuzzaman M, Tanveer M. Salt and Drought Stress Tolerance in Plants: Signaling Networks and Adaptive Mechanisms. Cham: Springer International Publishing, 1-16.
|
|
|
| [55] |
Klein J A, Harte J, Zhao X Q. 2004. Experimental warming causes large and rapid species loss, dampened by simulated grazing, on the Tibetan Plateau. Ecology Letters, 7(12): 1170-1179.
|
|
|
| [56] |
Korell L, Auge H, Chase J M, et al. 2021. Responses of plant diversity to precipitation change are strongest at local spatial scales and in drylands. Nature Communications, 12(1): 2489, doi: 10.1038/s41467-021-22766-0.
pmid: 33941779
|
|
|
| [57] |
Kramer-Schadt S, Niedballa J, Pilgrim J D, et al. 2013. The importance of correcting for sampling bias in MaxEnt species distribution models. Diversity and Distributions, 19(11): 1366-1379.
|
|
|
| [58] |
Lehikoinen A, Virkkala R. 2016. North by north-west: climate change and directions of density shifts in birds. Global Change Biology, 22(3): 1121-1129.
doi: 10.1111/gcb.13150
pmid: 26691578
|
|
|
| [59] |
Li B, Wang Z C, Sun Z G, et al. 2005. Resources and sustainable resource exploitation of salinized land in China. Agricultural Research in the Arid Areas, 23(2): 154-158. (in Chinese)
|
|
|
| [60] |
Li J J, Fan G, He Y. 2020. Predicting the current and future distribution of three Coptis herbs in China under climate change conditions, using the MaxEnt model and chemical analysis. Science of the Total Environment, 698: 134141, doi: 10.1016/j.scitotenv.2019.134141.
|
|
|
| [61] |
Li L, Zhang B, Wen A M, et al. 2022. Predicting potential distribution of Stellera chamaejasme under global climate change in China. Applied Ecology and Environmental Research, 20(5): 3977-3993.
|
|
|
| [62] |
Li L P, Wang Z H, Zerbe S, et al. 2013. Species richness patterns and water-energy dynamics in the drylands of northwest China. PLoS ONE, 8(6): e66450, doi: 10.1371/journal.pone.0066450.
|
|
|
| [63] |
Liu J Y, Wan J L, Yin X J, et al. 2024. Progress and prospect of developing salt and alkali tolerant rice using hybrid rice technology in China. Plant Breeding, 143(1): 86-95.
|
|
|
| [64] |
Liu L, Bai X G, Jiang Z D. 2019. The generic technology identification of saline-alkali land management and improvement based on social network analysis. Cluster Computing, 22(6): 13167-13176.
|
|
|
| [65] |
Liu L, Guan L L, Zhao H X, et al. 2021. Modeling habitat suitability of Houttuynia cordata Thunb (Ceercao) using MaxEnt under climate change in China. Ecological Informatics, 63: 101324, doi: 10.1016/j.ecoinf.2021.101324.
|
|
|
| [66] |
Liu L L, Wang B S. 2021. Protection of halophytes and their uses for cultivation of saline-alkali soil in China. Biology, 10(5): 353, doi: 10.3390/biology10050353.
|
|
|
| [67] |
Liu W S, You J L, Ceng W B, et al. 2018. Prediction of the geographical distribution of Carex moorcroftii under global climate change based on MaxEnt model. Chinese Journal of Grassland, 40(5): 43-49. (in Chinese)
|
|
|
| [68] |
Llanes A, Palchetti M V, Vilo C, et al. 2021. Molecular control to salt tolerance mechanisms of woody plants: recent achievements and perspective. Annals of Forest Science, 78(96): 96, doi: 10.1007/s13595-021-01107-7.
|
|
|
| [69] |
Lososová Z, Tichý L, Divíšek J, et al. 2018. Projecting potential future shifts in species composition of European urban plant communities. Diversity and Distributions, 24(6): 765-775.
|
|
|
| [70] |
Lu Y, Zhang B, Li L, et al. 2021a. Negative effects of long-term exposure to salinity, drought, and combined stresses on halophyte Halogeton glomeratus. Physiologia Plantarum, 173(4): 2307-2322.
|
|
|
| [71] |
Lu Z Y, Zhai Y P, Meng D R, et al. 2021b. Predicting the potential distribution of wintering Asian Great Bustard (Otis tarda dybowskii) in China: Conservation implications. Global Ecology and Conservation, 31(3): e01817, doi: 10.1016/j.gecco.2021.e01817.
|
|
|
| [72] |
Lynn J, Peeva N. 2021. Communications in the IPCC's Sixth Assessment Report cycle. Climatic Change, 169(1-2): 18, doi: 10.1007/s10584-021-03233-7.
|
|
|
| [73] |
Ma B B, Sun J. 2018. Predicting the distribution of Stipa purpurea across the Tibetan Plateau via the MaxEnt model. BMC Ecology, 18(1): 10, doi: 10.1186/s12898-018-0165-0.
|
|
|
| [74] |
Ma L G, Yang S T, Simayi Z, et al. 2018. Modeling variations in soil salinity in the oasis of Junggar Basin, China. Land Degradation & Development, 29(3): 551-562.
|
|
|
| [75] |
Mamun M, Kim S, An K. 2018. Distribution pattern prediction of an invasive alien species largemouth bass using a maximum entropy model (MaxEnt) in the Korean peninsula. Journal of Asia-Pacific Biodiversity, 11(4): 516-524.
|
|
|
| [76] |
Mantyka-Pringle C S, Visconti P, Di Marco M, et al. 2015. Climate change modifies risk of global biodiversity loss due to land-cover change. Biological Conservation, 187: 103-111.
|
|
|
| [77] |
Mathias A, Chesson P. 2013. Coexistence and evolutionary dynamics mediated by seasonal environmental variation in annual plant communities. Theoretical Population Biology, 84: 56-71.
doi: 10.1016/j.tpb.2012.11.009
pmid: 23287702
|
|
|
| [78] |
Melo-Merino S M, Reyes-Bonilla H, Lira-Noriega A. 2020. Ecological niche models and species distribution models in marine environments: A literature review and spatial analysis of evidence. Ecological Modelling, 415: 108837, doi: 10.1016/j.ecolmodel.2019.108837.
|
|
|
| [79] |
Merow C, Smith M J, Silander J A. 2013. A practical guide to MaxEnt for modeling species' distributions: what it does, and why inputs and settings matter. Ecography, 36(10): 1058-1069.
|
|
|
| [80] |
Na X D, Zhou H T, Zang S Y, et al. 2018. Maximum entropy modeling for habitat suitability assessment of red-crowned crane. Ecological Indicators, 91: 439-446.
|
|
|
| [81] |
Nilhan T G, Emre Y A, Osman K. 2008. Soil determinants for distribution of Halocnemum strobilaceum Bieb. (Chenopodiaceae) around Lake Tuz, Turkey. Pakistan Journal of Biological Sciences, 11(4): 565-570.
|
|
|
| [82] |
Nouri H, Chavoshi Borujeni S, Nirola R, et al. 2017. Application of green remediation on soil salinity treatment: a review on halophytoremediation. Process Safety and Environmental Protection, 107: 94-107.
|
|
|
| [83] |
Pecl G T, Araújo M B, Bell J D, et al. 2017. Biodiversity redistribution under climate change: Impacts on ecosystems and human well-being. Science, 355(6332): eaai9214, doi: 10.1126/science.aai9214.
|
|
|
| [84] |
Petitpierre B, Mcdougall K, Seipel T, et al. 2016. Will climate change increase the risk of plant invasions into mountains? Ecological Applications, 26(2): 530-544.
pmid: 27209793
|
|
|
| [85] |
Phillips S J, Anderson R P, Schapire R E. 2006. Maximum entropy modeling of species geographic distributions. Ecological Modelling, 190(3): 231-259.
|
|
|
| [86] |
Phillips S J, Dudík M. 2008. Modeling of species distributions with Maxent: new extensions and a comprehensive evaluation. Ecography, 31(2): 161-175.
|
|
|
| [87] |
Phillips S J, Dudík M, Elith J, et al. 2009. Sample selection bias and presence-only distribution models: implications for background and pseudo-absence data. Ecological Applications, 19(1): 181-197.
doi: 10.1890/07-2153.1
pmid: 19323182
|
|
|
| [88] |
Pías B, Matesanz S, Herrero A, et al. 2010. Transgenerational effects of three global change drivers on an endemic mediterranean plant. Oikos, 119: 1435-1444.
|
|
|
| [89] |
Piedallu C, Gégout J, Bruand A, et al. 2011. Mapping soil water holding capacity over large areas to predict potential production of forest stands. Geoderma, 160(3-4): 355-366.
|
|
|
| [90] |
Pigot A L, Merow C, Wilson A, et al. 2023. Abrupt expansion of climate change risks for species globally. Nature Ecology & Evolution, 7(7): 1060-1071.
|
|
|
| [91] |
Pimm S L, Jenkins C N, Abell R, et al. 2014. The biodiversity of species and their rates of extinction, distribution, and protection. Science, 344(6187): 1246752, doi: 10.1126/science.1246752.
|
|
|
| [92] |
Poorter H. 2000. The role of biomass allocation in the growth response of plants to different levels of light, CO2, nutrients and water: A quantitative review. Australian Journal of Plant Physiology, 27: 595-607.
|
|
|
| [93] |
Popp A, Calvin K, Fujimori S, et al. 2017. Land-use futures in the shared socio-economic pathways. Global Environmental Change, 42: 331-345.
|
|
|
| [94] |
Qin A L, Liu B, Guo Q S, et al. 2017. Maxent modeling for predicting impacts of climate change on the potential distribution of Thuja sutchuenensis Franch., an extremely endangered conifer from southwestern China. Global Ecology and Conservation, 10: 139-146.
|
|
|
| [95] |
Qiu Y, Hu Q, Zhang C. 2017. WRF simulation and downscaling of local climate in central Asia. International Journal of Climatology, 37(S1): 513-528.
|
|
|
| [96] |
Qu X X, Huang Z Y, Baskin J M, et al. 2008. Effect of temperature, light and salinity on seed germination and radicle growth of the geographically widespread halophyte shrub Halocnemum strobilaceum. Annals of Botany, 101(2): 293-299.
|
|
|
| [97] |
Quevedo-Robledo L, Pucheta E, Ribas-Fernández Y. 2010. Influences of interyear rainfall variability and microhabitat on the germinable seed bank of annual plants in a sandy Monte Desert. Journal of Arid Environments, 74(2): 167-172.
|
|
|
| [98] |
Rabhi M, Hafsi C, Lakhdar A, et al. 2009. Evaluation of the capacity of three halophytes to desalinize their rhizosphere as grown on saline soils under nonleaching conditions. African Journal of Ecology, 47(4): 463-468.
|
|
|
| [99] |
Richman S K, Levine J M, Stefan L, et al. 2020. Asynchronous range shifts drive alpine plant-pollinator interactions and reduce plant fitness. Global Change Biology, 26(5): 3052-3064.
doi: 10.1111/gcb.15041
pmid: 32061109
|
|
|
| [100] |
Rocca F D, Milanesi P. 2020. Combining climate, land use change and dispersal to predict the distribution of endangered species with limited vagility. Journal of Biogeography, 47(7): 1427-1438.
|
|
|
| [101] |
Román-Palacios C, Wiens J J. 2020. Recent responses to climate change reveal the drivers of species extinction and survival. Proceedings of the National Academy of Sciences, 117(8): 4211-4217.
|
|
|
| [102] |
Shabala S. 2013. Learning from halophytes: physiological basis and strategies to improve abiotic stress tolerance in crops. Annals of Botany, 112(7): 1209-1221.
doi: 10.1093/aob/mct205
pmid: 24085482
|
|
|
| [103] |
Shabala S, Bose J, Hedrich R. 2014. Salt bladders: do they matter? Trends in Plant Science, 19(11): 687-691.
doi: 10.1016/j.tplants.2014.09.001
pmid: 25361704
|
|
|
| [104] |
Shao Q, Han N, Ding T L, et al. 2014. SsHKT1; 1 is a potassium transporter of the C3 halophyte Suaeda salsa that is involved in salt tolerance. Functional Plant Biology, 41(8): 790-802.
doi: 10.1071/FP13265
pmid: 32481033
|
|
|
| [105] |
Sheppard C S. 2013. How does selection of climate variables affect predictions of species distributions? A case study of three new weeds in New Zealand. Weed Research, 53(4): 259-268.
|
|
|
| [106] |
Shi X D, Yin Q, Sang Z Y, et al. 2021. Prediction of potentially suitable areas for the introduction of Magnolia wufengensis under climate change. Ecological Indicators, 127: 107762, doi: 10.1016/j.ecolind.2021.107762.
|
|
|
| [107] |
Singh A. 2021. Soil salinization management for sustainable development: a review. Journal of Environmental Management, 277: 111383, doi: 10.1016/j.jenvman.2020.111383.
|
|
|
| [108] |
Song G Q, Feng J L, Gong S, et al. 2023. Geographic distribution and impacts of climate change on the suitable habitats of Rhamnus utilis Decne in China. BMC Plant Biology, 23(1): 592, doi: 10.1186/s12870-023-04574-4.
|
|
|
| [109] |
Srivastava V, Lafond V, Griess V. 2019. Species distribution models (SDM): applications, benefits and challenges in invasive species management. CAB Reviews Perspectives in Agriculture Veterinary Science Nutrition and Natural Resources, 14: 1-13.
|
|
|
| [110] |
Stockwell D. 1999. The GARP modelling system: problems and solutions to automated spatial prediction. International Journal of Geographical Information Science, 13(2): 143-158.
|
|
|
| [111] |
Sun S X, Zhang Y, Huang D Z, et al. 2020. The effect of climate change on the richness distribution pattern of oaks (Quercus L.) in China. Science of the Total Environment, 744: 140786, doi: 10.1016/j.scitotenv.2020.140786.
|
|
|
| [112] |
Thomas C D, Franco A M A, Hill J K. 2006. Range retractions and extinction in the face of climate warming. Trends in Ecology & Evolution, 21(8): 415-416.
|
|
|
| [113] |
Thomson A M, Calvin K V, Smith S J, et al. 2011. RCP4.5: A pathway for stabilization of radiative forcing by 2100. Climatic Change, 109: 77, doi: 10.1007/s10584-011-0151-4.
|
|
|
| [114] |
Tu W Q, Xiong Q L, Qiu X P, et al. 2021. Dynamics of invasive alien plant species in China under climate change scenarios. Ecological Indicators, 129: 107919, doi: 10.1016/j.ecolind.2021.107919.
|
|
|
| [115] |
van Zelm E, Zhang Y X, Testerink C. 2020. Salt tolerance mechanisms of plants. Annual Review of Plant Biology, 71(1): 403-433.
|
|
|
| [116] |
Vitt P, Havens K, Kramer A T, et al. 2010. Assisted migration of plants: changes in latitudes, changes in attitudes. Biological Conservation, 143(1): 18-27.
|
|
|
| [117] |
Wang F, Yuan X Z, Sun Y J, et al. 2024. Species distribution modeling based on MaxEnt to inform biodiversity conservation in the central urban area of Chongqing Municipality. Ecological Indicators, 158: 111491, doi: 10.1016/j.ecolind.2023.111491.
|
|
|
| [118] |
Wang H F, Kong L, Gao R, et al. 2019. Germination biology of dimorphic seeds of the annual halophyte common seepweed (Suaeda glauca). Weed Science, 68(2): 143-150.
|
|
|
| [119] |
Wang J R, Hawkins C D B, Letchford T. 1998. Photosynthesis, water and nitrogen use efficiencies of four paper birch (Betula papyrifera) populations grown under different soil moisture and nutrient regimes. Forest Ecology and Management, 112(3): 233-244.
|
|
|
| [120] |
Wang S, Sun L, Rao M P N, et al. 2021. Insights into the microbial diversity in saline-alkaline soils of China. In: Egamberdieva D, Birkeland N K, Li W J, et al. Microbial Communities and Their Interactions in the Extreme Environment. Singapore: Springer, 17-41.
|
|
|
| [121] |
Wang Y G, Deng C Y, Liu Y, et al. 2018. Identifying change in spatial accumulation of soil salinity in an inland river watershed, China. Science of the Total Environment, 621: 177-185.
|
|
|
| [122] |
Wang Y Y, Wang S Q, Zhao Z Y, et al. 2023. Progress of euhalophyte adaptation to arid areas to remediate salinized soil. Agriculture, 13(3): 704, doi: 10.3390/agriculture13030704.
|
|
|
| [123] |
Warren D L, Glor R E, Turelli M. 2010. ENMTools: a toolbox for comparative studies of environmental niche models. Ecography, 33(3): 607-611.
|
|
|
| [124] |
Warren D L, Wright A N, Seifert S N, et al. 2014. Incorporating model complexity and spatial sampling bias into ecological niche models of climate change risks faced by 90 California vertebrate species of concern. Diversity and Distributions, 20(3): 334-343.
|
|
|
| [125] |
Warren R, Price J, Graham E, et al. 2018. The projected effect on insects, vertebrates, and plants of limiting global warming to 1.5°C rather than 2°C. Science, 360(6390): 791-795.
doi: 10.1126/science.aar3646
pmid: 29773751
|
|
|
| [126] |
Wei S G, Dai Y J, Liu B Y, et al. 2013. A China data set of soil properties for land surface modeling. Journal of Advances in Modeling Earth Systems, 5(2): 212-224.
|
|
|
| [127] |
Wu T W, Song L C, Li W P, et al. 2014. An overview of BCC climate system model development and application for climate change studies. Journal of Meteorological Research, 28(1): 34-56.
|
|
|
| [128] |
Wu T W, Lu Y X, Fang Y J, et al. 2019. The Beijing Climate Center Climate System Model (BCC-CSM): the main progress from CMIP 5 to CMIP6. Geoscientific Model Development, 12(4): 1573-1600.
|
|
|
| [129] |
Xian X Q, Zhao H X, Guo J Y, et al. 2022. Estimation of the potential geographical distribution of a new potato pest (Schrankia costaestrigalis) in China under climate change. Journal of Integrative Agriculture, 22(8): 2441-2455.
|
|
|
| [130] |
Xiong Q L, Xiao Y, Halmy M W A, et al. 2019. Monitoring the impact of climate change and human activities on grassland vegetation dynamics in the northeastern Qinghai-Tibet Plateau of China during 2000-2015. Journal of Arid Land, 11(5): 637-651.
|
|
|
| [131] |
Xiong Q L, Luo X J, Liang P H, et al. 2020. Fire from policy, human interventions, or biophysical factors? temporal-spatial patterns of forest fire in southwestern China. Forest Ecology and Management, 474: 118381, doi: 10.1016/j.foreco.2020.118381.
|
|
|
| [132] |
Yang B, Qin S Y, Xu W S, et al. 2020. Gap analysis of giant panda conservation as an example for planning China's national park system. Current Biology, 30(7): 1287-1291.e2.
doi: S0960-9822(20)30113-5
pmid: 32197079
|
|
|
| [133] |
Yang H, Jiang Z H, Li L. 2016. Biases and improvements in three dynamical downscaling climate simulations over China. Climate Dynamics, 47(9): 3235-3251.
|
|
|
| [134] |
Yang Z B, Bai Y, Alatalo J M, et al. 2021. Spatio-temporal variation in potential habitats for rare and endangered plants and habitat conservation based on the maximum entropy model. Science of the Total Environment, 784: 147080, doi: 10.1016/j.scitotenv.2021.147080.
|
|
|
| [135] |
Ye P C, Zhang G F, Zhao X, et al. 2021. Potential geographical distribution and environmental explanations of rare and endangered plant species through combined modeling: a case study of Northwest Yunnan, China. Ecology and Evolution, 11(19): 13052-13067.
doi: 10.1002/ece3.7999
pmid: 34646452
|
|
|
| [136] |
Yi Y J, Cheng X, Yang Z F, et al. 2016. Maxent modeling for predicting the potential distribution of endangered medicinal plant (H. riparia Lour) in Yunnan, China. Ecological Engineering, 92: 260-269.
|
|
|
| [137] |
Yilmaz H, Yilmaz O Y, Akyüz Y F. 2017. Determining the factors affecting the distribution of Muscari latifolium, an endemic plant of Turkey, and a mapping species distribution model. Ecology and Evolution, 7(4): 1112-1124.
|
|
|
| [138] |
Yin B F, Zhang Y M, Zhang H X, et al. 2023. Phylogeographic structure of Syntrichia caninervis Mitt, a xerophytic moss, highlights the expanded during glacial period. Journal of Plant Ecology, 16(2): rtac057, doi: 10.1093/jpe/rtac057.
|
|
|
| [139] |
Yuan J, Wang X Q, Zhao Y, et al. 2020. Genetic basis and identification of candidate genes for salt tolerance in rice by GWAS. Scientific Reports, 10(1): 9958, doi:10.1038/s41598-020-66604-7.
pmid: 32561778
|
|
|
| [140] |
Zhang H, Irving L J, Tian Y, et al. 2012. Influence of salinity and temperature on seed germination rate and the hydrotime model parameters for the halophyte, Chloris virgata, and the glycophyte, Digitaria sanguinalis. South African Journal of Botany, 78: 203-210.
|
|
|
| [141] |
Zhang H, Wang X P, Zhang Y F, et al. 2015. Responses of plant growth of different life forms to rainfall amount changes in an arid desert area. Chinese Journal of Ecology, 34: 1847-1853. (in Chinese)
|
|
|
| [142] |
Zhang H, Zhao H X. 2021. Study on rare and endangered plants under climate: Maxent modeling for identifying hot spots in Northwest China. CERNE, 27(1): e-102667, doi: 10.1590/01047760202127012667.
|
|
|
| [143] |
Zhang J J, Jiang F, Li G Y, et al. 2019. Maxent modeling for predicting the spatial distribution of three raptors in the Sanjiangyuan National Park, China. Ecology and Evolution, 9(11): 6643-6654.
|
|
|
| [144] |
Zhang J L, Shi H Z. 2013. Physiological and molecular mechanisms of plant salt tolerance. Photosynthesis Research, 115(1): 1-22.
|
|
|
| [145] |
Zhang Y, Tang J S, Ren G, et al. 2021. Global potential distribution prediction of Xanthium italicum based on Maxent model. Scientific Reports, 11(1): 16545, doi: 10.1038/s41598-021-96041-z.
pmid: 34400696
|
|
|
| [146] |
Zhao S, Liu X, Banerjee S, et al. 2024. Continuous planting of euhalophyte Suaeda salsa enhances microbial diversity and multifunctionality of saline soil. Applied and Environmental Microbiology, 90(4): e02355-23, doi: 10.1128/aem.02355-23.
|
|
|
| [147] |
Zhao Y, Li Y Y, Wang J, et al. 2016. Buried straw layer plus plastic mulching reduces soil salinity and increases sunflower yield in saline soils. Soil and Tillage Research, 155: 363-370.
|
|
|
| [148] |
Zhao Y, Deng X W, Xiang W H, et al. 2021. Predicting potential suitable habitats of Chinese fir under current and future climatic scenarios based on Maxent model. Ecological Informatics, 64: 101393, doi: 10.1016/j.ecoinf.2021.101393.
|
|
|
| [149] |
Zhou H P, Shi H F, Yang Y Q, et al. 2024. Insights into plant salt stress signaling and tolerance. Journal of Genetics and Genomics, 51(1): 16-34.
|
|
|
|
Viewed |
|
|
|
Full text
|
|
|
|
|
Abstract
|
|
|
|
|
Cited |
|
|
|
|
| |
Shared |
|
|
|
|
| |
Discussed |
|
|
|
|