| Research article |
|


|
|
|
| Effects of mixed-based biochar on water infiltration and evaporation in aeolian sand soil |
ZOU Yiping1, ZHANG Shuyue1, SHI Ziyue1, ZHOU Huixin1, ZHENG Haowei1, HU Jiahui1, MEI Jing1, BAI Lu2,3, JIA Jianli1,*( ) ) |
1School of Chemical & Environmental Engineering, China University of Mining and Technology (Beijing), Beijing 100083, China
2State Key Laboratory of Water Resource Protection and Utilization in Coal Mining, Beijing 102211, China
3National Institute of Clean-and-Low-Carbon Energy, Beijing 102211, China |
|
|
|
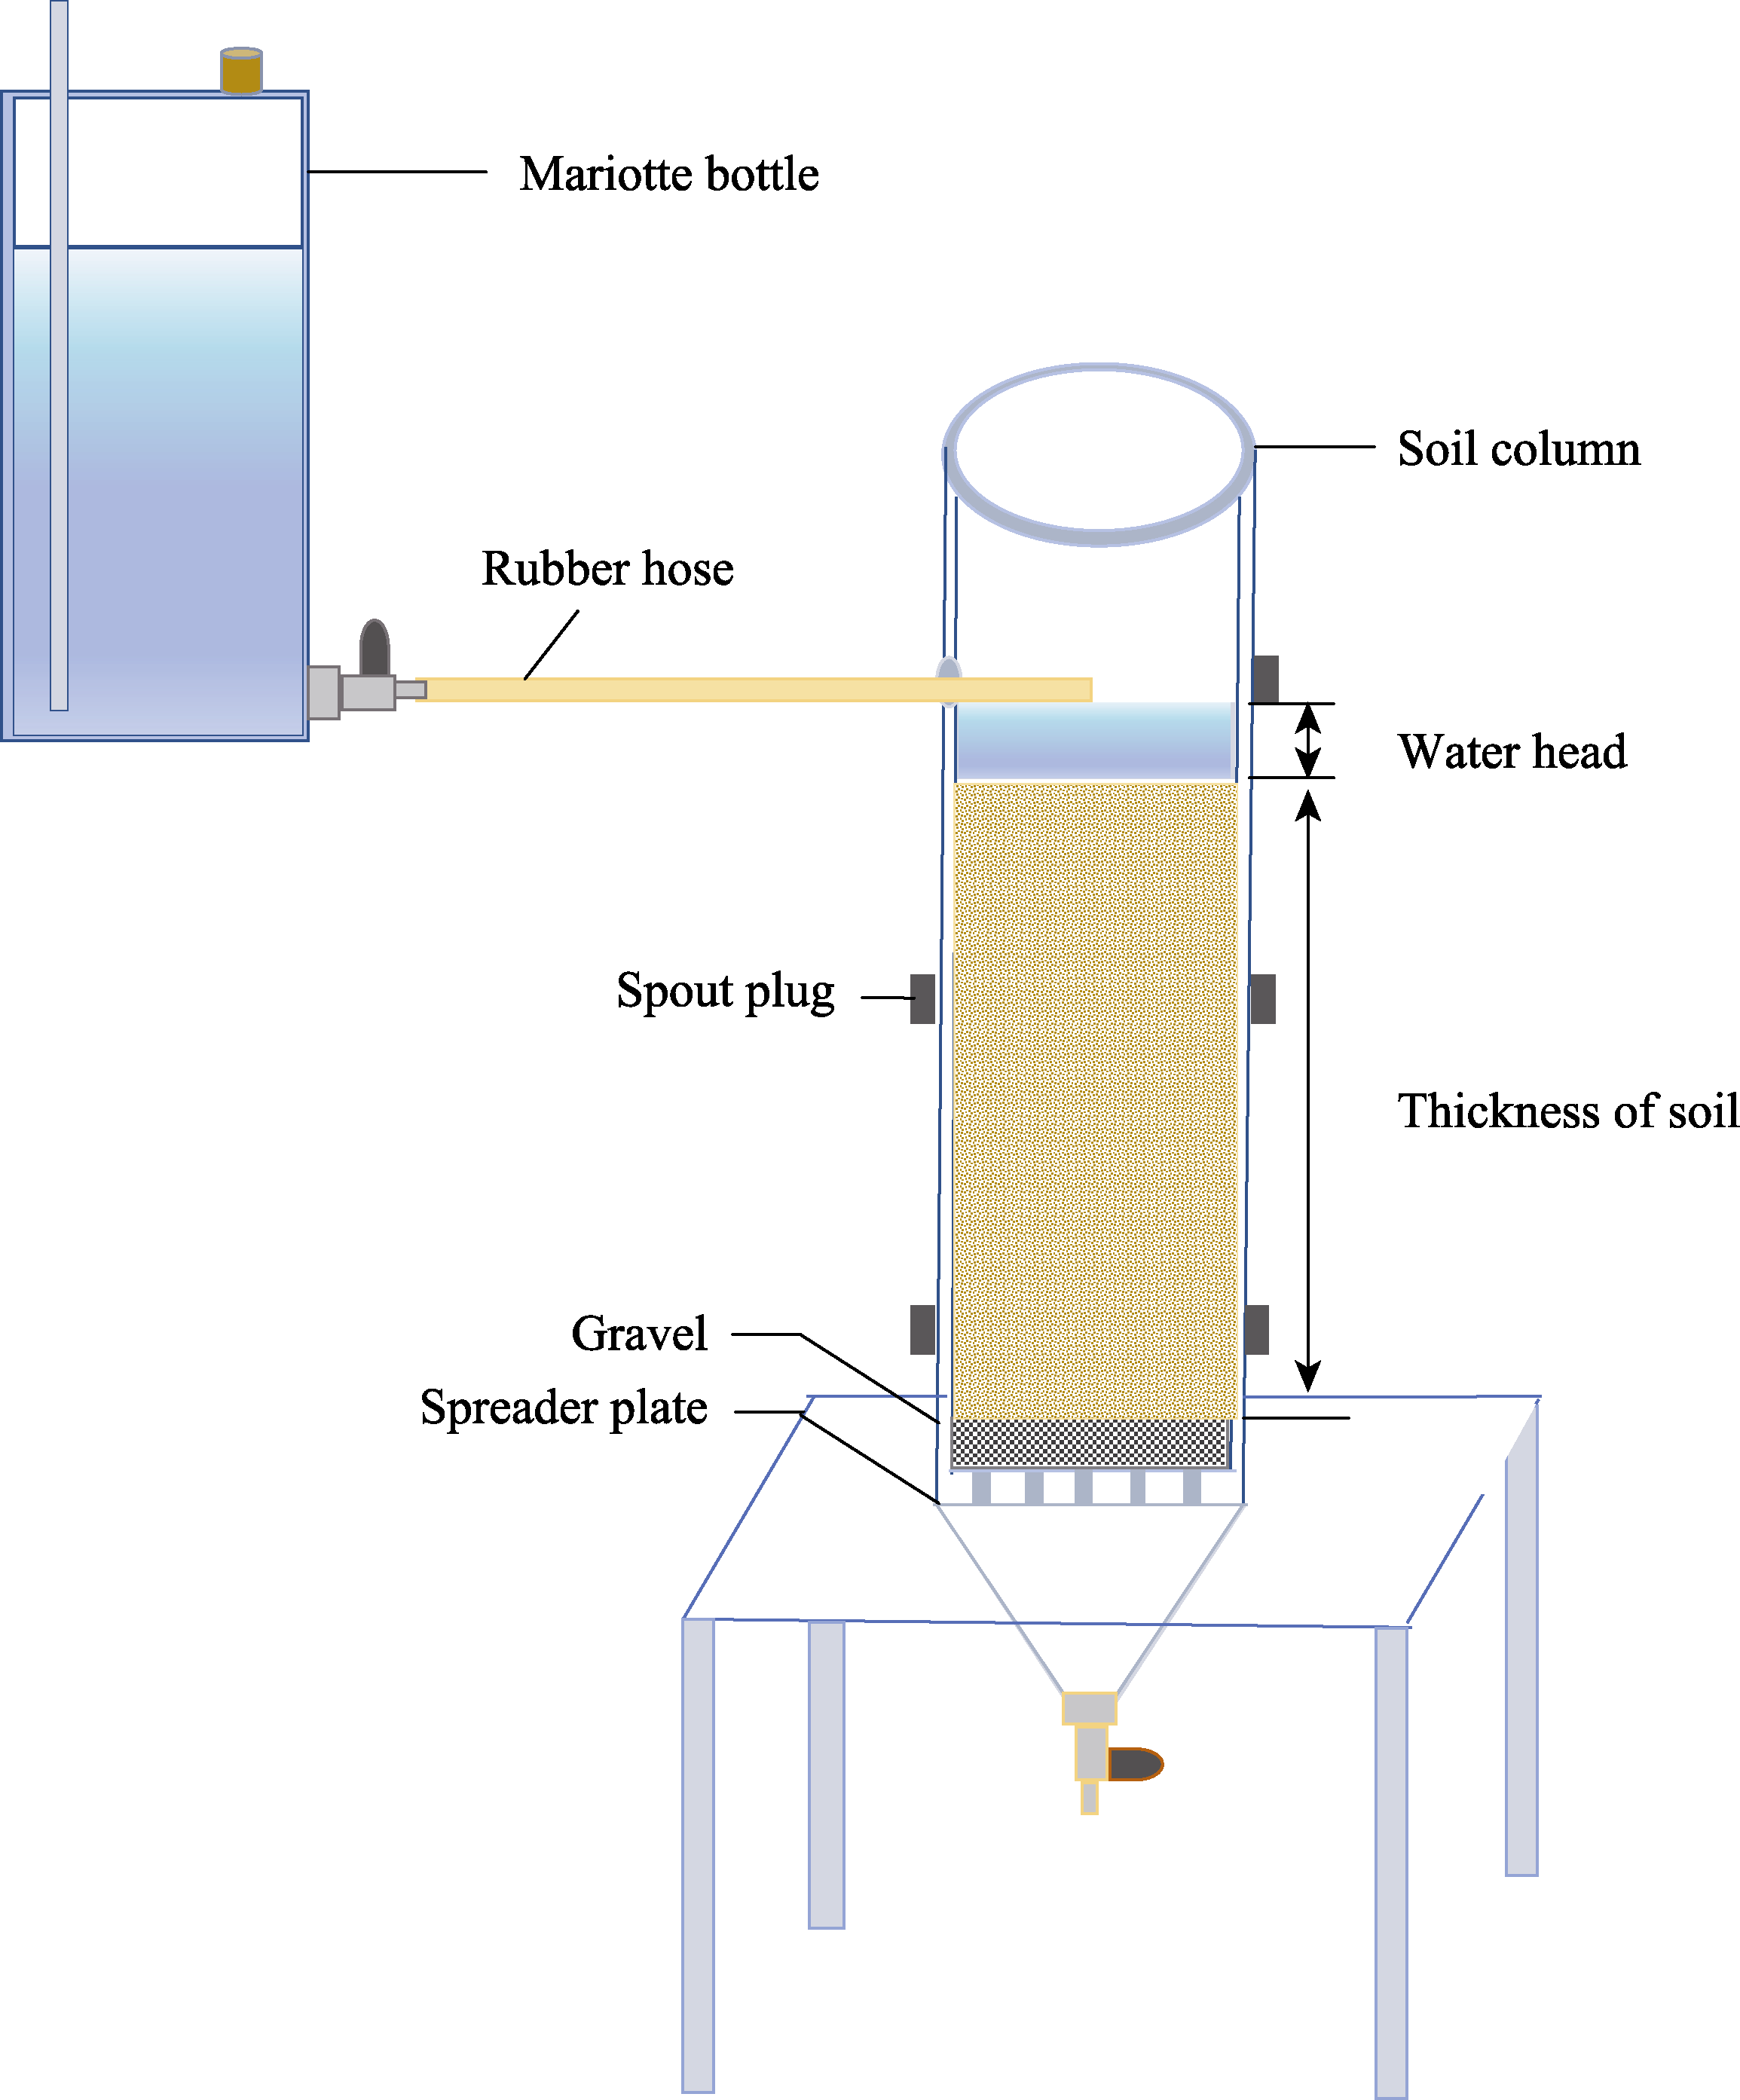
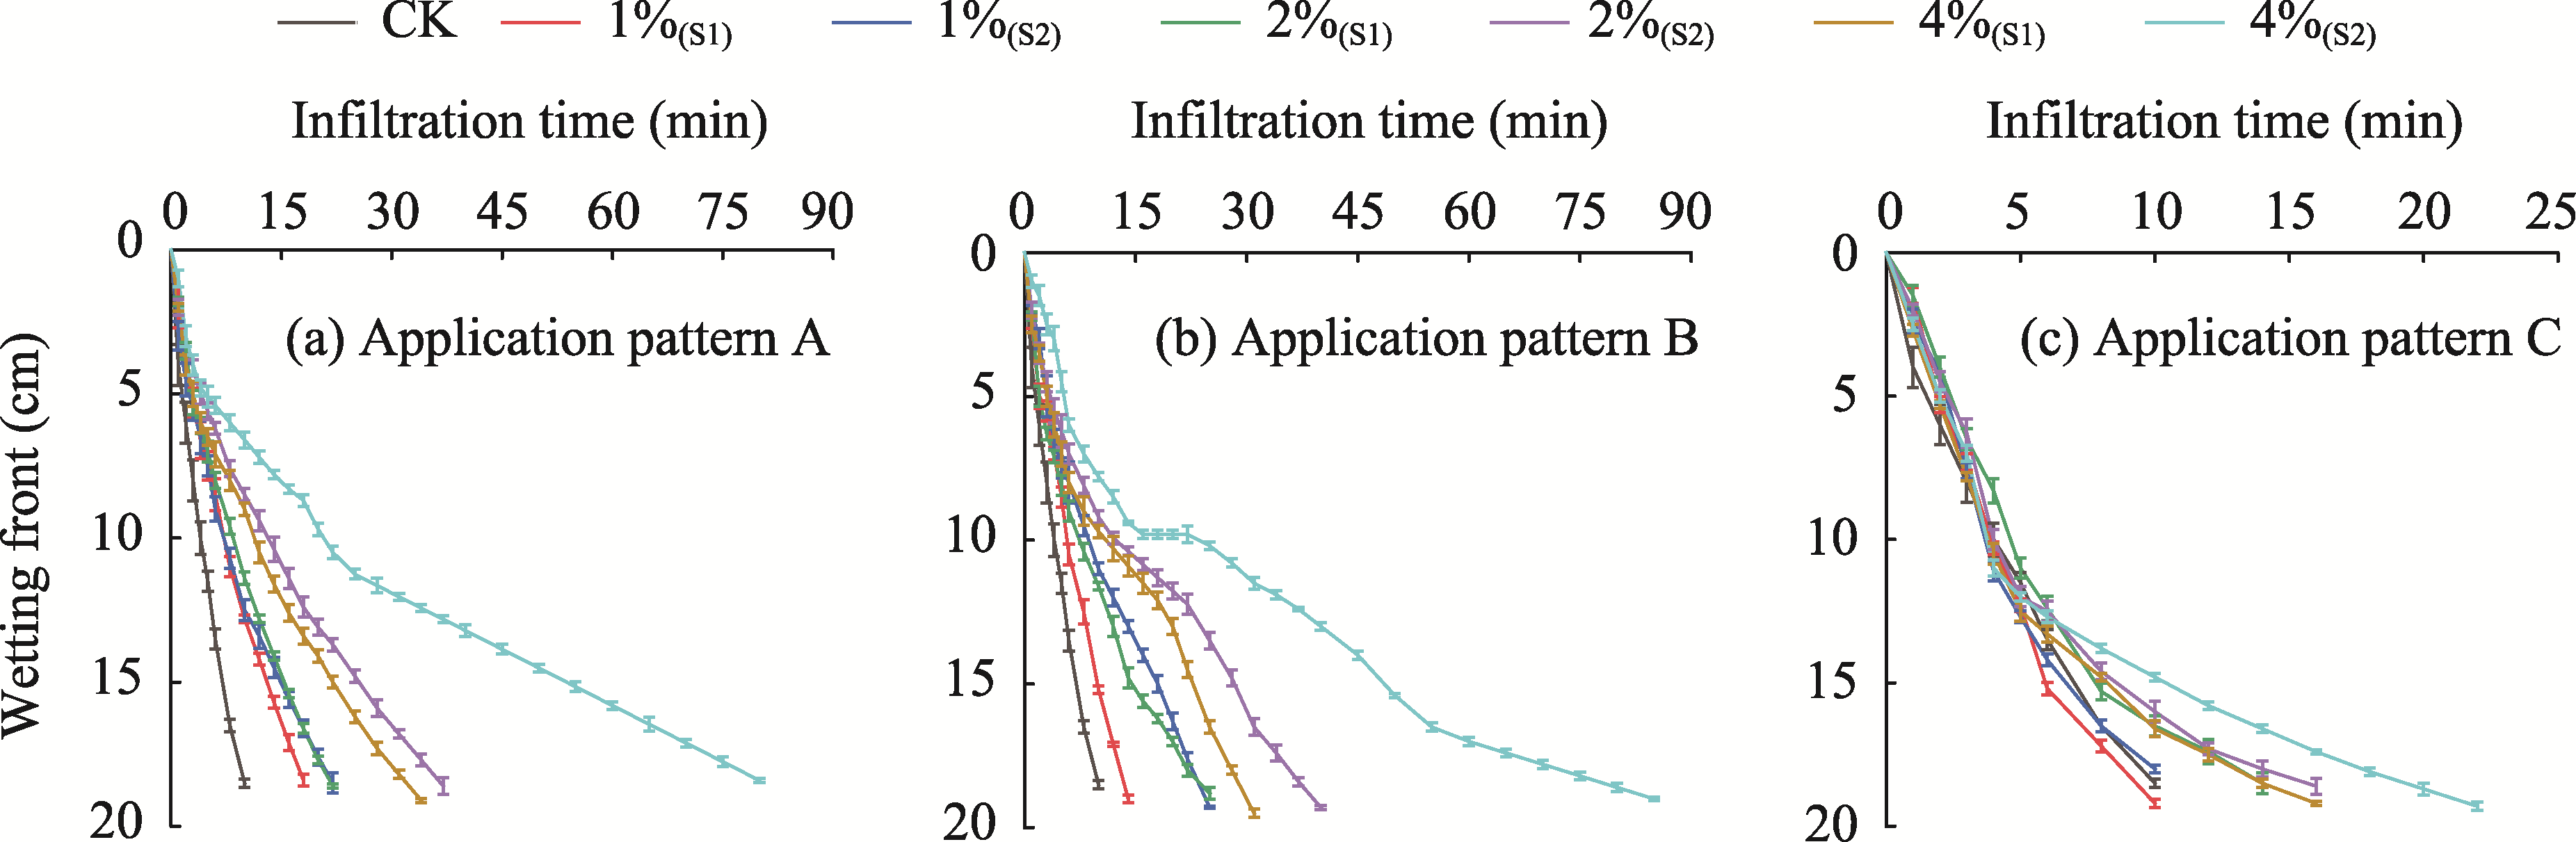
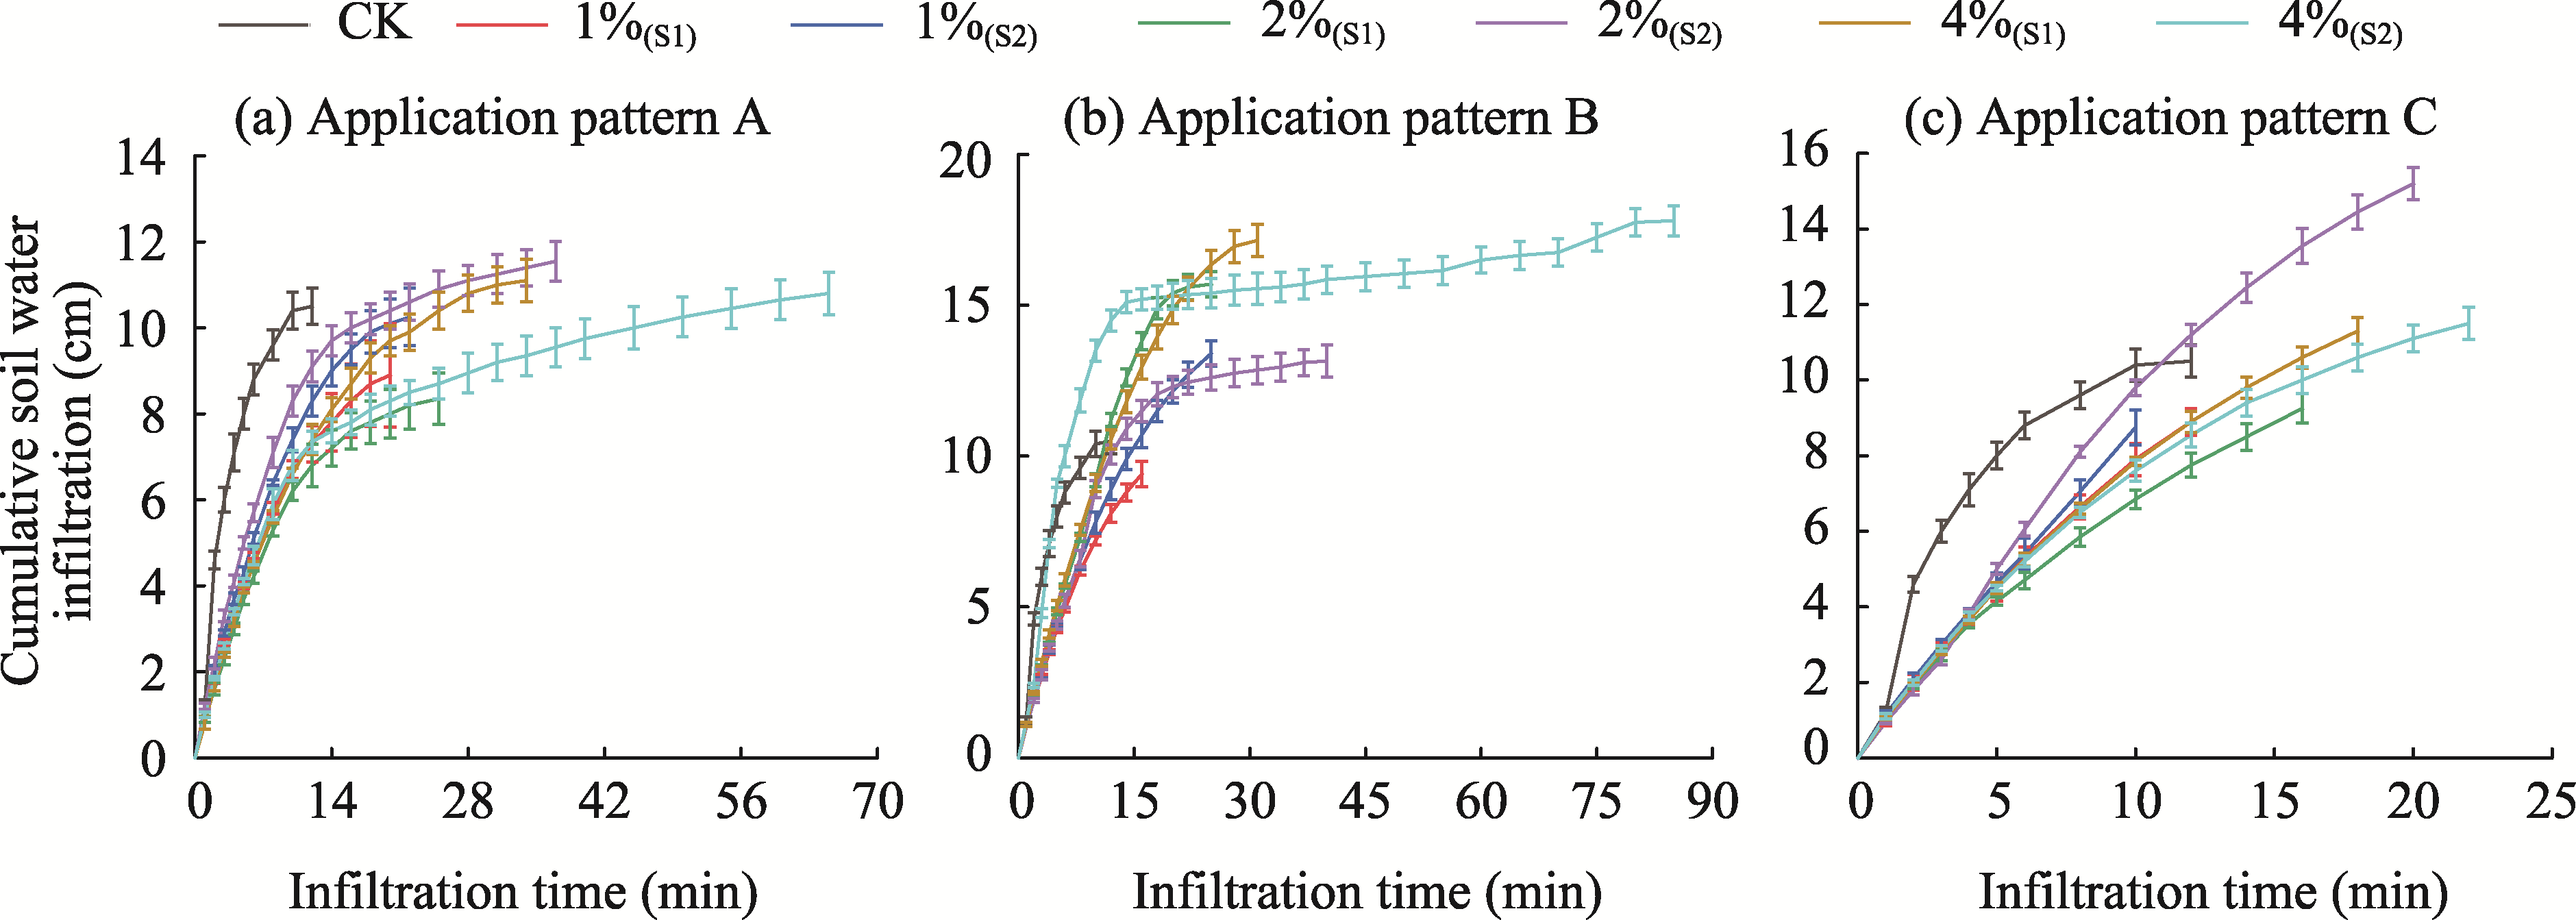
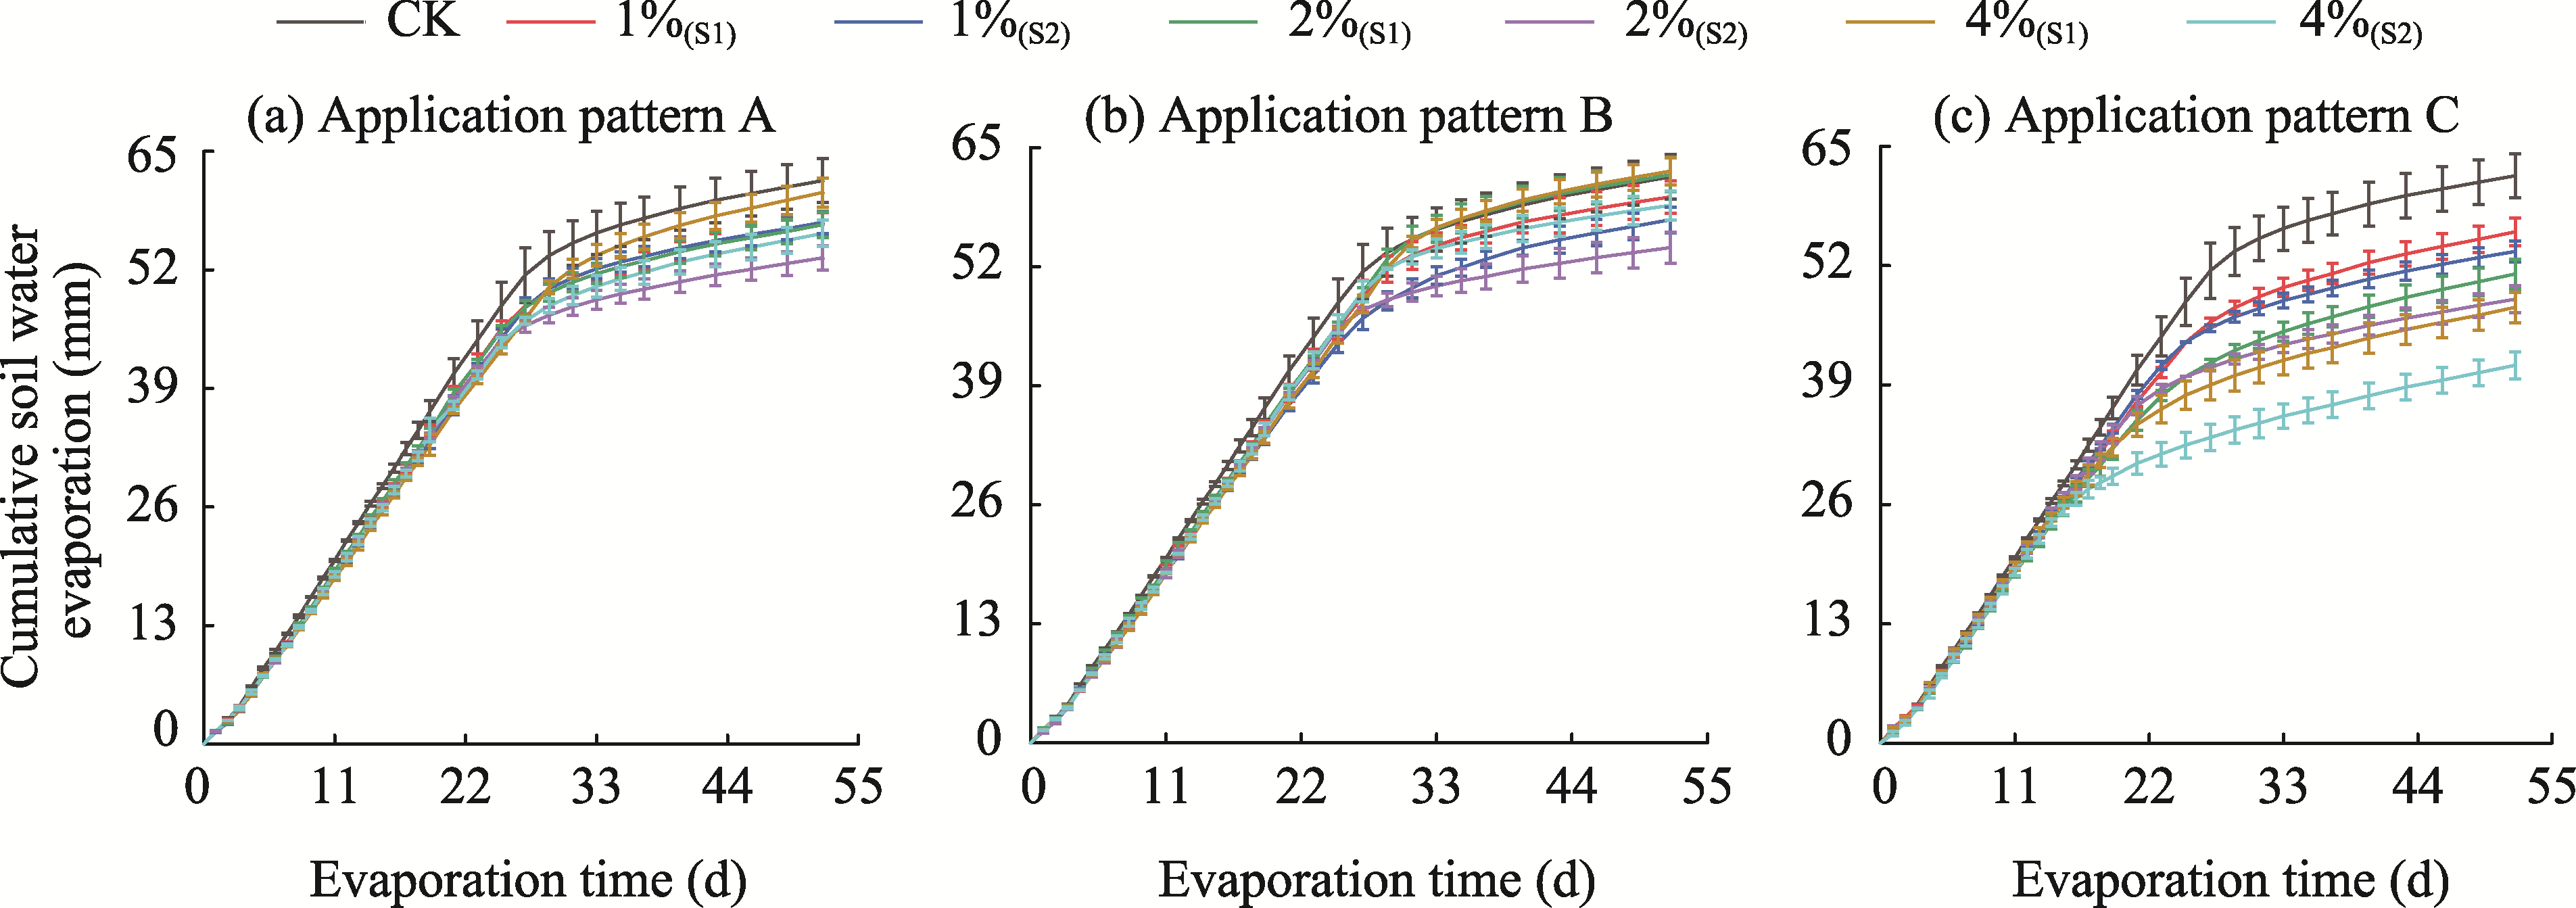
Abstract Aeolian sandy soil in mining areas exhibits intense evaporation and poor water retention capacity. This study was designed to find a suitable biochar application method to improve soil water infiltration and minimize soil water evaporation for aeolian sand soil. Using the indoor soil column method, we studied the effects of three application patterns (A (0-20 cm was a mixed sample of mixed-based biochar and soil), B (0-10 cm was a mixed sample of mixed-based biochar and soil and 10-20 cm was soil), and C (0-10 cm was soil and 10-20 cm was a mixed sample of mixed-based biochar and soil)), four application amounts (0% (control, CK), 1%, 2%, and 4% of mixed-based biochar in dry soil), and two particle sizes (0.05-0.25 mm (S1) and <0.05 mm (S2)) of mixed-based biochar on water infiltration and evaporation of aeolian sandy soil. We separately used five infiltration models (the Philip, Kostiakov, Horton, USDA-NRCS (United States Department of Agriculture-Natural Resources Conservation Service), and Kostiakov-Lewis models) to fit cumulative infiltration and time. Compared with CK, the application of mixed-based biochar significantly reduced cumulative soil water infiltration. Under application patterns A, B, and C, the higher the application amount and the finer the particle size were, the lower the migration speed of the wetting front. With the same application amount, cumulative soil water infiltration under application pattern A was the lowest. Taking infiltration for 10 min as an example, the reductions of cumulative soil water infiltration under the treatments of A2%(S2), A4%(S1), A4%(S2), A1%(S1), C2%(S1), and B1%(S1) were higher than 30%, which met the requirements of loess soil hydraulic parameters suitable for plant growth. The five infiltration models well fitted the effects of the treatments of application pattern C and S1 particle size (R2>0.980), but the R2 values of the Horton model exceeded 0.990 for all treatments (except for the treatment B2%(S2)). Compared with CK, all other treatments reduced cumulative soil water infiltration, except for B4%(S2). With the same application amount, cumulative soil water evaporation difference between application patterns A and B was small. Treatments of application pattern C and S1 particle size caused a larger reduction in cumulative soil water evaporation. The reductions in cumulative soil water evaporation under the treatments of C4%(S1), C4%(S2), C2%(S1), and C2%(S2) were over 15.00%. Therefore, applying 2% of mixed-based biochar with S1 particle size to the underlying layer (10-20 cm) could improve soil water infiltration while minimizing soil water evaporation. Moreover, application pattern was the main factor affecting soil water infiltration and evaporation. Further, there were interactions among the three influencing factors in the infiltration process (application amount×particle size with the most important interaction), while there were no interactions among them in the evaporation process. The results of this study could contribute to the rational application of mixed-based biochar in aeolian sandy soil and the resource utilization of urban and agricultural wastes in mining areas.
|
|
Received: 03 August 2021
Published: 30 April 2022
|
|
Corresponding Authors:
*JIA Jianli (E-mail: jjl@cumtb.edu.cn)
|
| Cite this article:
ZOU Yiping, ZHANG Shuyue, SHI Ziyue, ZHOU Huixin, ZHENG Haowei, HU Jiahui, MEI Jing, BAI Lu, JIA Jianli. Effects of mixed-based biochar on water infiltration and evaporation in aeolian sand soil. Journal of Arid Land, 2022, 14(4): 374-389.
URL:
http://jal.xjegi.com/10.1007/s40333-022-0060-6 OR http://jal.xjegi.com/Y2022/V14/I4/374
|
|
|
| [1] |
Ahmad M, Lee S S, Dou X M, et al. 2012. Effects of pyrolysis temperature on soybean stover- and peanut shell-derived biochar properties and TCE adsorption in water. Bioresource Technology, 118: 536-544.
doi: 10.1016/j.biortech.2012.05.042
|
|
|
| [2] |
Alaa I, Adel R A U, Mohammad I A W, et al. 2017. Effects of conocarpus biochar on hydraulic properties of calcareous sandy soil: influence of particle size and application depth. Archives of Agronomy and Soil Science, 63(2): 185-197.
doi: 10.1080/03650340.2016.1193785
|
|
|
| [3] |
Bao Z W. 2020. Study on the effect of mixed biochar on soil water and salt transport in gravel-mulched fields. MSc Thesis. Lanzhou: Lanzhou University of Technology. (in Chinese)
|
|
|
| [4] |
Basanta R, de Varennes A, Díaz-Raviña M, et al. 2017. Microbial community structure and biomass of a mine soil with different organic and inorganic treatments and native plants. Journal of Soil Science and Plant Nutrition, 17(4): 839-852.
doi: 10.4067/S0718-95162017000400001
|
|
|
| [5] |
Breus I P, Mishchenko A A, Shinkarev Jr A A, et al. 2014. Effect of organic matter on the sorption activity of heavy loamy soils for volatile organic compounds under low moisture conditions. Eurasian Soil Science, 47(12): 1216-1226.
doi: 10.1134/S1064229314120011
|
|
|
| [6] |
Burrell L D, Zehetner F, Rampazzo N, et al. 2016. Long-term effects of biochar on soil physical properties. Geoderma, 282: 96-102.
doi: 10.1016/j.geoderma.2016.07.019
|
|
|
| [7] |
Duan R, Fedler C B, Borrelli J. 2011. Field evaluation of infiltration models in lawn soils. Irrigation Science, 29: 379-389.
doi: 10.1007/s00271-010-0248-y
|
|
|
| [8] |
Githinji L. 2013. Effect of biochar application rate on soil physical and hydraulic properties of a sandy loam. Archives of Agronomy and Soil Science, 60(4): 457-470.
doi: 10.1080/03650340.2013.821698
|
|
|
| [9] |
Green W H, Ampt G A. 1911. Studies of soil physics. The Journal of Agricultural Science, 4(1): 1-24.
doi: 10.1017/S0021859600001441
|
|
|
| [10] |
Horton R E. 1941. An approach toward a physical interpretation of infiltration capacity. Soil Science Society of America Journal, 5: 399-417.
doi: 10.2136/sssaj1941.036159950005000C0075x
|
|
|
| [11] |
Kim Y J, Hyun J, Yoo S Y, et al. 2021. The role of biochar in alleviating soil drought stress in urban roadside greenery. Geoderma, 404: 115223, doi: 10.1016/j.geoderma.2021.115223.
doi: 10.1016/j.geoderma.2021.115223
|
|
|
| [12] |
Kinney T J, Masiello C A, Dugan B, et al. 2012. Hydrologic properties of biochars produced at different temperatures. Biomass and Bioenergy, 41: 34-43.
doi: 10.1016/j.biombioe.2012.01.033
|
|
|
| [13] |
Kostiakov A N. 1932. On the dynamics of the coefficient of water percolation in soils and on the necessity of studying it from a dynamic point of view for purposes of amelioration. In: Transactions of the 6th Congress of the International Society of Soil Science. Moscow: Society of Soil Science, 7-21.
|
|
|
| [14] |
Laird D A, Fleming P, Davis D D, et al. 2010. Impact of biochar amendments on the quality of a typical Midwestern agricultural soil. Geoderma, 158(3-4): 443-449.
doi: 10.1016/j.geoderma.2010.05.013
|
|
|
| [15] |
Lehmann J. 2007. A handful of carbon. Nature, 447(7141): 143-144.
doi: 10.1038/447143a
|
|
|
| [16] |
Lehmann J, Rillig M C, Thies J, et al. 2011. Biochar effects on soil biota: A review. Soil Biology and Biochemistry, 43(9): 1812-1836.
doi: 10.1016/j.soilbio.2011.04.022
|
|
|
| [17] |
Li J, Li J, Cheng K, et al. 2016. Soil organic carbon sequestration, yield and income increment of rotational tillage measures on Weibei highland maize field. Transactions of the Chinese Society of Agricultural Engineering, 32(5): 104-111. (in Chinese)
|
|
|
| [18] |
Li S L, Wang X, Wang S, et al. 2016. Effects of application patterns and amount of biochar on water infiltration and evaporation. Transactions of the Chinese Society of Agricultural Engineering, 32(14): 135-144. (in Chinese)
|
|
|
| [19] |
Li S L, Zhang Y W, Yan W M, et al. 2018. Effect of biochar application method on nitrogen leaching and hydraulic conductivity in a silty clay soil. Soil and Tillage Research, 183: 100-108.
doi: 10.1016/j.still.2018.06.006
|
|
|
| [20] |
Li S L. 2019. Effects of biochar on soil ecological function under dryland farming. PhD Dissertation. Yangling: Research Center of Soil and Water Conservation and Ecological Environment, University of Chinese Academy of Sciences. (in Chinese)
|
|
|
| [21] |
Lim T J, Spokas K A, Feyereisen G, et al. 2016. Predicting the impact of biochar additions on soil hydraulic properties. Chemosphere, 142: 136-144.
doi: 10.1016/j.chemosphere.2015.06.069
pmid: 26145507
|
|
|
| [22] |
Liu J L, Ma X Y, Zhang Z H. 2010. Applicability of explicit functions on cumulative infiltration of Green-Ampt model under different conditions. Journal of Basic Science and Engineering, 18(1): 11-19. (in Chinese)
|
|
|
| [23] |
Liu Z L, Dugan B, Masiello C A, et al. 2016. Impacts of biochar concentration and particle size on hydraulic conductivity and DOC leaching of biochar-sand mixtures. Journal of Hydrology, 533: 461-472.
doi: 10.1016/j.jhydrol.2015.12.007
|
|
|
| [24] |
Mezencev V J. 1948. Theory of formation of the surface runoff. Meteorologia I Gidrologia, 3: 33-46. (in Russian)
|
|
|
| [25] |
Mukherjee A, Lal R, Zimmerman A R. 2014. Effects of biochar and other amendments on the physical properties and greenhouse gas emissions of an artificially degraded soil. Science of the Total Environment, 487: 26-36.
doi: 10.1016/j.scitotenv.2014.03.141
|
|
|
| [26] |
Nguyen B T, Lehmann J, Hockaday W C, et al. 2010. Temperature sensitivity of black carbon decomposition and oxidation. Environmental Science & Technology, 44(9): 3324-3331.
doi: 10.1021/es903016y
|
|
|
| [27] |
Philip J R. 1957. The theory of infiltration: 1. The infiltration equation and its solution. Soil Science, 83(5): 345-358.
doi: 10.1097/00010694-195705000-00002
|
|
|
| [28] |
Qi R P, Zhang L, Yan Y H, et al. 2014. Effects of biochar addition into soils in semiarid land on water infiltration under the condition of the same bulk density. Chinese Journal of Applied Ecology, 25(8): 2281-2288. (in Chinese)
|
|
|
| [29] |
Razzaghi F, Obour P B, Arthur E. 2020. Does biochar improve soil water retention? A systematic review and meta-analysis. Geoderma, 361: 114055, doi: 10.1016/j.geoderma.2019.114055.
doi: 10.1016/j.geoderma.2019.114055
|
|
|
| [30] |
Sun J N, Yang R Y, Li W X, et al. 2018. Effect of biochar amendment on water infiltration in a coastal saline soil. Journal of Soils and Sediments, 18: 3271-3279.
doi: 10.1007/s11368-018-2001-8
|
|
|
| [31] |
Tammeorg P, Simojoki A, Mäkelä P, et al. 2014. Short-term effects of biochar on soil properties and wheat yield formation with meat bone meal and inorganic fertiliser on a boreal loamy sand. Agriculture, Ecosystems & Environment, 191: 108-116.
doi: 10.1016/j.agee.2014.01.007
|
|
|
| [32] |
Tang X J, Li X, Liu X M, et al. 2015. Effects of inorganic and organic amendments on the uptake of lead and trace elements by Brassica chinensis grown in an acidic red soil. Chemosphere, 119: 177-183.
doi: 10.1016/j.chemosphere.2014.05.081
|
|
|
| [33] |
United States Department of Agriculture-Natural Resources and Conservation Service (USDA-URCS). 1974. National Engineering Handbook: Section 15. Irrigation. Washington D.C.: Soil Conservation Service, United States Department of Agriculture (USDA-SCS).
|
|
|
| [34] |
Wang C Y, Mao X M, Zhao B. 2010. Experiment and simulation of water infiltration of layered sand column in laboratory. Transactions of the Chinese Society of Agricultural Engineering, 26: 61-67. (in Chinese)
|
|
|
| [35] |
Wang D Y, Li C Y, Parikh S J, et al. 2019. Impact of biochar on water retention of two agricultural soils: A multi-scale analysis. Geoderma, 340: 185-191.
doi: 10.1016/j.geoderma.2019.01.012
|
|
|
| [36] |
Wang H L, Tang X G, Zhang W, et al. 2015. Effects of biochar application on tilth soil hydraulic properties of sloping cropland of purple soil. Transactions of the Chinese Society of Agricultural Engineering, 31(4): 107-112. (in Chinese)
|
|
|
| [37] |
Wang T T, Stewart C S, Ma J B, et al. 2017. Applicability of five models to simulate water infiltration into soil with added biochar. Journal of Arid Land, 9(5): 701-711.
doi: 10.1007/s40333-017-0025-3
|
|
|
| [38] |
Wang T T, Stewart C E, Sun C C, et al. 2018. Effects of biochar addition on evaporation in the five typical Loess Plateau soils. CATENA, 162: 29-39.
doi: 10.1016/j.catena.2017.11.013
|
|
|
| [39] |
Wang T T, Li G L, Yang K Q, et al. 2021a. Enhanced ammonium removal on biochar from a new forestry waste by ultrasonic activation: Characteristics, mechanisms and evaluation. Science of the Total Environment, 778: 146295, doi: 10.1016/j.scitotenv.2021.146295.
doi: 10.1016/j.scitotenv.2021.146295
|
|
|
| [40] |
Wang T T, Zheng J Y, Liu H T, et al. 2021b. Adsorption characteristics and mechanisms of Pb2+ and Cd2+ by a new agricultural waste-Caragana korshinskii biomass derived biochar. Environmental Science and Pollution Research, 28: 13800-13818.
doi: 10.1007/s11356-020-11571-9
|
|
|
| [41] |
Wang Z P, Xie L K, Liu K, et al. 2019. Co-pyrolysis of sewage sludge and cotton stalks. Waste Management, 89: 430-438.
doi: 10.1016/j.wasman.2019.04.033
|
|
|
| [42] |
Wen M, Zheng J Y. 2012. Effects of different sizes of biochar and their addition rates on soil shrinkage characteristics. Research of Soil and Water Conservation, 19(1): 46-50, 55. (in Chinese)
|
|
|
| [43] |
Xia W S, Yang W Z, Shao M A. 2000. Effect of soil water hysteresis on evaporation and redistribution for huang mian soil. Journal of Natural Science of Hunan Normal University, 23(2): 83-87. (in Chinese)
|
|
|
| [44] |
Xiao Q, Zhang H P, Shen Y F, et al. 2015. Effects of biochar on water infiltration, evaporation and nitrate leaching in semi-arid loess area. Transactions of the Chinese Society of Agricultural Engineering, 31(16): 128-134. (in Chinese)
|
|
|
| [45] |
Xie Q, Wang L M, Qi R P, et al. 2016. Effects of biochar on water infiltration and water holding capacity of loessial soil. Journal of Earth Environment, 7(1): 65-76, 86. (in Chinese)
|
|
|
| [46] |
Zhang Q Z, Du Z L, Lou Y L, et al. 2015. A one-year short-term biochar application improved carbon accumulation in large macroaggregate fractions. CATENA, 127: 26-31.
doi: 10.1016/j.catena.2014.12.009
|
|
|
| [47] |
Zhou H, Chen C, Wang D Z, et al. 2020. Effect of long-term organic amendments on the full-range soil water retention characteristics of a Vertisol. Soil and Tillage Research, 202: 104663, doi: 10.1016/j.still.2020.104663.
doi: 10.1016/j.still.2020.104663
|
|
|
|
Viewed |
|
|
|
Full text
|
|
|
|
|
Abstract
|
|
|
|
|
Cited |
|
|
|
|
| |
Shared |
|
|
|
|
| |
Discussed |
|
|
|
|