| Research article |
|


|
|
|
| Spatiotemporal patterns and drivers of cultivated land conversion in Inner Mongolia Autonomous Region, northern China |
Xijiri1, ZHOU Ruiping1,*( ), BAO Baorong2, Burenjirigala 3 ), BAO Baorong2, Burenjirigala 3 |
1College of Geographical Science, Inner Mongolia Normal University, Hohhot 010022, China
2Dongsheng District Sub-bureau of Ordos Natural Resources Bureau, Ordos 017000, China
3Chifeng University, Chifeng 024000, China |
|
|
|
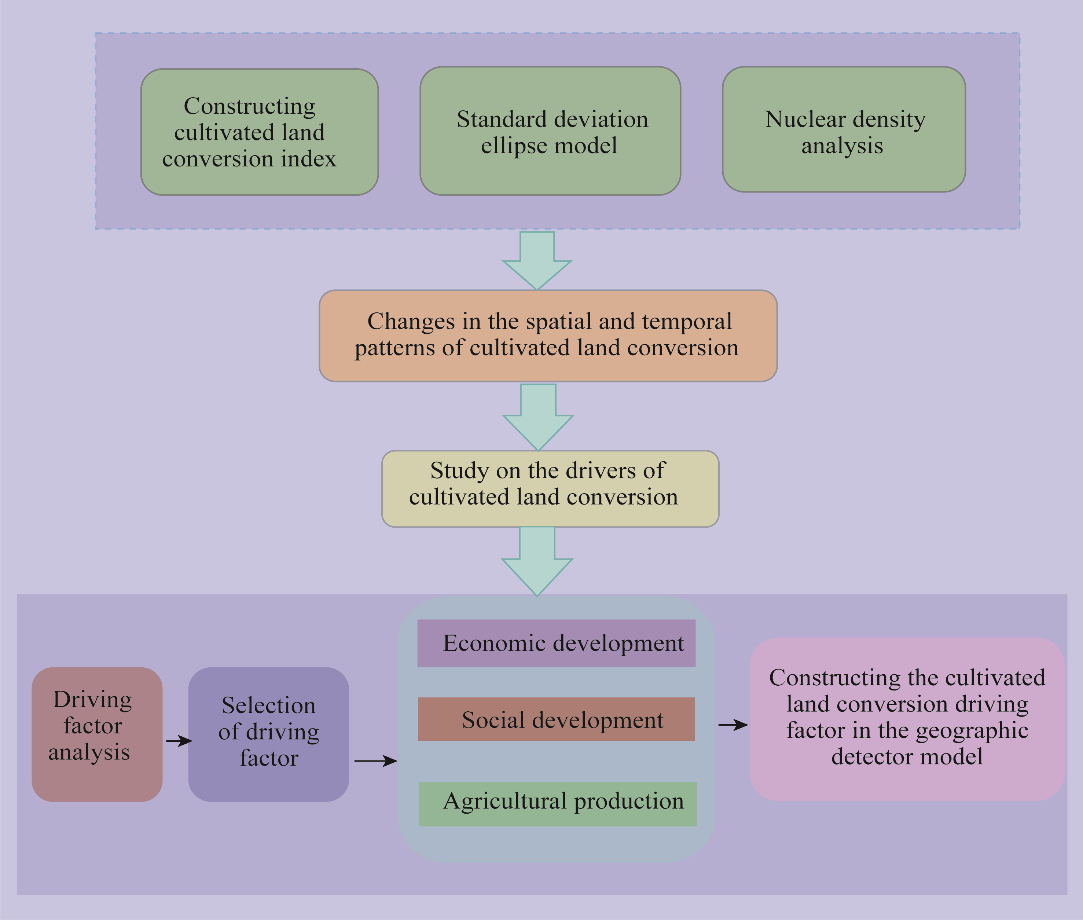
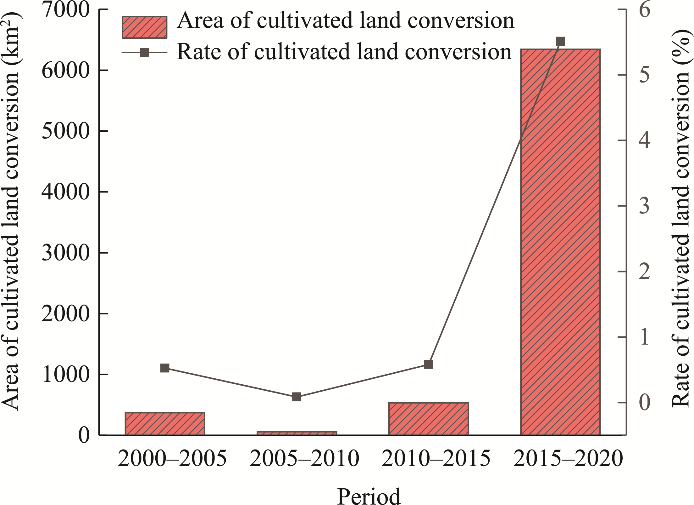
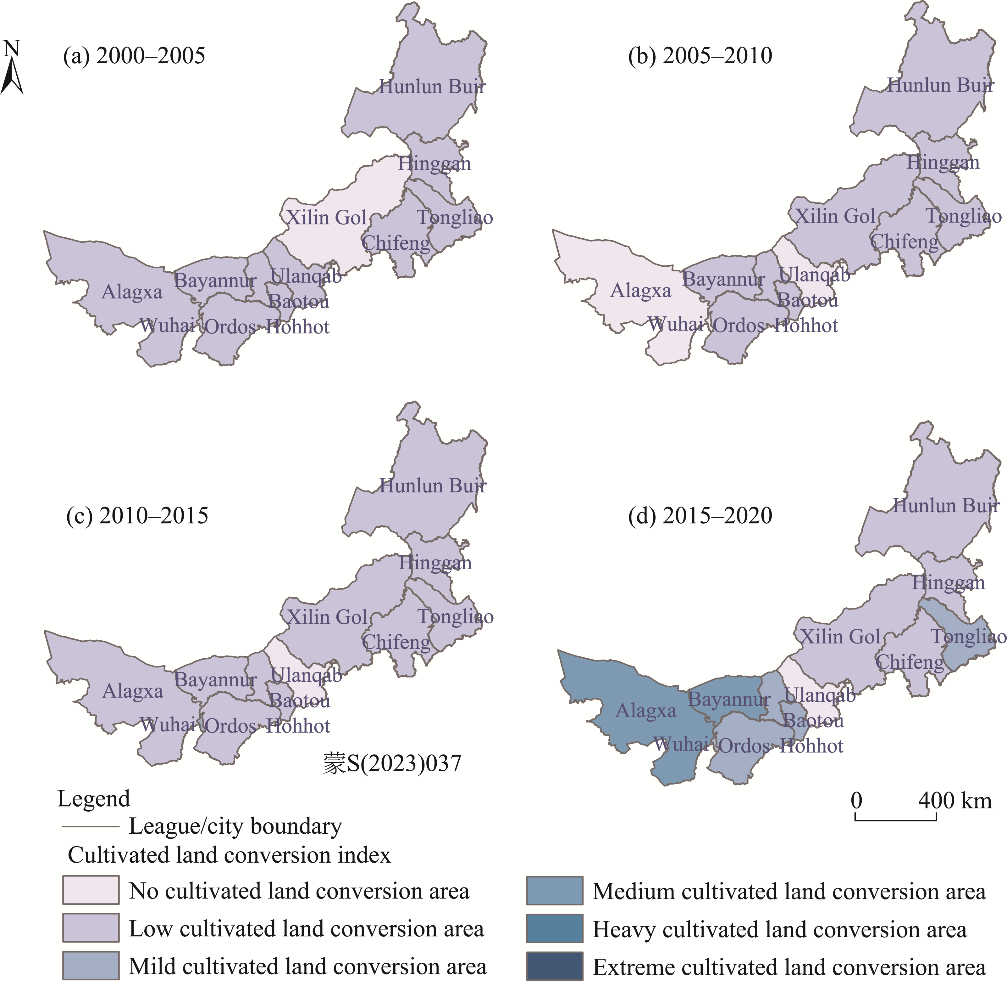
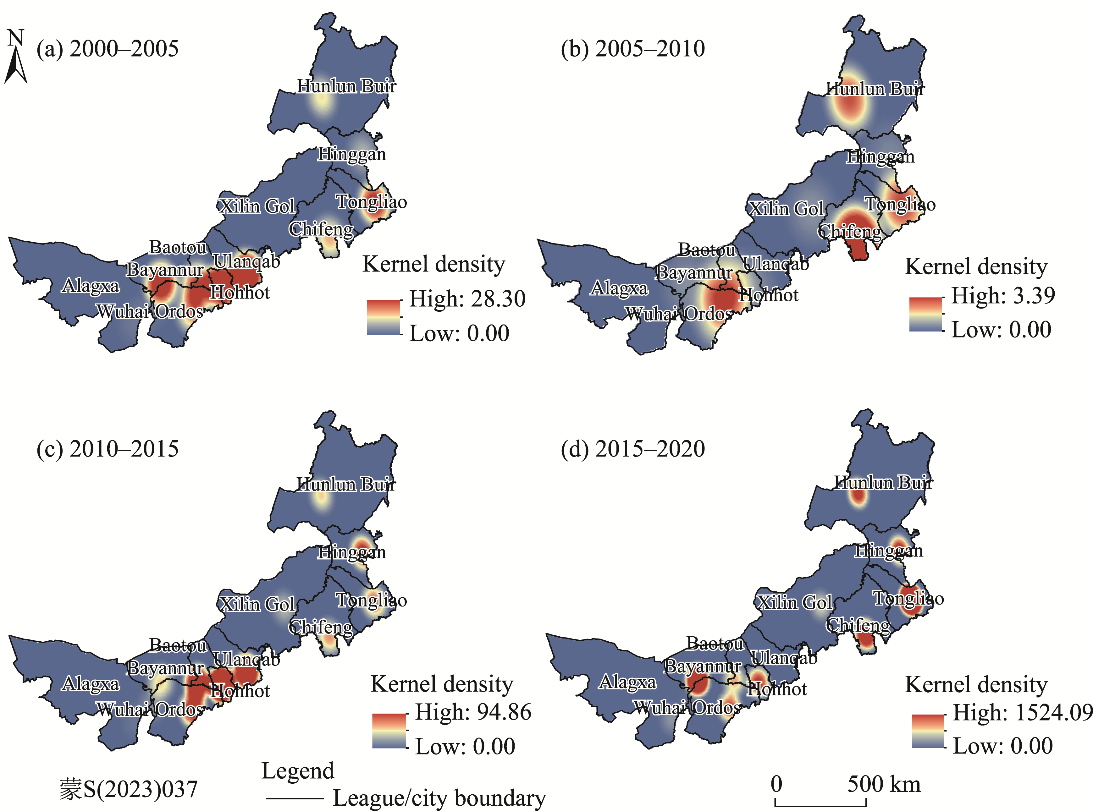
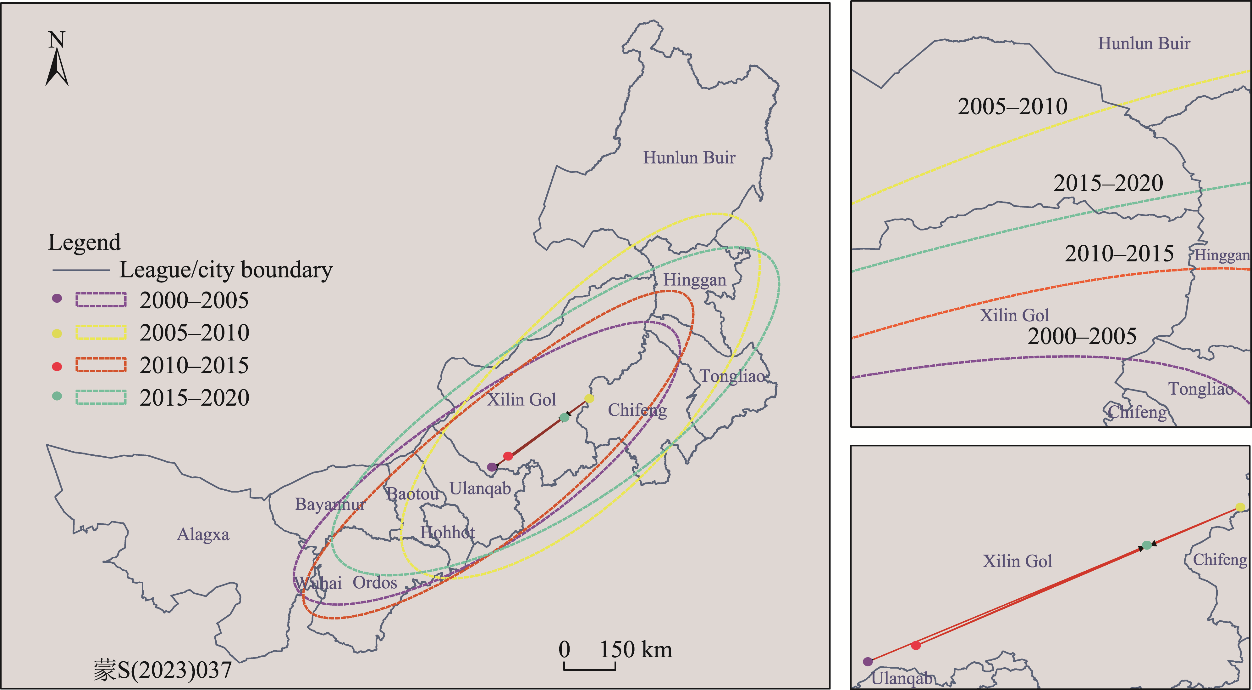
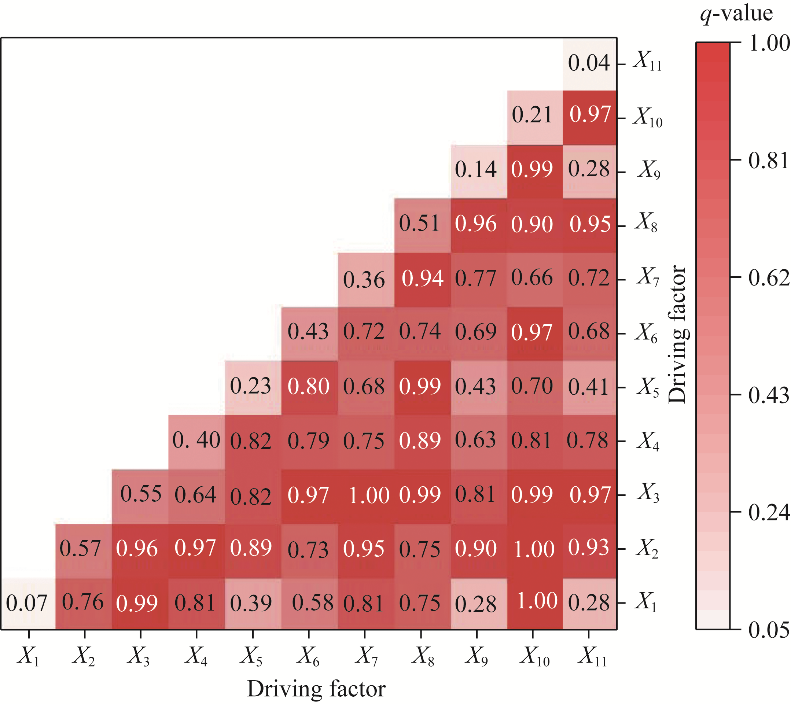
Abstract Protection and optimization of cultivated land resources are of great significance to national food security. Cultivated land conversion in northern China has increased in recent years due to the industrialization and urbanization of society. However, the assessment of cultivated land conversion in this area is insufficient, posing a potential risk to cultivated land resources. This study evaluated the evolution and spatiotemporal patterns of cultivated land conversion in Inner Mongolia Autonomous Region, China, and the driving factors to improve rational utilization and to protect cultivated land resources. The spatiotemporal patterns of cultivated land conversion in Inner Mongolia were analyzed using the cultivated land conversion index, kernel density analysis, a standard deviation ellipse model, and a geographic detector. Results showed that from 2000 to 2020, the trends in cultivated land conversion area and rate in Inner Mongolia exhibited fluctuating growth, with the total area of cultivated land conversion reaching 7307.59 km2 at a rate of 6.69%. Spatial distribution of cultivated land conversion was primarily concentrated in the Hetao Plain, Nengjiang Plain, Liaohe Plain, and the Hohhot-Baotou-Ordos urban agglomeration. Moreover, the standard deviational ellipse of cultivated land conversion in Inner Mongolia exhibited a directional southwest-northeast-southwest-northeast distribution, with the northeast-southwest direction identified as the main driving force of spatial change in cultivated land conversion. Meanwhile, cultivated land conversion exhibited an increase-decrease-increase change process, indicating that spatial distribution of cultivated land conversion in Inner Mongolia became gradually apparent within the study period. The geographic detector results further revealed that the main driving factors of cultivated land conversion in Inner Mongolia were the share of secondary and tertiary industries and per-unit area yield of grain, with explanatory rates of 57.00%, 55.00%, and 51.00%, respectively. Additionally, improved agricultural production efficiency and the coordinated development of population urbanization and industry resulted in cultivated land conversion. Collectively, the findings of this study indicated that, from 2000 to 2020, the cultivated land conversion in Inner Mongolia was significant and fluctuated in time, and had strong spatial heterogeneity. The primary drivers of these events included the effects of agriculture, population, and social economy.
|
|
Received: 26 March 2024
Published: 30 September 2024
|
|
|
|
Corresponding Authors:
*ZHOU Ruiping (E-mail: rpzhou@126.com)
|
|
|
| [1] |
Aodenggaowa. 2008. Study on the change process of cultivated land resources and food production security in Inner Mongolia. Chinese Journal of Eco-Agriculture, 16(4): 1000-1004. (in Chinese)
|
|
|
| [2] |
Bao Y C, Hao R M, Zheng Y, et al. 2015. Try to make good use of land resources to promote the integration of production and agriculture and promote rural revitalization-A case study of Junge Banner, Inner Mongolia Autonomous Region. Western Resources, 12(1): 177-181, 184. (in Chinese)
|
|
|
| [3] |
Cheng R K, Yang C L, Wu J F, et al. 2007. Mineral resources in Xilin Gol League, Inner Mongolia. In:Proceedings of the 3rd National Symposium on Metallogenic Theory and Prospecting Methods. Kaikou: Chinese Society for Mineralogy Petrology and Geochemistry, 492-493. (in Chinese)
|
|
|
| [4] |
Cui K, Shoemaker S P. 2018. A look at food security in China. NPJ Science of Food, 2: 4, doi: 10.1038/s41538-018-0012-x.
pmid: 31304254
|
|
|
| [5] |
Furuseth O J, Pierce J T. 1982. A comparative analysis off arm land preservation programmes in North America. Canadian Geographies/Géographies Canadiennes, 26(3): 191-206.
|
|
|
| [6] |
Gai Z X, Xu Y, Du G M. 2023. Spatio-temporal differentiation and driving factors of carbon storage in cultivated land-use transition. Sustainability, 15(5): 3897, doi: 10.3390/su15053897.
|
|
|
| [7] |
Gasparri N I, Grau H R, Sacchi L V. 2015. Determinants of the spatial distribution of cultivatedlandin the NorthArgentine Dry Chacoina multi-decadal study. Journal of Arid Environments, 123: 31-39.
|
|
|
| [8] |
Gegentana, Wang T C, Wang J H, et al. 2024. Returning farmland to forest canopy coverage project in Inner Mongolia satellite remote sensing monitoring. Bulletin of Surveying and Mapping, 24(6): 139-145. (in Chinese)
|
|
|
| [9] |
Hao R, Chai L. 2014. Analysis on the correlation between cultivated land change and social and economic development in Hohhot. Journal of Inner Mongolia Normal University, 43(2): 121-124, 138. (in Chinese)
|
|
|
| [10] |
Herzberger A, Chung G M, Kapsar K, et al. 2019. Telecoupled food trade affects pericoupled trade and intracoupled production. Sustainability, 11(10): 2908, doi: 10.3390/su11102908.
|
|
|
| [11] |
Huang S Q, Xi F R, Chen Y M, et al. 2021. Land use optimization and simulation of low-carbon-oriented-a case study of Jinhua, China. Land, 10(10): 1020, doi: 10.3390/land10101020.
|
|
|
| [12] |
Huo K, Ruan Y F, Fan H Z, et al. 2022. Spatial-temporal variation characteristics of cultivated land and controlling factors in the Yangtze River Delta region of China. Frontiers in Environmental Science, 10: 871482, doi: 10.3389/fenvs.2022.871482.
|
|
|
| [13] |
Jiang L, Deng X Z, Seto K C. 2012. Multi-level modeling of urban expansion and cultivated land conversion for urban hotspot counties in China. Landscape and Urban Planning, 108(2-4): 131-139.
|
|
|
| [14] |
Kiani M. 2016. Soil quality dynamics and spatial heterogeneity in grasslands and cropping systems in western Canada. University of Alberta. Master of Science. [2023-12-12]. https://era.library.ualberta.ca/items/be1d4fdf-f6bb-45bf-968a-dc98612f0008.
|
|
|
| [15] |
Li D, He L Y, Qu J G, et al. 2022a. Spatial evolution of cultivated land in the Heilongjiang Province in China from 1980 to 2015. Environmental Monitoring and Assessment, 194(6): 444, doi: 10.1007/s10661-022-10119-3.
|
|
|
| [16] |
Li H P, Tian D R, Tan J B. 2022b. Spatial and temporal pattern of non-agricultural farmland in Yan'an City from 2000 to 2020 and its influencing factors. Bulletin of Soil and Water Conservation, 42(4): 330-337, 372. (in Chinese)
|
|
|
| [17] |
Li J H, Zhou K C, Dong H M, et al. 2020. Cultivated land change, driving forces and its impact on landscape pattern changes in the Dongting Lake Basin. International Journal of Environmental Research and Public Health, 17(21): 7988, doi: 10.3390/ijerph17217988.
|
|
|
| [18] |
Li W B, Wang D Y, Liu S H, et al. 2019. Measuring urbanization-occupation and internal conversion of peri-urban cultivated land to determine changes in the peri-urban agriculture of the black soil region. Ecological Indicators, 102: 328-337.
|
|
|
| [19] |
Li X G, Xiao P N, Zhou Y, et al. 2022c. The spatiotemporal evolution characteristics of cultivated land multifunction and its trade-off/synergy relationship in the two lake plains. International Journal of Environmental Research and Public Health, 19(22): 15040, doi: 10.3390/ijerph192215040.
|
|
|
| [20] |
Li Y H, Li Y R, Westlund H, et al. 2015. Urban-rural transformation in relation to cultivated land conversion in China: Implications for optimizing land use and balanced regional development. Land Use Policy, 47: 218-224.
|
|
|
| [21] |
Liang H. 2023. A study on the driving force of non-agricultural billion of material land and its relationship with economic development in Wuhan. MSc Thesis. Taian: Shandong Agricultural University. (in Chinese)
|
|
|
| [22] |
Lin X F, Hui F. 2022. Spatial-temporal evolution and driving forces of cultivated land based on the PLUS Model: A case sudy of Haikou City, 1980-2020. Sustainability, 14(21): 14284, doi: 10.3390/su142114284.
|
|
|
| [23] |
Liu X, Shi L, Qian H Y, et al. 2020. New problems of food security in Northwest China: A sustainability perspective. Land Degradation & Development, 31(8): 975-989.
|
|
|
| [24] |
Newman L, Powell L J, Wittman H. 2015. Landscapes of food production in Agriburbia: Farmland protection and local food movements in British Columbia. Journal of Rural Studies, 39: 99-110.
|
|
|
| [25] |
Nguyen T T, Tran V T, Nguyen T T, et al. 2021. Farming efficiency, cropland rental market and income effect: Evidence from panel data for rural Central Vietnam. Economic Analysis and Policy, 48(1): 207-248.
|
|
|
| [26] |
Nitsch H, Osterburg B, Roggendorf W, et al. 2015. Cross compliance and the protection of grassland-illustrative analyses of land use transitions between permanent grassland and arable land in German regions. Land Use Policy, 29(2): 440-448.
|
|
|
| [27] |
Qin S, Han Z Y, Chen H, et al. 2022. High-quality development of Chinese agriculture under factor misallocation. International Journal of Environmental Research and Public Health, 19(16): 9804, doi: 10.3390/ijerph19169804.
|
|
|
| [28] |
Quasem M A. 2011. Conversion of agricultural land to non-agricultural use sin Bangladesh: Extentand determinants. The Bangladesh Development Studies, 34(1): 59-85.
|
|
|
| [29] |
Song W, Pijanowski B C. 2014. The effects of China's cultivated land balance program on potential land productivity at a national scale. Applied Geography, 46: 158-170.
|
|
|
| [30] |
Song Y T. 2017. Quantitative analysis of the relationship between economic growth, urbanization and non-agricultural land-A case study of Jiangsu Province. Hubei Agricultural Science, 56(15): 2975-2978. (in Chinese)
|
|
|
| [31] |
Sun X Q, Xiang P C, Cong K X. 2023. Research on early warning and control measures for arable land resource security. Land Use Policy, 128: 106601, doi: 10.1016/J.LANDUSEPOL.2023.106601.
|
|
|
| [32] |
Tan Y Z, Wu C F, Mou Y M. 2004. Macro-analysis of cultivated land non-agriculturaization in Zhejiang. Scientia Geographica Sinica, 24(1): 14-19. (in Chinese)
|
|
|
| [33] |
Thompson A W, Prokopy L S. 2009. Tracking urban sprawl: Using spatial data to inform farmland preservation policy. Land Use Policy, 26(2): 194-202.
|
|
|
| [34] |
Wang X Y, Awadelkarim O O. 2024. Comparison of Si and SiC MOSFETs responses to electrical stress and the observation of parameter recovery in SiC MOSFET by stress superposition. Engineering Research Express, 6(3): 035324, doi: 10.1088/2631-8695/ad6395.
|
|
|
| [35] |
Wang X W, Cheng H. 2022. Dynamic changes of cultivated land use and grain production in the lower reaches of the Yellow River based on GlobeLand30. Frontiers in Environmental Science, 10, doi: 10.3389/FENVS.2022.974812.
|
|
|
| [36] |
Wang Y. 2012. Analysis on optimization of non-agricultural allocation of cultivated land by using tradeable farmland development right. Journal of Fujian Agriculture and Forestry University (Philosophy and Social Sciences Edition), 15(2): 25-30. (in Chinese)
|
|
|
| [37] |
Wu J K, Zhang S Q, Hao W, et al. 2015. Actual evapotranspiration in Suli alpine meadow in northeastern edge of Qinghai-Tibet Plateau, China. Advances in Meteorology, 2015: 593649, doi: 10.1155/2015/593649.
|
|
|
| [38] |
Wu X, Wang Y J, Zhu H B. 2022. Does economic growth lead to an increase in cultivated land pressure? Evidence from China. Land, 11(9): 1515, doi: 10.3390/LAND11091515.
|
|
|
| [39] |
Wu X P, Feng Y W, Ma H T, et al. 2015. Characterization of new microsatellite loci from the razor clam (Sinonovacula constricta) and transferability to related species. Biochemical Systematics and Ecology, 61: 175-178.
|
|
|
| [40] |
Wu Y Z, Shan L P, Guo Z, et al. 2017. Cultivated land protection policies in China facing 2030: Dynamic balance system versus basic farmland zoning. Habitat International, 69: 126-138.
|
|
|
| [41] |
Xu H Z. 2010. Market failure and loss of ecological value of cultivated land in non-agricultural process: A case study of Jiangsu Province. Journal of Chinese Ecological Agriculture, 18(6): 1366-1371. (in Chinese)
|
|
|
| [42] |
Xu J C, Hao J, Wu X G. 2020. Based on coupling factors of Inner Mongolia national spatial protection development research. Journal of Arid Land Resources and Environment, 34(12): 98-104. (in Chinese)
|
|
|
| [43] |
Yang Y N, Li J, Wang L, et al. 2022. The Impact of urbanization on the relationship between carbon storage supply and demand in mega-urban agglomerations and response measures: A case of Yangtze River Delta region, China. International Journal of Environmental Research and Public Health, 19(21): 13768, doi: 10.3390/IJERPH192113768.
|
|
|
| [44] |
Ye Y H. 2015. Driving forces of farmland non-agricultural research in China. Journal of Scientific Decision-Making, 7(9): 33-50. (in Chinese)
|
|
|
| [45] |
Yue Z H, Chang F, Li L, et al. 2015. Analysis of cultivated land non-agricultural conversion and its driving factors in Chengdu. Journal of Mianyang Normal University, 11: 102-108.
|
|
|
| [46] |
Zhang S, Zhang H B, Gu X H, et al. 2022. Monitoring the spatio-temporal changes of non-cultivated land via long-time series remote sensing images in Xinghua. IEEE Access, 10: 84518-84534.
|
|
|
| [47] |
Zhang S Q, Li Y P, Liu Z, et al. 2023. Towards a decoupling between economic expansion and carbon dioxide emissions of the transport sector in the Yellow River Basin. Sustainability, 15(5): 4152, doi: 10.3390/SU15054152.
|
|
|
| [48] |
Zhang X Y, Xie X P, Zhang A L. 2014. Wuhan City space disequilibrium development of non-agriculturalization of farmland and spatial diffusion path analysis. Journal of Natural Resources, 29(10): 1649-1659. (in Chinese)
|
|
|
| [49] |
Zhang Y X, Wang Y K, Fu B, et al. 2020. Changes in cultivated land patterns and driving forces in the Three Gorges Reservoir area, China, from 1992 to 2015. Journal of Mountain Science, 17(8): 203-215.
|
|
|
| [50] |
Zhao C W, Pu L J. 2007. Research on cultivated land non-agricultural conversion and economic development based on provincial data. Journal of Jiangxi Agricultural University, 29(4): 644-649. (in Chinese)
|
|
|
| [51] |
Zhao Y Q. 2017. Analysis of driving factors of farmland non-agricultural conversion based on social combustion theory. Hubei Agricultural Sciences, 56(5): 989-992. (in Chinese)
|
|
|
| [52] |
Zhou Y, Li X H, Liu Y S. 2020. Land use change and driving factors in rural China during the period 1995-2015. Land Use Policy, 99: 105048, doi: 10.1016/j.landusepol.2020.105048.
|
|
|
| [53] |
Zhou Y, Li X H, Liu Y S. 2021. Cultivated land protection and rational use in China. Land Use Policy, 106: 105454, doi: 10.1016/j.landusepol.2021.105454.
|
|
|
|
Viewed |
|
|
|
Full text
|
|
|
|
|
Abstract
|
|
|
|
|
Cited |
|
|
|
|
| |
Shared |
|
|
|
|
| |
Discussed |
|
|
|
|