| Research article |
|


|
|
|
| Assessing the response of dryland barley yield to climate variability in semi-arid regions, Iran |
Mohammad KHEIRI1, Jafar KAMBOUZIA1,*( ), Reza DEIHIMFARD1, Saghi M MOGHADDAM2, Seyran ANVARI1 ), Reza DEIHIMFARD1, Saghi M MOGHADDAM2, Seyran ANVARI1 |
1Department of Agroecology, Environmental Sciences Research Institute, Shahid Beheshti University, Tehran 1983963113, Iran
2Faculty of Environmental Sciences, Czech University of Life Sciences Prague, Prague 16500, Czech Republic |
|
|
|
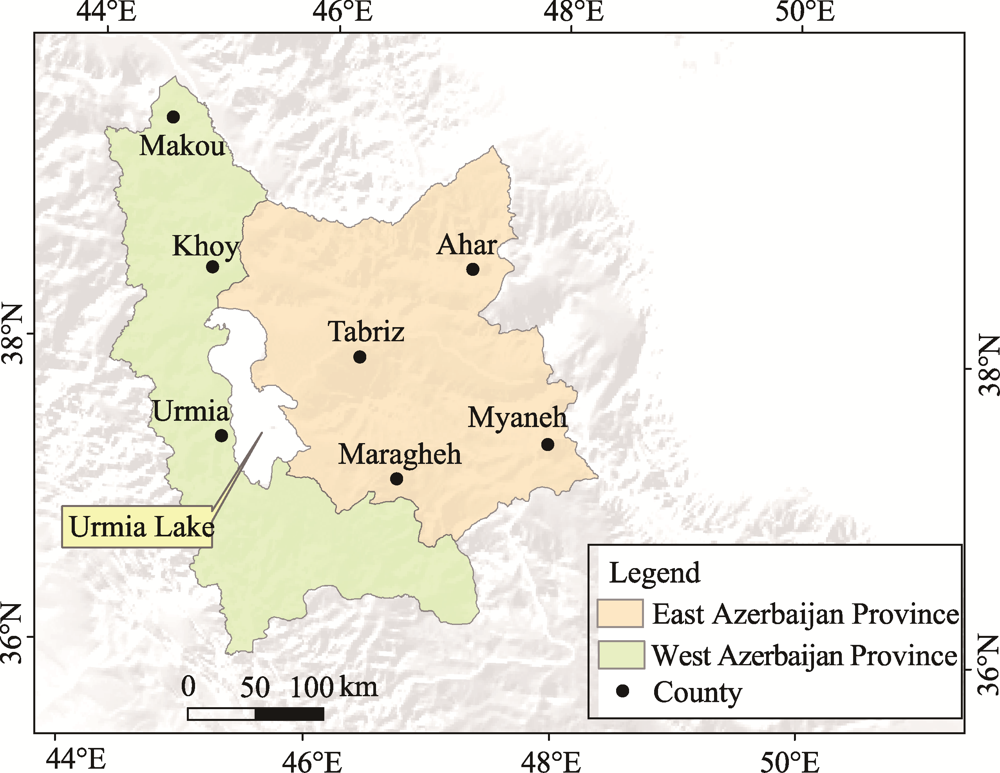
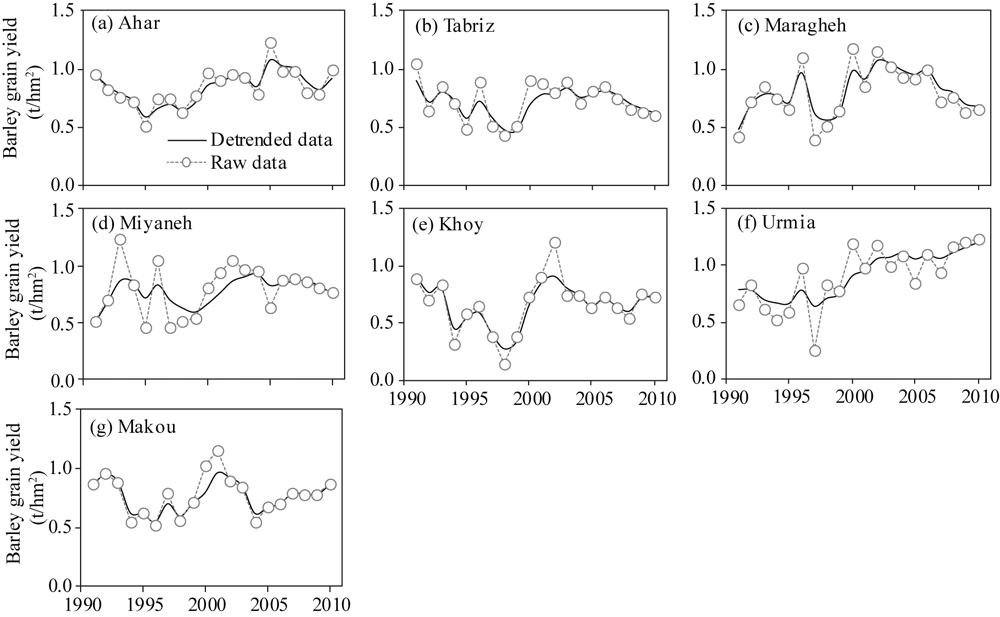
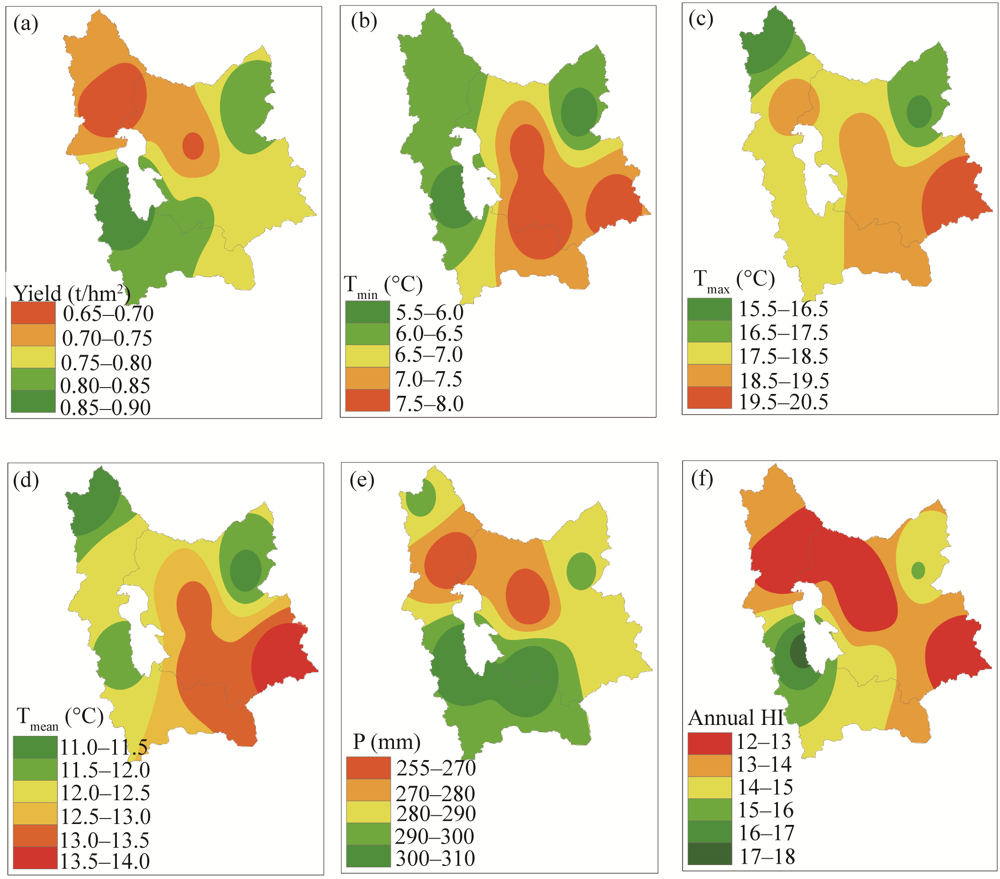
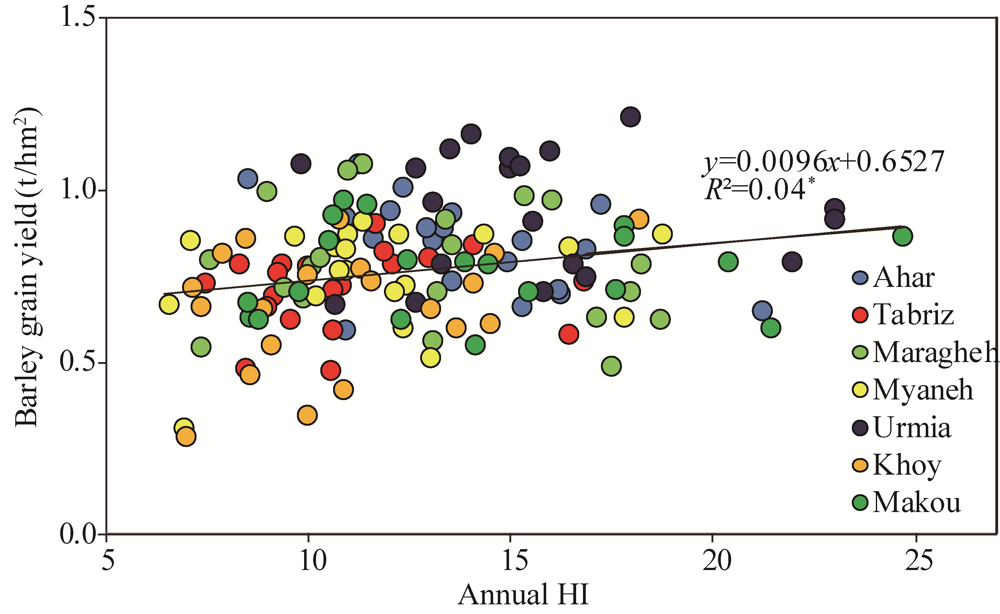
Abstract Precipitation and temperature are the most abiotic factors that greatly impact the yield of crop, particularly in dryland. Barley, as the main cereal is predominantly cultivated in dryland and the livelihood of smallholders depends on the production of this crop, particularly in arid and semi-arid regions. This study aimed to investigate the response of the grain yield of dryland barley to temperature and precipitation variations at annual, seasonal and monthly scales in seven counties of East and West Azerbaijan provinces in northwestern Iran during 1991-2010. Humidity index (HI) was calculated and its relationship with dryland barley yield was evaluated at annual and monthly scales. The results showed that the minimum, maximum and mean temperatures increased by 0.19°C/a, 0.11°C/a and 0.10°C/a, respectively, while annual precipitation decreased by 0.80 mm/a during 1991-2010. Climate in study area has become drier by 0.22/a in annual HI during the study period. Negative effects of increasing temperature on the grain yield of dryland barley were more severe than the positive effects of increasing precipitation. Besides, weather variations in April and May were related more to the grain yield of dryland barley than those in other months. The grain yield of dryland barley was more drastically affected by the variation of annual minimum temperature comparing with other weather variables. Furthermore, our findings illustrated that the grain yield of dryland barley increased by 0.01 t/hm2 for each unit increase in annual HI during 1991-2010. Finally, any increase in the monthly HI led to crop yield improvement in the study area, particularly in the drier counties, i.e., Myaneh, Tabriz and Khoy in Iran.
|
|
Received: 24 March 2021
Published: 10 September 2021
|
|
Corresponding Authors:
*Jafar KAMBOUZIA (E-mail: J_Kambouzia@sbu.ac.ir)
|
|
|
| [1] |
Alexandrov V A, Hoogenboom G. 2001. Climate variation and crop production in Georgia, USA, during the twentieth century. Climate Research, 17:33-43.
doi: 10.3354/cr017033
|
|
|
| [2] |
Asseng S, Foster I, Turner N C. 2011. The impact of temperature variability on wheat yields. Global Change Biology, 17(2):997-1012.
doi: 10.1111/gcb.2010.17.issue-2
|
|
|
| [3] |
Asseng S, Ewert F, Martre P, et al. 2015. Rising temperatures reduce global wheat production. Nature Climate Change, 5:143-147.
doi: 10.1038/nclimate2470
|
|
|
| [4] |
Bannayan M, Sanjani S, Alizadeh A, et al. 2010. Association between climate indices, aridity index and rainfed crop yield in northeast of Iran. Field Crops Research, 118(2):105-114.
doi: 10.1016/j.fcr.2010.04.011
|
|
|
| [5] |
Bathiany S, Dakos V, Scheffer M, et al. 2018. Climate models predict increasing temperature variability in poor countries. Science Advances, 4(5), doi: 10.1126/sciadv.aar5809.
doi: 10.1126/sciadv.aar5809
|
|
|
| [6] |
Bisbis M B, Gruda N, Blanke M. 2018. Potential impacts of climate change on vegetable production and product quality-A review. Journal of Cleaner Production, 170:1602-1620.
doi: 10.1016/j.jclepro.2017.09.224
|
|
|
| [7] |
Brisson N, Gate P, Gouache D, et al. 2010. Why are wheat yields stagnating in Europe? A comprehensive data analysis for France. Field Crops Research, 119(1):201-212.
doi: 10.1016/j.fcr.2010.07.012
|
|
|
| [8] |
Cammarano D, Ceccarelli S, Grando S, et al. 2019. The impact of climate change on barley yield in the Mediterranean basin. European Journal of Agronomy, 106:1-11.
doi: 10.1016/j.eja.2019.03.002
|
|
|
| [9] |
Chen F W, Liu C W. 2012. Estimation of the spatial rainfall distribution using inverse distance weighting (IDW) in the middle of Taiwan. Paddy and Water Environment, 10(3):209-222.
doi: 10.1007/s10333-012-0319-1
|
|
|
| [10] |
Chen Y, Zhang Z, Wang P, et al. 2016. Identifying the impact of multi-hazards on crop yield-A case for heat stress and dry stress on winter wheat yield in northern China. European Journal of Agronomy, 73:55-63.
doi: 10.1016/j.eja.2015.10.009
|
|
|
| [11] |
Chen Y, Zhang Z, Tao F L, et al. 2017. Impacts of heat stress on leaf area index and growth duration of winter wheat in the North China Plain. Field Crops Research, 222:230-237.
doi: 10.1016/j.fcr.2017.06.007
|
|
|
| [12] |
Croitoru A E, Piticar A, Imbroane A M, et al. 2013. Spatiotemporal distribution of aridity indices based on temperature and precipitation in the extra-Carpathian regions of Romania. Theoretical and Applied Climatology, 112(3):597-607.
doi: 10.1007/s00704-012-0755-2
|
|
|
| [13] |
d'Amour C B, Wenz L, Kalkuhl M, et al. 2016. Teleconnected food supply shocks. Environmental Research Letters, 11(3):035007.
|
|
|
| [14] |
Dawson I K, Russell J, Powell W, et al. 2015. Barley: a translational model for adaptation to climate change. New Phytologist, 206(3):913-931.
doi: 10.1111/nph.13266
pmid: 25605349
|
|
|
| [15] |
Esri. 2016. ArcGIS Desktop: Release 10.4. Redlands:Environmental Systems Research Institute.
|
|
|
| [16] |
Farooq M, Hussain M, Siddique K H. 2014. Drought stress in wheat during flowering and grain filling periods. Critical Reviews in Plant Sciences, 33(4):331-349.
doi: 10.1080/07352689.2014.875291
|
|
|
| [17] |
Fellmann T, Hélaine S, Nekhay O. 2014. Harvest failures, temporary export restrictions and global food security: the example of limited grain exports from Russia, Ukraine and Kazakhstan. Food Security, 6:727-742.
doi: 10.1007/s12571-014-0372-2
|
|
|
| [18] |
Hatfield J L, Boote K J, Kimball B A, et al. 2011. Climate impacts on agriculture: implications for crop production. Agronomy Journal, 103(2):351-370.
doi: 10.2134/agronj2010.0303
|
|
|
| [19] |
Jeong H G, Ahn J B, Lee J, et al. 2020. Improvement of daily precipitation estimations using PRISM with inverse-distance weighting. Theoretical and Applied Climatology, 139(3):923-934.
doi: 10.1007/s00704-019-03012-6
|
|
|
| [20] |
Joseph J, LaViola J R. 2003. An Experiment Comparing Double Exponential Smoothing and Kalman Filter-based Predictive Tracking Aalgorithms. Los Angeles: IEEE, 283.
|
|
|
| [21] |
Karimi V, Karami E, Keshavarz M. 2018. Climate change and agriculture: Impacts and adaptive responses in Iran. Journal of Integrative Agriculture, 17(1):1-15.
doi: 10.1016/S2095-3119(17)61794-5
|
|
|
| [22] |
Kheiri M, Soufizadeh S, Ghaffari A, et al. 2017. Association between temperature and precipitation with dryland wheat yield in northwest of Iran. Climatic Change, 141(4):703-717.
doi: 10.1007/s10584-017-1904-5
|
|
|
| [23] |
Kheiri M, Soufizadeh S, Moghaddam S M, et al. 2021. Exploring the impact of weather variability on phenology, length of growing period, and yield of contrast dryland wheat cultivars. Agricultural Research, https://doi.org/10.1007/s40003-020-00523-x
|
|
|
| [24] |
Lizaso J I, Ruiz-Ramos M, Rodriguez L, et al. 2018. Impact of high temperatures in maize: Phenology and yield components. Field Crops Research, 216:129-140.
doi: 10.1016/j.fcr.2017.11.013
|
|
|
| [25] |
Lobell D B, Schlenker W, Costa-Roberts J. 2011. Climate trends and global crop production since 1980. Science, 333:616-620.
doi: 10.1126/science.1204531
pmid: 21551030
|
|
|
| [26] |
MAJ (Ministry of Agriculture-Jihad). 2018. Ministry of agriculture-Jahad. Distribution of cropping area and crop productivity in Iran. [2020-12-20]. https://www.maj.ir/Dorsapax/userfiles/Sub65/Amarnamehj1-97-98-site.pdf
|
|
|
| [27] |
Macdonald R B, Hall F G. 1980. Global crop monitoring forecasting. Science, 208(4445):670-679.
pmid: 17771086
|
|
|
| [28] |
Maleika W. 2020. Inverse distance weighting method optimization in the process of digital terrain model creation based on data collected from a multibeam echosounder. Applied Geomatics, 12(4):397-407.
doi: 10.1007/s12518-020-00307-6
|
|
|
| [29] |
Mesgaran M B, Madani K, Hashemi H, et al. 2017. Iran's land suitability for agriculture. Scientific Reports, 7(1):1-12.
doi: 10.1038/s41598-016-0028-x
|
|
|
| [30] |
Narasimhan B, Srinivasan R. 2005. Development and evaluation of soil moisture deficit index (SMDI) and evapotranspiration deficit index (ETDI) for agricultural drought monitor. Agricultural and Forest Meteorology, 133(1-4):69-88.
doi: 10.1016/j.agrformet.2005.07.012
|
|
|
| [31] |
Nio S, Cawthray G, Wade L, et al. 2011. Pattern of solutes accumulated during leaf osmotic adjustment as related to duration of water deficit for wheat at the reproductive stage. Plant Physiology and Biochemistry, 49(10):1126-1137.
doi: 10.1016/j.plaphy.2011.05.011
pmid: 21741263
|
|
|
| [32] |
Padakandla S R. 2016. Climate sensitivity of crop yields in the former state of Andhra Pradesh, India. Ecological Indicators, 70:431-438.
doi: 10.1016/j.ecolind.2016.06.008
|
|
|
| [33] |
Plaut Z, Butow B J, Blumenthal C S, et al. 2004. Transport of dry matter into developing wheat kernels and its contribution to grain yield under post-anthesis water deficit and elevated temperature. Field Crops Research, 86(2-3):185-198.
doi: 10.1016/j.fcr.2003.08.005
|
|
|
| [34] |
Qader S H, Dash J, Atkinson P M. 2018. Forecasting wheat and barley crop production in arid and semi-arid regions using remotely sensed primary productivity and crop phenology: A case study in Iraq. Science of the Total Environment, 613- 614:250-262.
|
|
|
| [35] |
Rahimi J, Malekian A, Khalili A. 2019. Climate change impacts in Iran: assessing our current knowledge. Theoretical and Applied Climatology, 135(1):545-564.
doi: 10.1007/s00704-018-2395-7
|
|
|
| [36] |
Rosenzweig C, Tubiello F N. 1996. Effects of changes in minimum and maximum temperature on wheat yields in the central USA simulation study. Agricultural and Forest Meteorology, 80(2-4):215-230.
doi: 10.1016/0168-1923(95)02299-6
|
|
|
| [37] |
Schierhorn F, Hofmann M, Adrian I, et al. 2020. Spatially varying impacts of climate change on wheat and barley yields in Kazakhstan. Journal of Arid Environments, 178:104164.
|
|
|
| [38] |
Senapati N, Stratonovitch P, Paul M J, et al. 2019. Drought tolerance during reproductive development is important for increasing wheat yield potential under climate change in Europe. Journal of Experimental Botany, 70(9):2549-2560.
doi: 10.1093/jxb/ery226
pmid: 29901813
|
|
|
| [39] |
Shirmohammadi B, Malekian A, Salajeghah A, et al. 2020. Scenario analysis for integrated water resources management under future land use change in the Urmia Lake region, Iran. Land Use Policy, 90:104299.
|
|
|
| [40] |
Siebert S, Ewert F. 2014. Future crop production threatened by extreme heat. Environmental Research Letters, 9(4):041001.
|
|
|
| [41] |
Tabari H, Talaee P H, Nadoushani S M, et al. 2014. A survey of temperature and precipitation based aridity indices in Iran. Quaternary International, 345:158-166.
doi: 10.1016/j.quaint.2014.03.061
|
|
|
| [42] |
Tao F L, Zhang Z, Zhang S, et al. 2015. Heat stress impacts on wheat growth and yield were reduced in the Huang-Huai-Hai Plain of China in the past three decades. European Journal of Agronomy, 71:44-52.
doi: 10.1016/j.eja.2015.08.003
|
|
|
| [43] |
Tao F L, Xiao D P, Zhang S, et al. 2017. Wheat yield benefited from increases in minimum temperature in the Huang-Huai-Hai Plain of China in the past three decades. Agricultural and Forest Meteorology, 239:1-14.
doi: 10.1016/j.agrformet.2017.02.033
|
|
|
| [44] |
Tewolde H, Fernandez C J, Erickson C A. 2006. Wheat cultivars adapted to post heading high temperature stress. Journal of Agronomy and Crop Science, 192(2):111-120.
doi: 10.1111/jac.2006.192.issue-2
|
|
|
| [45] |
Ugarte C, Calderini D F, Slafer G A. 2007. Grain weight and grain number responsiveness to pre-anthesis temperature in wheat, barley and triticale. Field Crops Research, 100(2-3):240-248.
doi: 10.1016/j.fcr.2006.07.010
|
|
|
| [46] |
Xiao D P, Shen Y J, Zhang H, et al. 2016. Comparison of winter wheat yield sensitivity to climate variables under irrigate and rain-fed conditions. Frontiers in Earth Science, 10:444-454.
|
|
|
| [47] |
Xiao D P, Bai H Z, Liu D L. 2018. Impact of future climate change on wheat production: a simulated case for China's wheat system. Sustainability, 10(4):1277.
doi: 10.3390/su10041277
|
|
|
| [48] |
Yang X H, Xie X J, Liu D L, et al. 2015. Spatial interpolation of daily rainfall data for local climate impact assessment over greater Sydney region. Advances in Meteorology, 563629.
|
|
|
| [49] |
Zarghami M, Abdi A, Babaeian I, et al. 2011. Impacts of climate change on runoffs in East Azerbaijan, Iran. Global and Planetary Change, 78(3-4):137-146.
doi: 10.1016/j.gloplacha.2011.06.003
|
|
|
| [50] |
Zhao C, Liu B, Piao S L, et al. 2017. Temperature increase reduces global yields of major crops in four independent estimates. Proceeding of the National Academy of Sciences of the United States of America, 114(35):9326-9331.
|
|
|
|
Viewed |
|
|
|
Full text
|
|
|
|
|
Abstract
|
|
|
|
|
Cited |
|
|
|
|
| |
Shared |
|
|
|
|
| |
Discussed |
|
|
|
|