| Research article |
|


|
|
|
| Land use change and its driving factors in the ecological function area: A case study in the Hedong Region of the Gansu Province, China |
WEI Zhudeng( ), DU Na, YU Wenzheng ), DU Na, YU Wenzheng |
| School of Geographical Science, Nanjing University of Information Science & Technology, Nanjing 210044, China |
|
|
|
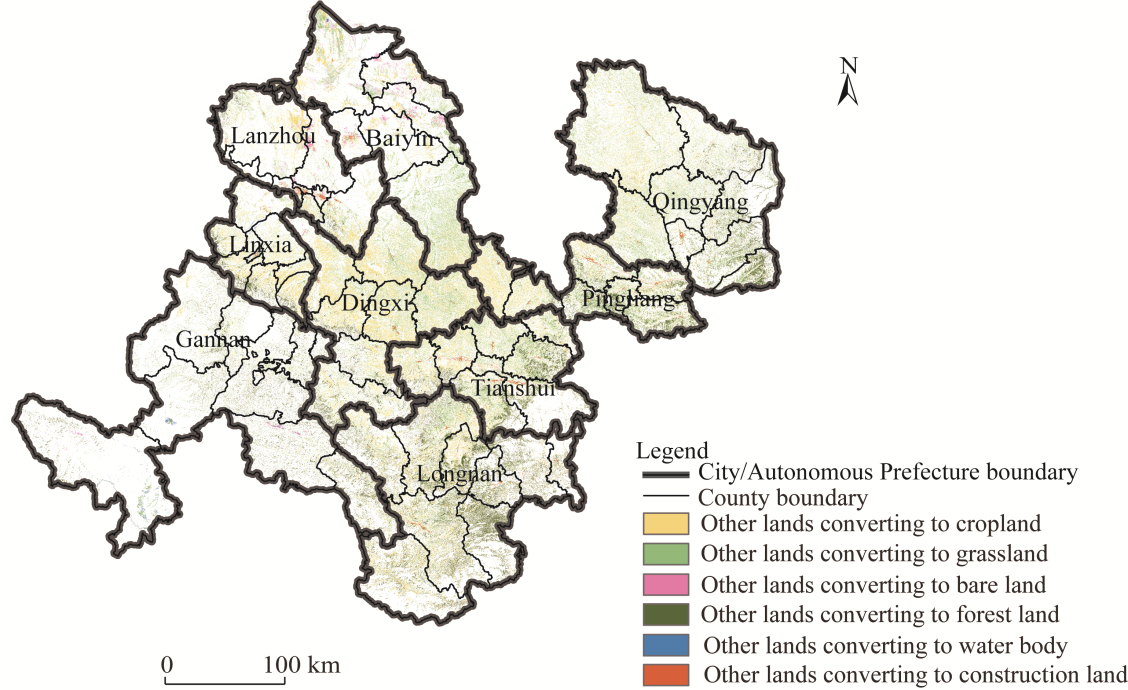
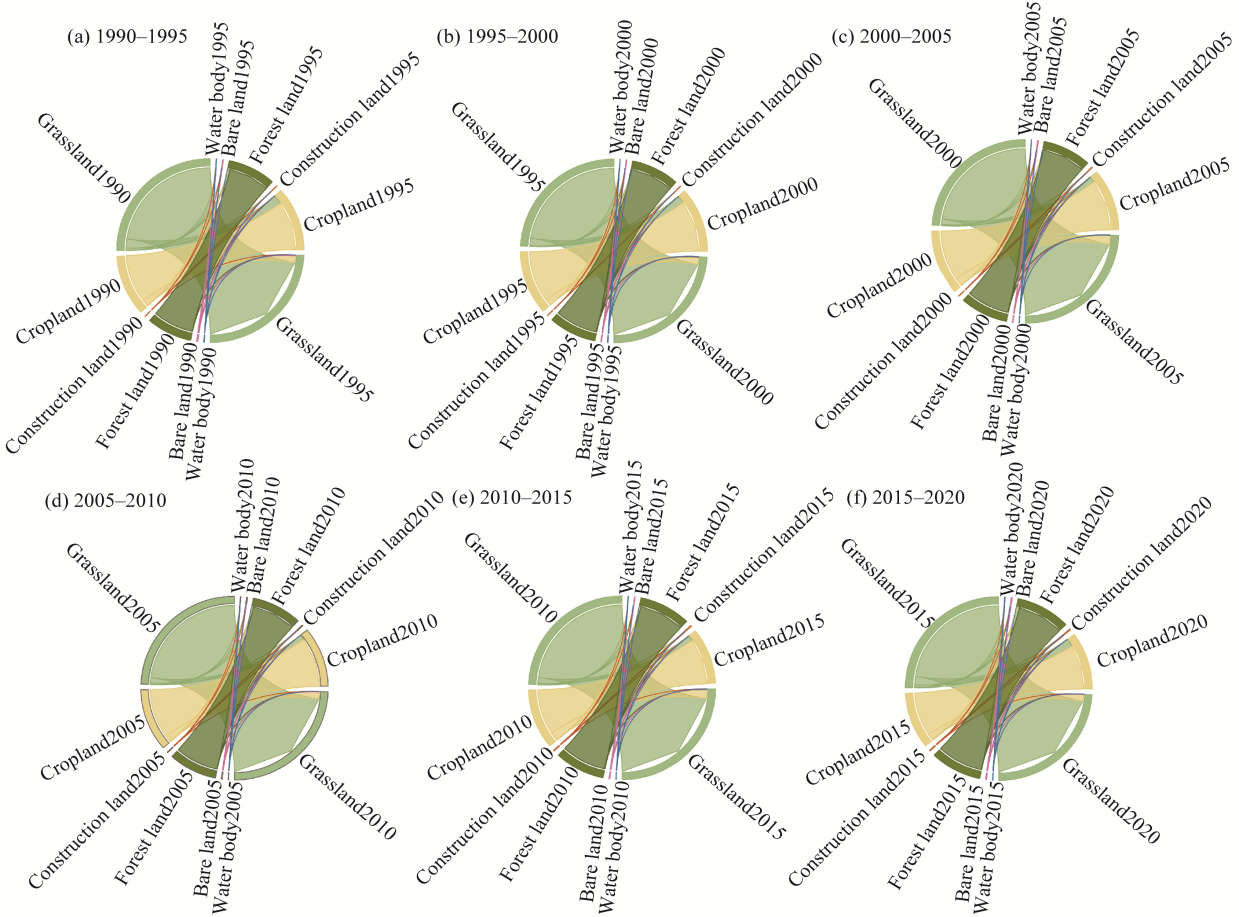
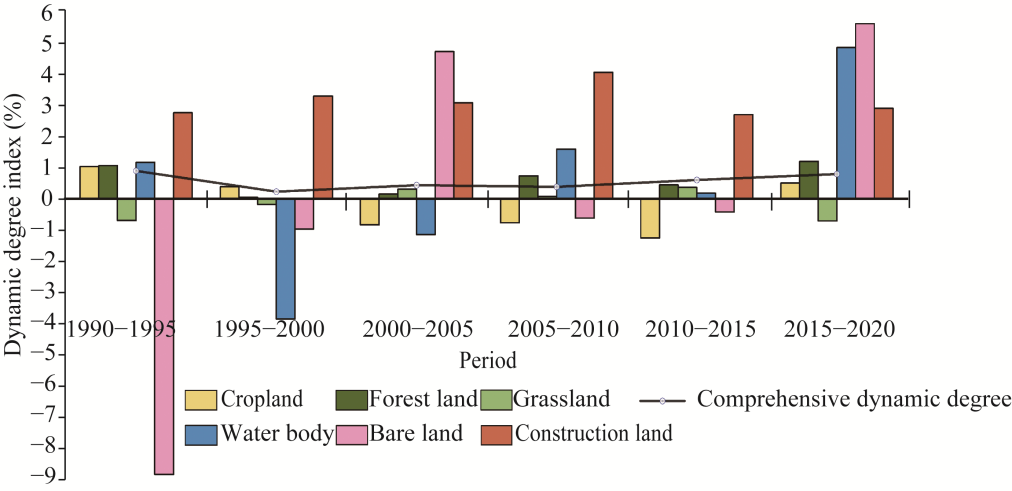
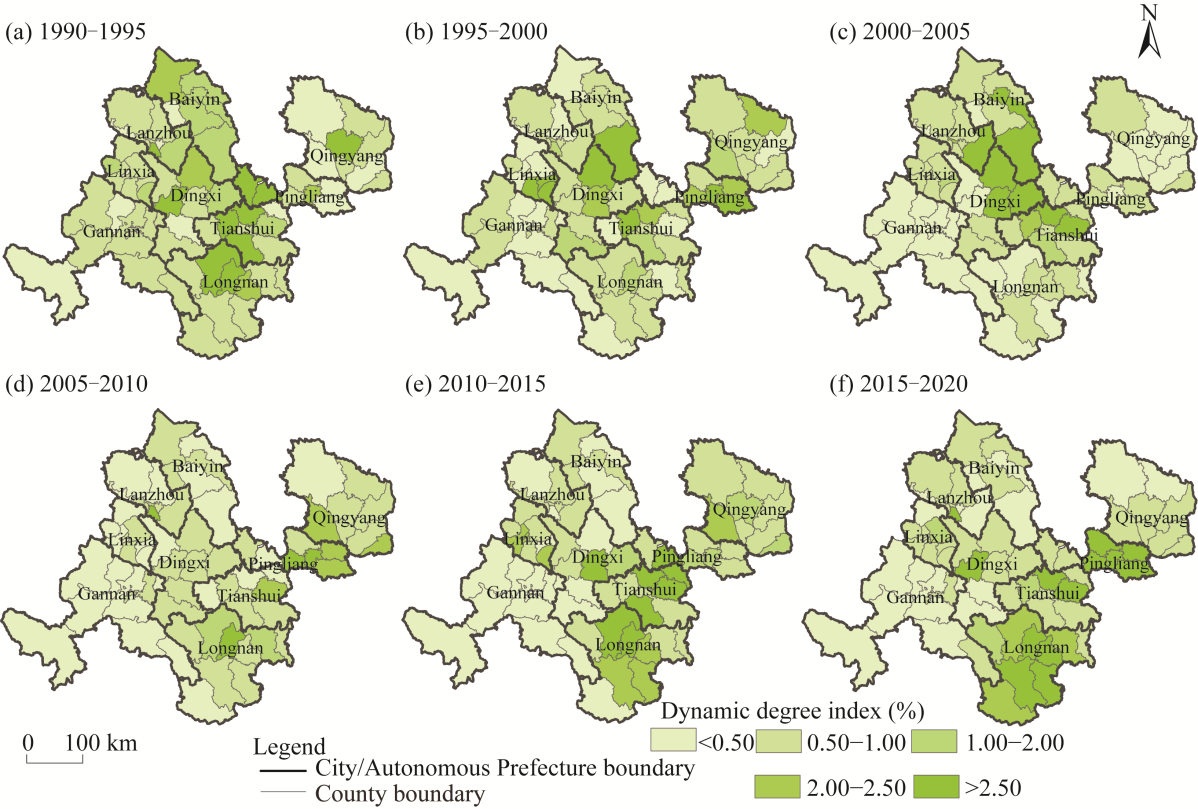
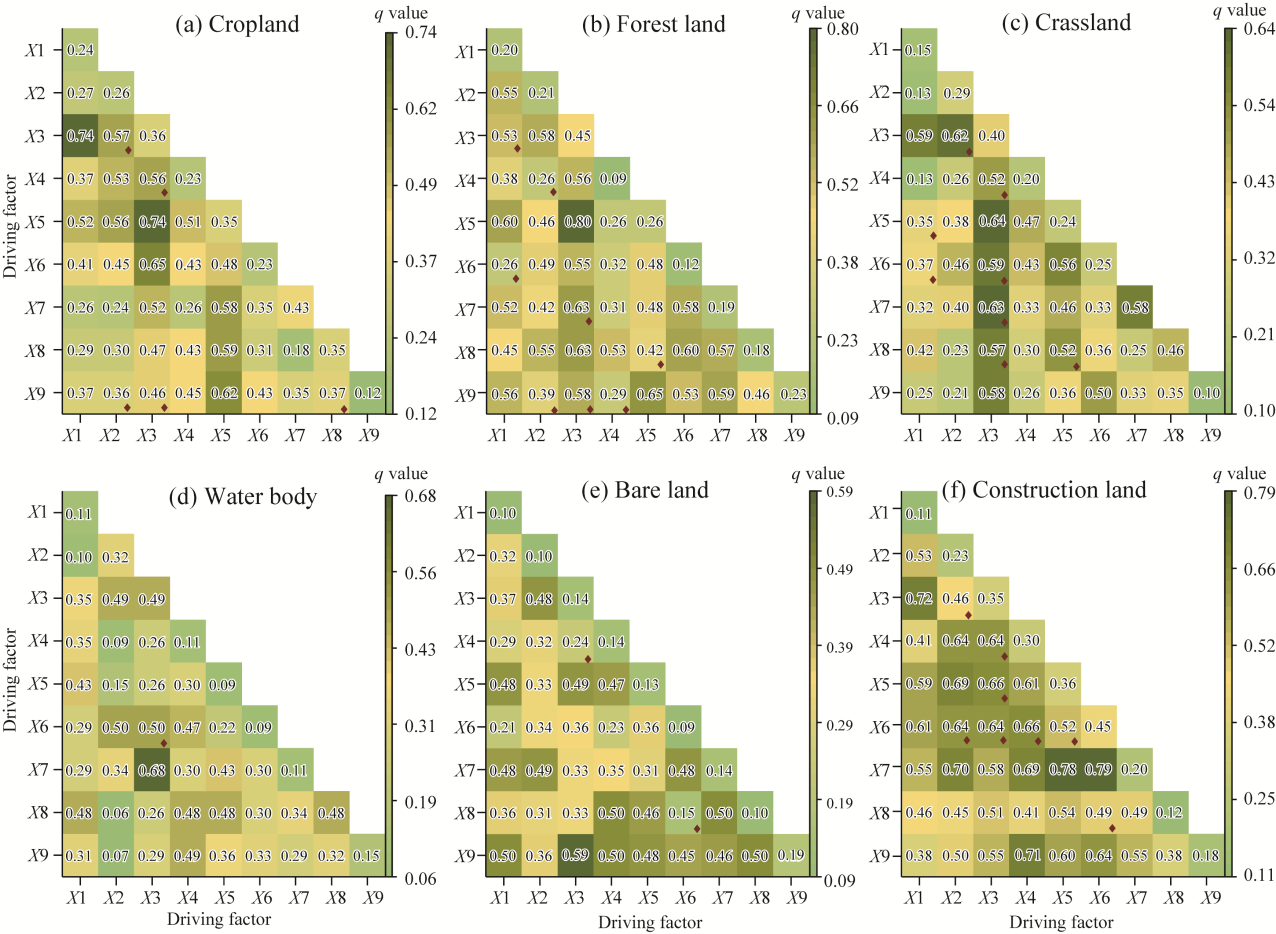
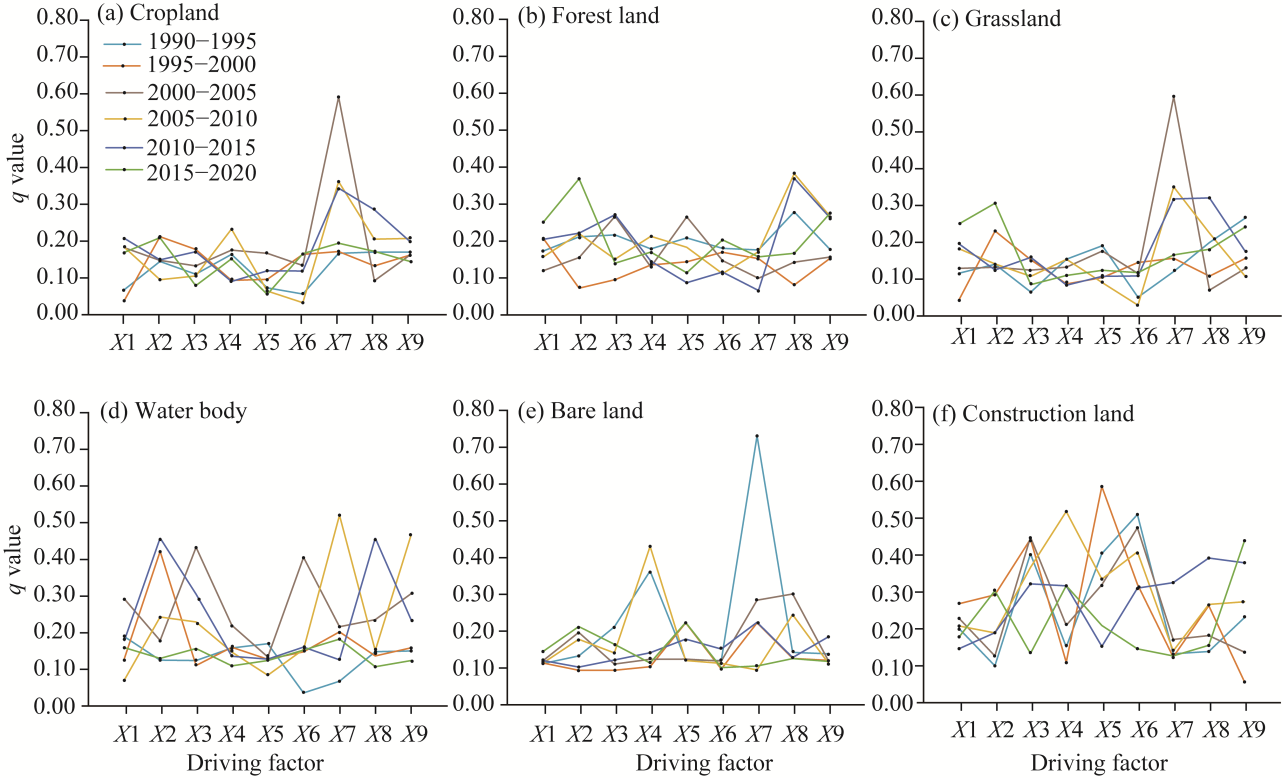
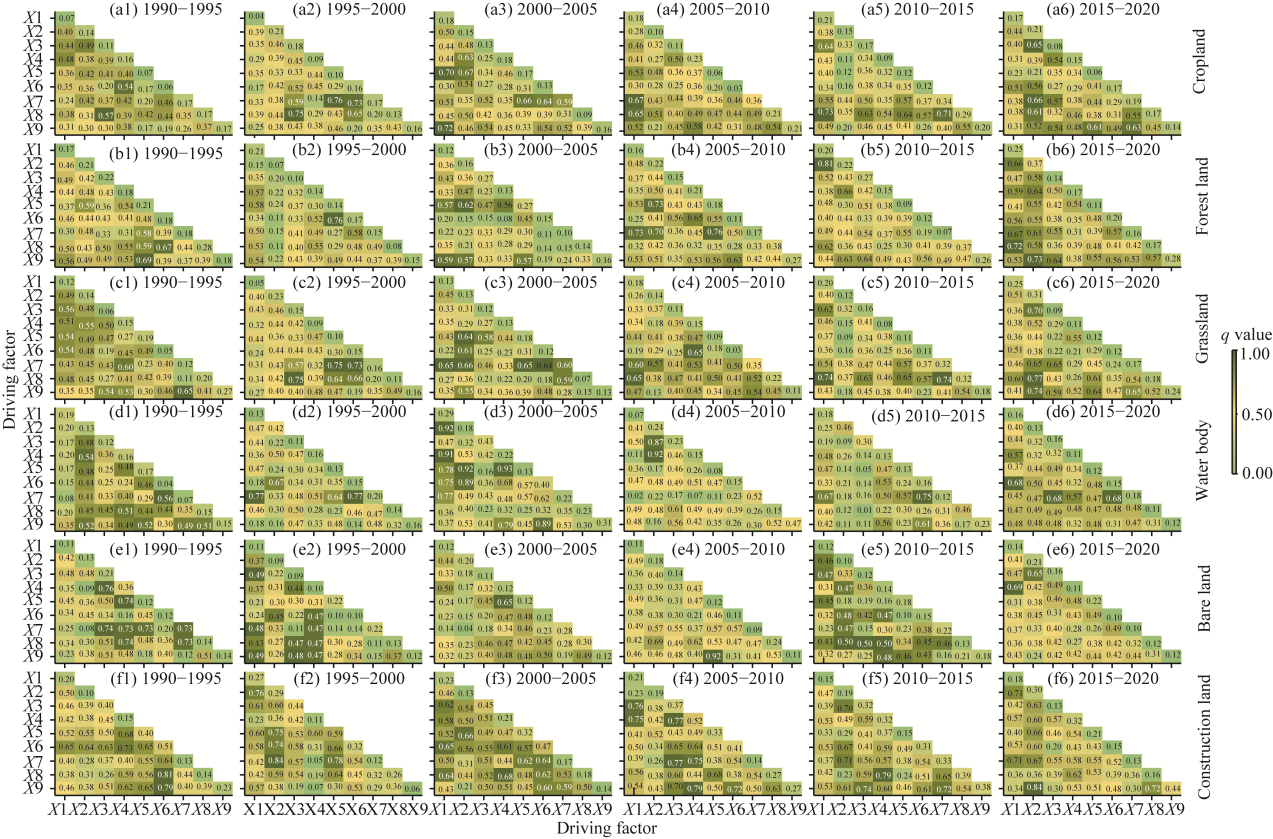
Abstract Land use and cover change (LUCC) is important for the provision of ecosystem services. An increasing number of recent studies link LUCC processes to ecosystem services and human well-being at different scales recently. However, the dynamic of land use and its drivers receive insufficient attention within ecological function areas, particularly in quantifying the dynamic roles of climate change and human activities on land use based on a long time series. This study utilizes geospatial analysis and geographical detectors to examine the temporal dynamics of land use patterns and their underlying drivers in the Hedong Region of the Gansu Province from 1990 to 2020. Results indicated that grassland, cropland, and forestland collectively accounted for approximately 99% of the total land area. Cropland initially increased and then decreased after 2000, while grassland decreased with fluctuations. In contrast, forestland and construction land were continuously expanded, with net growth areas of 6235.2 and 455.9 km2, respectively. From 1990 to 2020, cropland was converted to grassland, and both of them were converted to forestland as a whole. The expansion of construction land primarily originated from cropland. From 2000 to 2005, land use experienced intensified temporal dynamics and a shift of relatively active zones from the central to the southeastern region. Grain yield, economic factors, and precipitation were the major factors accounting for most land use changes. Climatic impacts on land use changes were stronger before 1995, succeeded by the impact of animal husbandry during 1995-2000, followed by the impacts of grain production and gross domestic product (GDP) after 2000. Moreover, agricultural and pastoral activities, coupled with climate change, exhibited stronger enhancement effects after 2000 through their interaction with population and economic factors. These patterns closely correlated with ecological restoration projects in China since 1999. This study implies the importance of synergy between human activity and climate change for optimizing land use via ecological patterns in the ecological function area.
|
|
Received: 16 June 2023
Published: 31 January 2024
|
|
Corresponding Authors:
*WEI Zhudeng (E-mail: weizhudeng@126.com)
|
|
|
| [1] |
Alkama R, Cescatti A. 2016. Biophysical climate impacts of recent changes in global forest cover. Science, 351(6273): 600-604.
doi: 10.1126/science.aac8083
pmid: 26912702
|
|
|
| [2] |
Batllori E, Lloret F, Aakala T, et al. 2020. Forest and woodland replacement patterns following drought-related mortality. Proceedings of the National Academy of Sciences of the United States of America, 117(47): 29720-29729.
|
|
|
| [3] |
Bennett M T. 2008. China's sloping land conversion program: Institutional innovation or business as usual? Ecological Economics, 65(4): 699-711.
doi: 10.1016/j.ecolecon.2007.09.017
|
|
|
| [4] |
Cao F, Ge Y, Wang J. 2013. Optimal discretization for geographical detectors-based risk assessment. GIScience & Remote Sensing, 50(1): 78-92.
|
|
|
| [5] |
Damtea W G, Kim D, Im S. 2020. Spatiotemporal analysis of land cover changes in the Chemoga Basin, Ethiopia, using Landsat and Google Earth images. Sustainability, 12(9): 3607, doi: 10.3390/su12093607.
|
|
|
| [6] |
De Hertog S J, Havermann F, Vanderkelen I, et al. 2023. The biogeophysical effects of idealized land cover and land management changes in Earth system models. Earth System Dynamics, 14(3): 629-667.
doi: 10.5194/esd-14-629-2023
|
|
|
| [7] |
Deng Y, Jia L, Guo Y, et al. 2022. Evaluation of the ecological effects of ecological restoration programs: A case study of the sloping land conversion program on the Loess Plateau, China. International Journal of Environmental Research and Public Health, 19: 7841, doi: 10.3390/ijerph19137841.
|
|
|
| [8] |
Dong L, Wang W, Ma M, et al. 2009. The change of land cover and land use and its impact factors in upriver key regions of the Yellow River. International Journal of Remote Sensing, 30(5): 1251-1265.
doi: 10.1080/01431160802468248
|
|
|
| [9] |
Erb K H, Haberl H, Jepsen M R, et al. 2013. A conceptual framework for analysing and measuring land-use intensity. Current Opinion in Environmental Sustainability, 5(5): 464-470.
doi: 10.1016/j.cosust.2013.07.010
|
|
|
| [10] |
Fan J. 2015. Draft of major function oriented zoning of China. Acta Geographica Sinica, 70(2): 186-201. (in Chinese)
doi: 10.11821/dlxb201502002
|
|
|
| [11] |
Fang Z, Ding T, Chen J, et al. 2022. Impacts of land use/land cover changes on ecosystem services in ecologically fragile regions. Science of the Total Environment, 831: 154967, doi: 10.1016/j.scitotenv.2022.154967.
|
|
|
| [12] |
Feng Y, Zhu J, Zeng L, et al. 2021. Profit and loss prediction of ecosystem service value under county land use change: A case study of Banan District, Chongqing. Acta Ecologica Sinica, 41(9): 3381-3393. (in Chinese)
|
|
|
| [13] |
Foley J A, DeFries R, Asner G P, et al. 2005. Global consequences of land use. Science, 309(5734): 570-574.
doi: 10.1126/science.1111772
pmid: 16040698
|
|
|
| [14] |
Future Earth. 2013. Future Earth Initial Design:Report of the Transition Team. Paris: International Council for Science (ICSU).
|
|
|
| [15] |
Geng X, Hu S, Wang X, et al. 2023. Adaptive change of land use to nature and society in China's agro-pastoral ecotone. Land Use Policy, 126: 106554, doi: 10.1016/j.landusepol.2023.106554.
|
|
|
| [16] |
Grace J B, Keeley J E. 2006. A structural equation model analysis of post fire plant diversity in California shrub lands. Ecological Applications, 16(2): 503-514.
doi: 10.1890/1051-0761(2006)016[0503:ASEMAO]2.0.CO;2
|
|
|
| [17] |
Hailu A, Mammo S, Kidane M. 2020. Dynamics of land use, land cover change trend and its drivers in Jimma Geneti District, Western Ethiopia. Journal of Land Use Policy, 99: 105011, doi: 10.1016/j.landusepol.2020.105011.
|
|
|
| [18] |
Halmy M W A, Gessler P E, Hicke J A, et al. 2015. Land use/land cover change detection and prediction in the north-western coastal desert of Egypt using Markov-CA. Applied Geography, 63: 101-112.
doi: 10.1016/j.apgeog.2015.06.015
|
|
|
| [19] |
He C, Zhang J, Liu Z, et al. 2022. Characteristics and progress of land use/cover change research during 1990-2018. Journal of Geographical Sciences, 32(3): 537-559. (in Chinese)
doi: 10.1007/s11442-022-1960-2
|
|
|
| [20] |
Hishe S, Bewket W, Nyssen J, et al. 2020. Analysing past land use land cover change and CA-Markov-based future modelling in the middle Suluh Valley, Northern Ethiopia. Geocarto International, 35(3): 225-255.
doi: 10.1080/10106049.2018.1516241
|
|
|
| [21] |
Hu Y, Hu S, Yao J. 2014. Factors affecting farmland abandonment behavior of farmers in semi-arid regions of Gansu Province. Guizhou Agricultural Sciences, 42(9): 227-231. (in Chinese)
|
|
|
| [22] |
Jin S, Li B, Yang Y, et al. 2016. Basic characteristics and pattern of land use change in Gansu Province. Journal of Lanzhou University: Natural Science, 52(3): 334-341. (in Chinese)
|
|
|
| [23] |
Kleyer M, Trinogga J, Cebrián-Piqueras M A, et al. 2019. Trait correlation network analysis identifies biomass allocation traits and stem specific length as hub traits in herbaceous perennial plants. Journal of Ecology, 107(2): 829-842.
doi: 10.1111/jec.2019.107.issue-2
|
|
|
| [24] |
Lambin E F, Baulies X, Bockstael N, et al. 1995. Land-use and land-cover change (LUCC): Implementation strategy. A core project of the International Geospere-Biosphere Programme and the International Human Dimensions Programme on Global Environmental Change. In: IGBP Report 48. IHDP Report 10. IGBP, Stockholm, Sweden
|
|
|
| [25] |
Lambin E F, Meyfroidt P. 2011. Global land use change, economic globalization, and the looming land scarcity. Proceedings of the National Academy of Sciences of the United States of America, 108(9): 3465-3472.
|
|
|
| [26] |
Le Quéré C, Andrew R M, Canadell J G, et al. 2016. Global carbon budget 2016. Earth System Science Data, 8(2): 605-649.
doi: 10.5194/essd-8-605-2016
|
|
|
| [27] |
Leroux L, Begue A, Lo Seen D, et al. 2017. Driving forces of recent vegetation changes in the Sahel: Lessons learned from regional and local level analyses. Remote Sensing of Environment, 191: 38-54.
doi: 10.1016/j.rse.2017.01.014
|
|
|
| [28] |
Li G, Sun S B, Han J C, et al. 2019. Impacts of Chinese Grain for Green program and climate change on vegetation in the Loess Plateau during 1982-2015. Science of the Total Environment, 660: 177-187.
doi: 10.1016/j.scitotenv.2019.01.028
|
|
|
| [29] |
Li K, Feng M, Biswas A, et al. 2020. Driving factors and future prediction of land use and cover change based on satellite remote sensing data by the LCM model: A case study from Gansu Province, China. Sensors, 20(10): 2757, doi: 10.3390/s20102757.
|
|
|
| [30] |
Li X Y, Wang L X, Zhang Y S. 2004. Analysis of roles of human activities in land desertification in arid area of Northwest China. Scientia Geographica Sinica, 24(1): 68-75. (in Chinese)
doi: 10.13249/j.cnki.sgs.2004.01.68
|
|
|
| [31] |
Liu J, Kuang W, Zhang Z, et al. 2014. Spatiotemporal characteristics, patterns, and causes of land-use changes in China since the late 1980s. Journal of Geographical Sciences, 24: 195-210.
doi: 10.1007/s11442-014-1082-6
|
|
|
| [32] |
Long Y, Jiang F, Deng M, et al. 2023 Spatial-temporal changes and driving factors of eco-environmental quality in the Three-North region of China. Journal of Arid Land, 15(3): 231-252.
doi: 10.1007/s40333-023-0053-0
|
|
|
| [33] |
Lunyolo L D, Khalifa M, Ribbe L. 2021. Assessing the interaction of land cover/land use dynamics, climate extremes and food systems in Uganda. Science of the Total Environment, 753: 142549, doi: 10.1016/j.scitotenv.2020.142549.
|
|
|
| [34] |
Luyssaert S, Jammet M, Stoy P C, et al. 2014. Land management and land-cover change have impacts of similar magnitude on surface temperature. Nature Climate Change, 4: 389-393.
doi: 10.1038/nclimate2196
|
|
|
| [35] |
Lyu J, Jiang W, Wang W, et al. 2018. Wetland landscape pattern change and its driving forces in Beijing-Tianjin-Hebei region in recent 30 years. Acta Ecologica Sinica, 38(12): 4492-4503. (in Chinese)
|
|
|
| [36] |
Parihar C M, Yadav M R, Jat S L, et al. 2018. Long-term conservation agriculture and intensified cropping systems: Effects on growth, yield, water, and energy-use efficiency of maize in northwestern India. Pedosphere, 28(6): 952-963.
doi: 10.1016/S1002-0160(17)60468-5
|
|
|
| [37] |
Powers R P, Jetz W. 2019. Global habitat loss and extinction risk of terrestrial vertebrates under future land-use-change scenarios. Nature Climate Change, 9: 323-329.
doi: 10.1038/s41558-019-0406-z
|
|
|
| [38] |
Qacami M, Khattabi A, Lahssini S, et al. 2023. Land-cover/land-use change dynamics modeling based on land change modeler. Annals of Regional Science, 70(1): 237-258.
doi: 10.1007/s00168-022-01169-z
|
|
|
| [39] |
Refati D C, da Silva J L B, Macedo R S, et al. 2023. Influence of drought and anthropogenic pressures on land use and land cover change in the Brazilian semi-arid region. Journal of South American Earth Sciences, 126: 104362, doi: 10.1016/j.jsames.2023.104362.
|
|
|
| [40] |
Shao W Y, Zhang Z P, Guan Q Y, et al. 2024. Comprehensive assessment of land degradation in the arid and semiarid area based on the optimal land degradation index model. Catena, 234: 107563, doi: 10.1016/j.catena.2023.107563.
|
|
|
| [41] |
Silva L, Xavier A, Silva R, et al. 2020. Modeling land cover change based on an artificial neural network for a semiarid river basin in northeastern Brazil. Global Ecology and Conservation, 21: 00811, doi: 10.1016/j.gecco.2019.e00811.
|
|
|
| [42] |
Song W, Feng Y, Wang Z. 2022. Ecological restoration programs dominate vegetation greening in China. Science of the Total Environment, 848: 157729, doi: 10.1016/j.scitotenv.2022.157729.
|
|
|
| [43] |
Song X P, Hansen M C, Stehman S V, et al. 2018. Global land change from 1982 to 2016. Nature, 560: 639-643.
doi: 10.1038/s41586-018-0411-9
|
|
|
| [44] |
Song Z F. 2010. Jingtai water supply project: Yingwu reservoir commences construction. Gansu Daily, [2010-10-19(02)]. (in Chinese)
|
|
|
| [45] |
Sy S, Quesada B. 2020. Anthropogenic land cover change impact on climate extremes during the 21st century. Environmental Research Letter, 15(3): 034002, doi: 10.1088/1748-9326/ab702c.
|
|
|
| [46] |
Turner B L, Skole D, Sanderson S, et al. 1995. Land Cover Change Science/Research Plan. Stockholm and Geneva: The International Geosphere Biosphere Program (IGBP) of the International Council for Science (ICSU) and Human Dimensions Programme (HDP) of the International Social Science Council (ISSC).
|
|
|
| [47] |
Turner B L, Lambin E F, Reenberg A. 2007. The emergence of land change science for global environmental change and sustainability. Proceedings of the National Academy of Sciences of the United States of America, 104: 20666-20671.
|
|
|
| [48] |
Wang J F, Xu C D. 2017. Geodetector: Principle and prospective. Acta Geographica Sinica, 72(1): 116-134. (in Chinese)
doi: 10.11821/dlxb201701010
|
|
|
| [49] |
Wang K, Li X, Lyu X, et al. 2022. Optimizing the land use and land cover pattern to increase its contribution to carbon neutrality. Remote Sensing, 14(19): 3607, doi: 10.3390/su12093607.
|
|
|
| [50] |
Wang X, LESI M, Zhang M. 2019. Ecosystem pattern change and its influencing factors of ''Two Barriers and Three Belts''. Chinese Journal of Ecology, 38(7): 2138-2148.
|
|
|
| [51] |
Winkler K, Fuchs R, Rounsevell M, et al. 2021. Global land use changes are four times greater than previously estimated. Nature Communications, 12: 2501, doi: 10.1038/s41467-021-22702-2.
pmid: 33976120
|
|
|
| [52] |
Yan J J, Zhang G P, Deng X Y, et al. 2019a. Does climate change or human activity lead to the degradation in the grassland ecosystem in a mountain-basin system in an arid region of China? Sustainability, 11(9): 2618-2632.
doi: 10.3390/su11092618
|
|
|
| [53] |
Yan X, Li L. 2023. Spatiotemporal characteristics and influencing factors of ecosystem services in Central Asia. Journal of Arid Land, 15(1): 1-19.
doi: 10.1007/s40333-022-0074-0
|
|
|
| [54] |
Yan X Y, Zhang Q, Yan X M, et al. 2019b. An overview of distribution characteristics and formation mechanisms in global arid areas. Advances in Earth Science, 34(8): 826-841. (in Chinese)
|
|
|
| [55] |
Yang J, Huang X. 2021. The 30 m annual land cover dataset and its dynamics in China from 1990 to 2019. Earth System Science Data, 13(8): 3907-3925.
doi: 10.5194/essd-13-3907-2021
|
|
|
| [56] |
Yuan X L, Li L H, Chen X, et al. 2015. Effects of precipitation intensity and temperature on NDVI-based grass change over Northern China during the period from 1982 to 2011. Remote Sensing, 7(8): 10164-10183.
doi: 10.3390/rs70810164
|
|
|
| [57] |
Zerouali B, Celso A G S, do Nascimento T V M, et al. 2023. A cloud-integrated GIS for forest cover loss and land use change monitoring using statistical methods and geospatial technology over Northern Algeria. Journal of Environmental Management, 341: 118029, doi: 10.1016/j.jenvman.2023.118029.
|
|
|
| [58] |
Zhang G L, Biradar C M, Xiao X M, et al. 2018. Exacerbated grassland degradation and desertification in Central Asia during 2000-2014. Ecological Applications, 28(2): 442-456.
doi: 10.1002/eap.1660
pmid: 29205627
|
|
|
| [59] |
Zhao Y F, Zhang B, Wang B L, et al. 2012. Spatiotemporal climate change in Hedong Region in Gansu Province in recent 54 years. Arid Zone Research, 29(6): 956-964. (in Chinese)
|
|
|
|
Viewed |
|
|
|
Full text
|
|
|
|
|
Abstract
|
|
|
|
|
Cited |
|
|
|
|
| |
Shared |
|
|
|
|
| |
Discussed |
|
|
|
|