| Research article |
|


|
|
|
| Drought risk assessment and future scenario prediction in agricultural cropping zones of China |
LIU Xiaohong1, LIU Chunhui2, FAN Jiejie1, QIU Chunxia1,*( ) ) |
1College of Geomatics, Xi'an University of Science and Technology, Xi'an 710054, China
2Key Laboratory of Pollution Processes and Environmental Criteria (Ministry of Education), Carbon Neutrality Interdisciplinary Science Centre, College of Environmental Science and Engineering, Nankai University, Tianjin 300350, China |
|
|
|
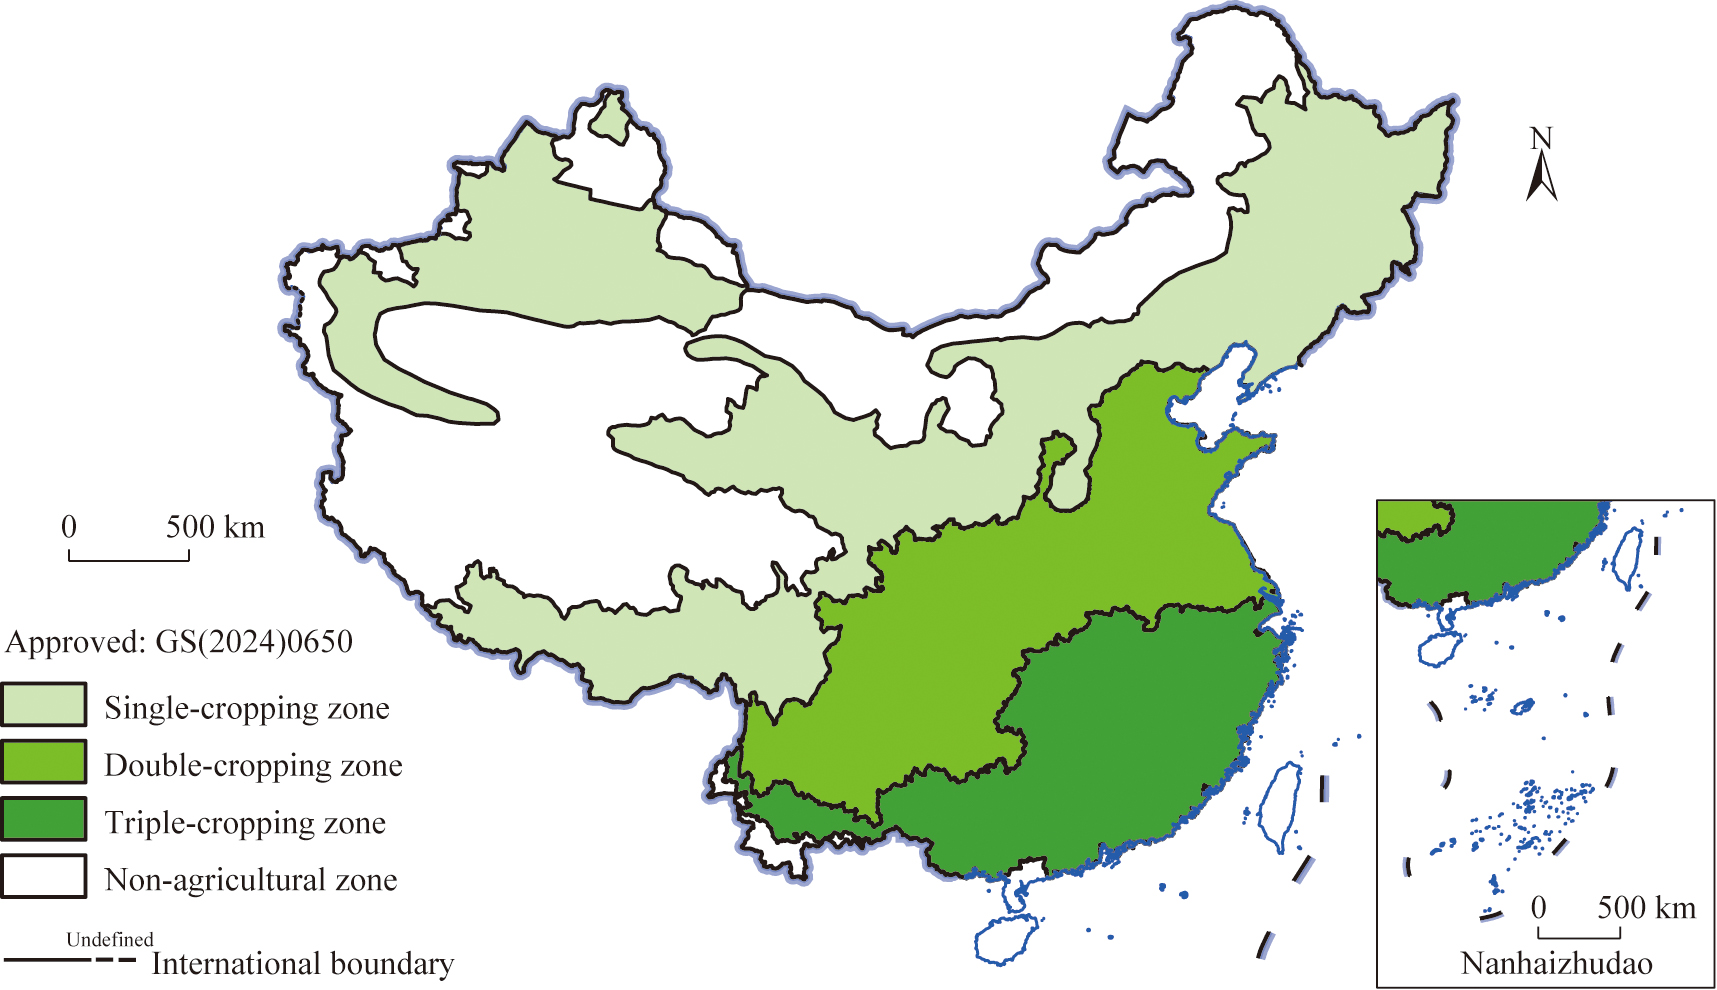
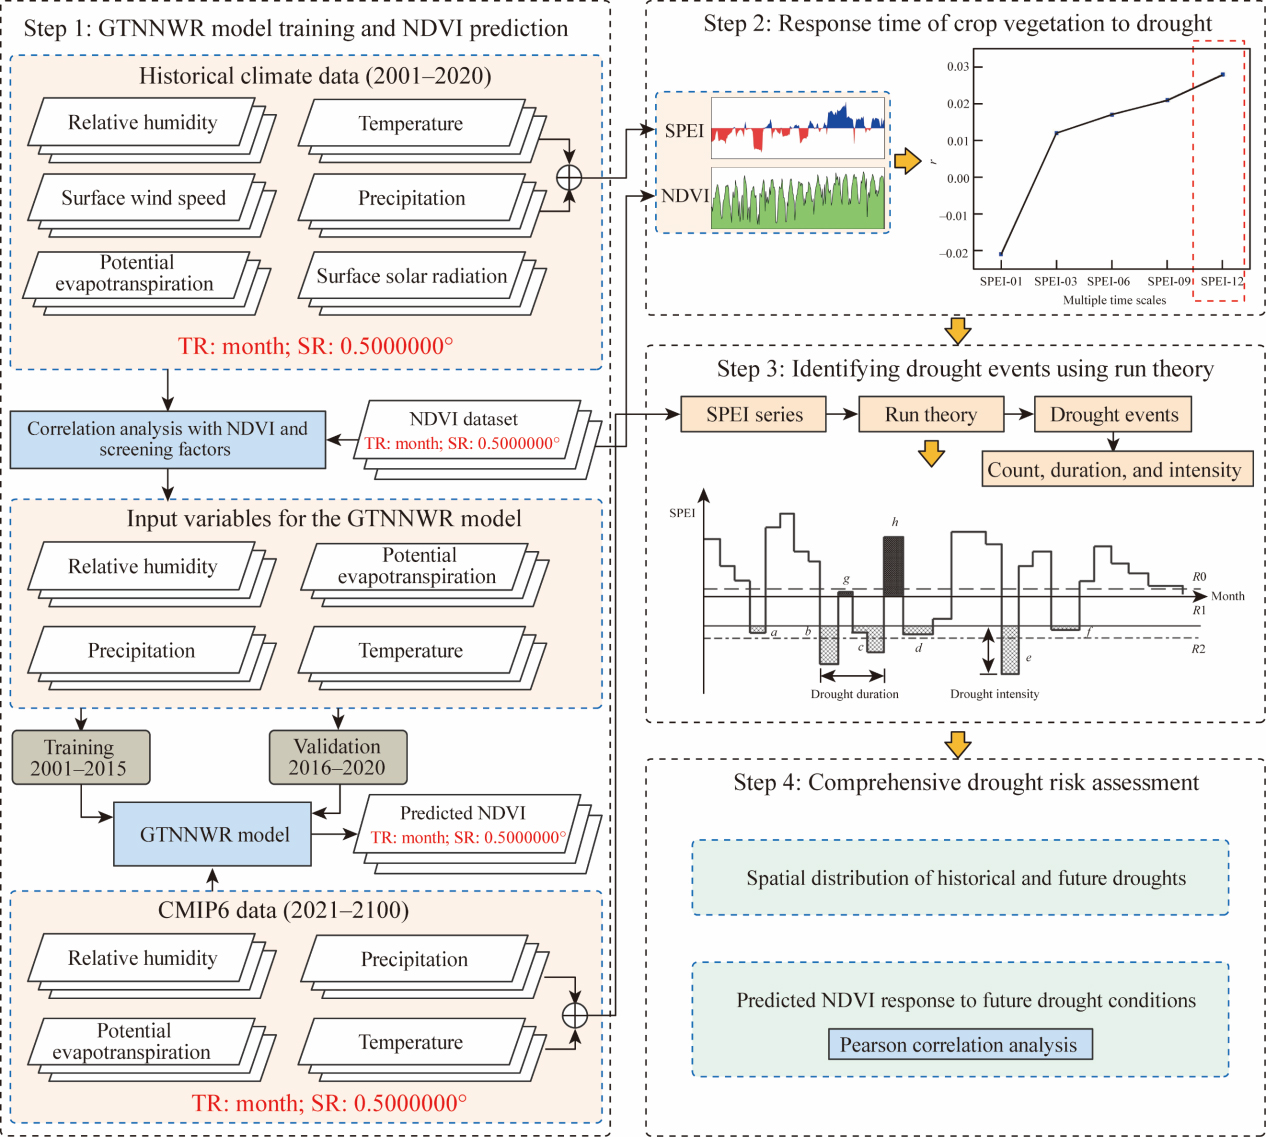
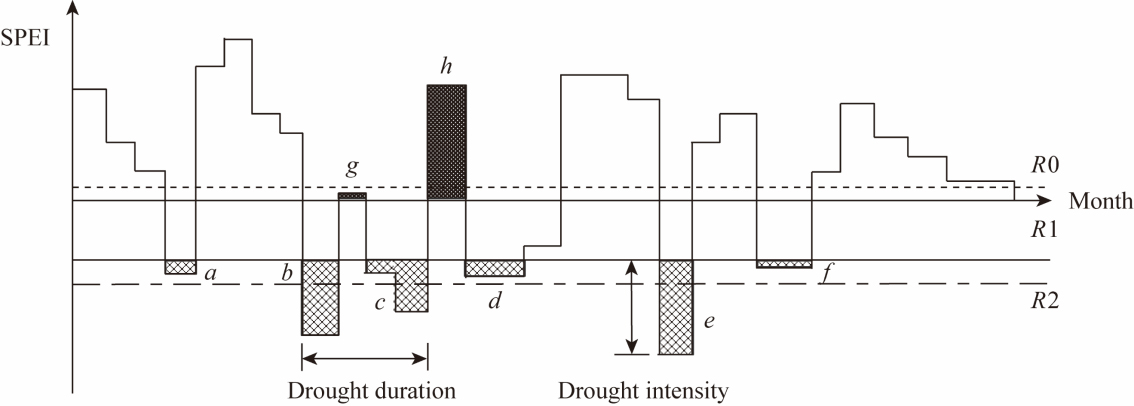
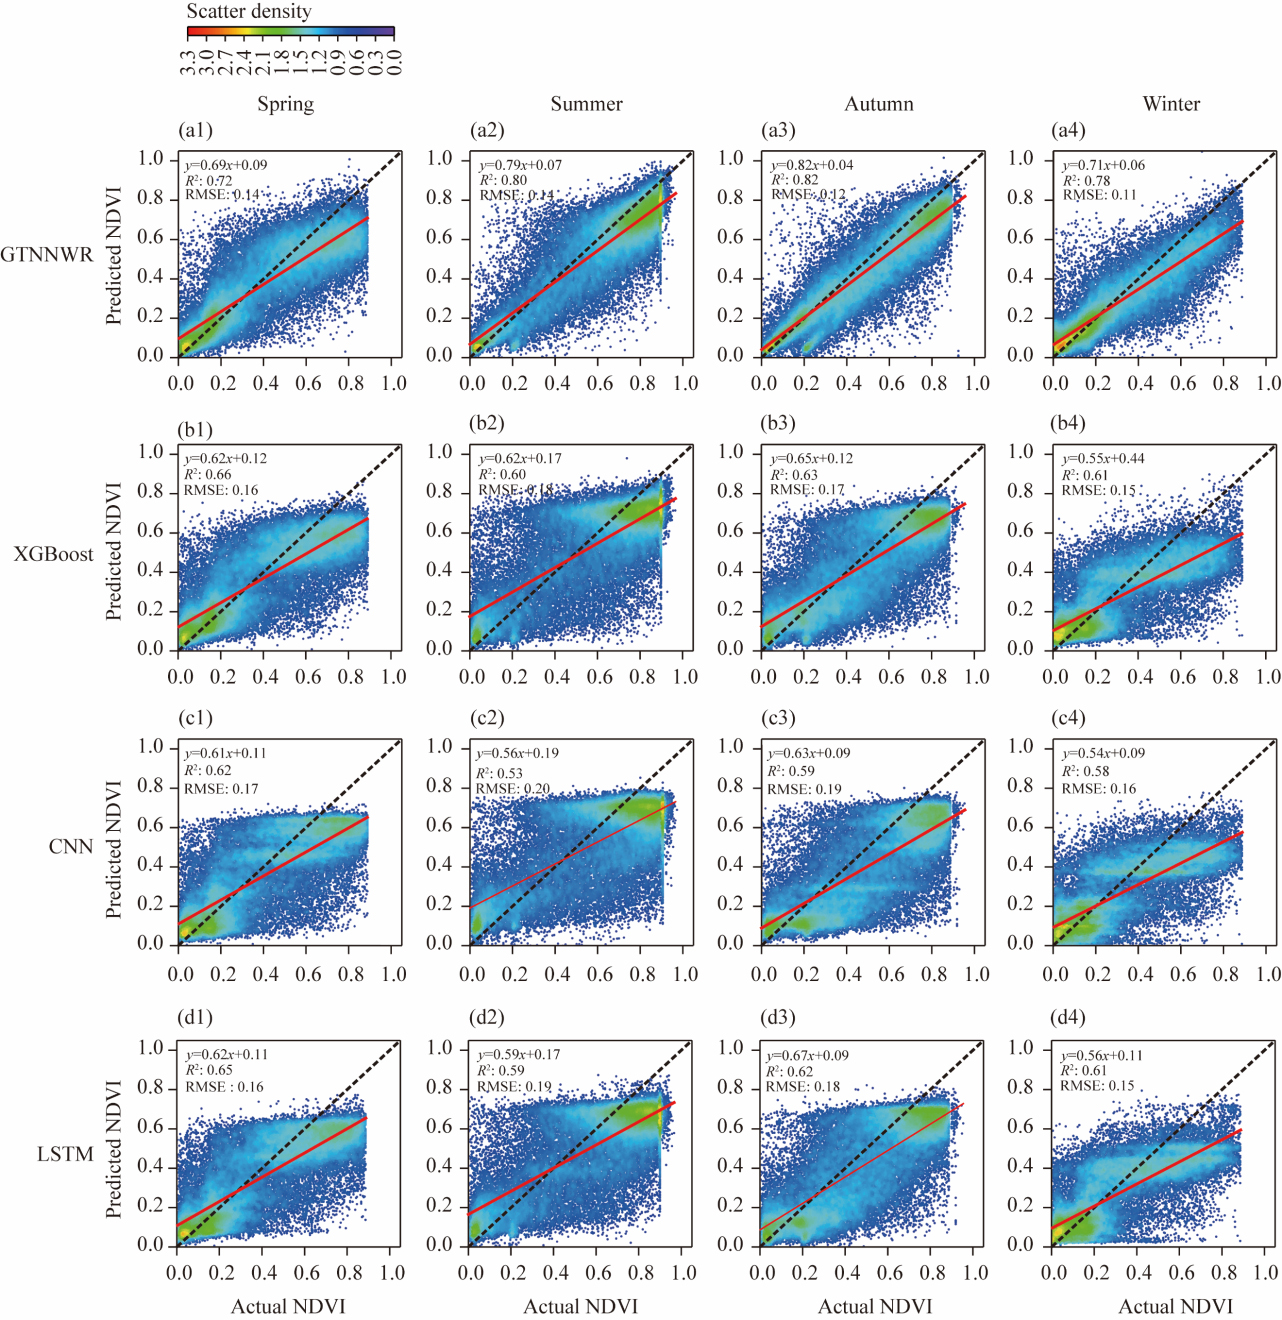
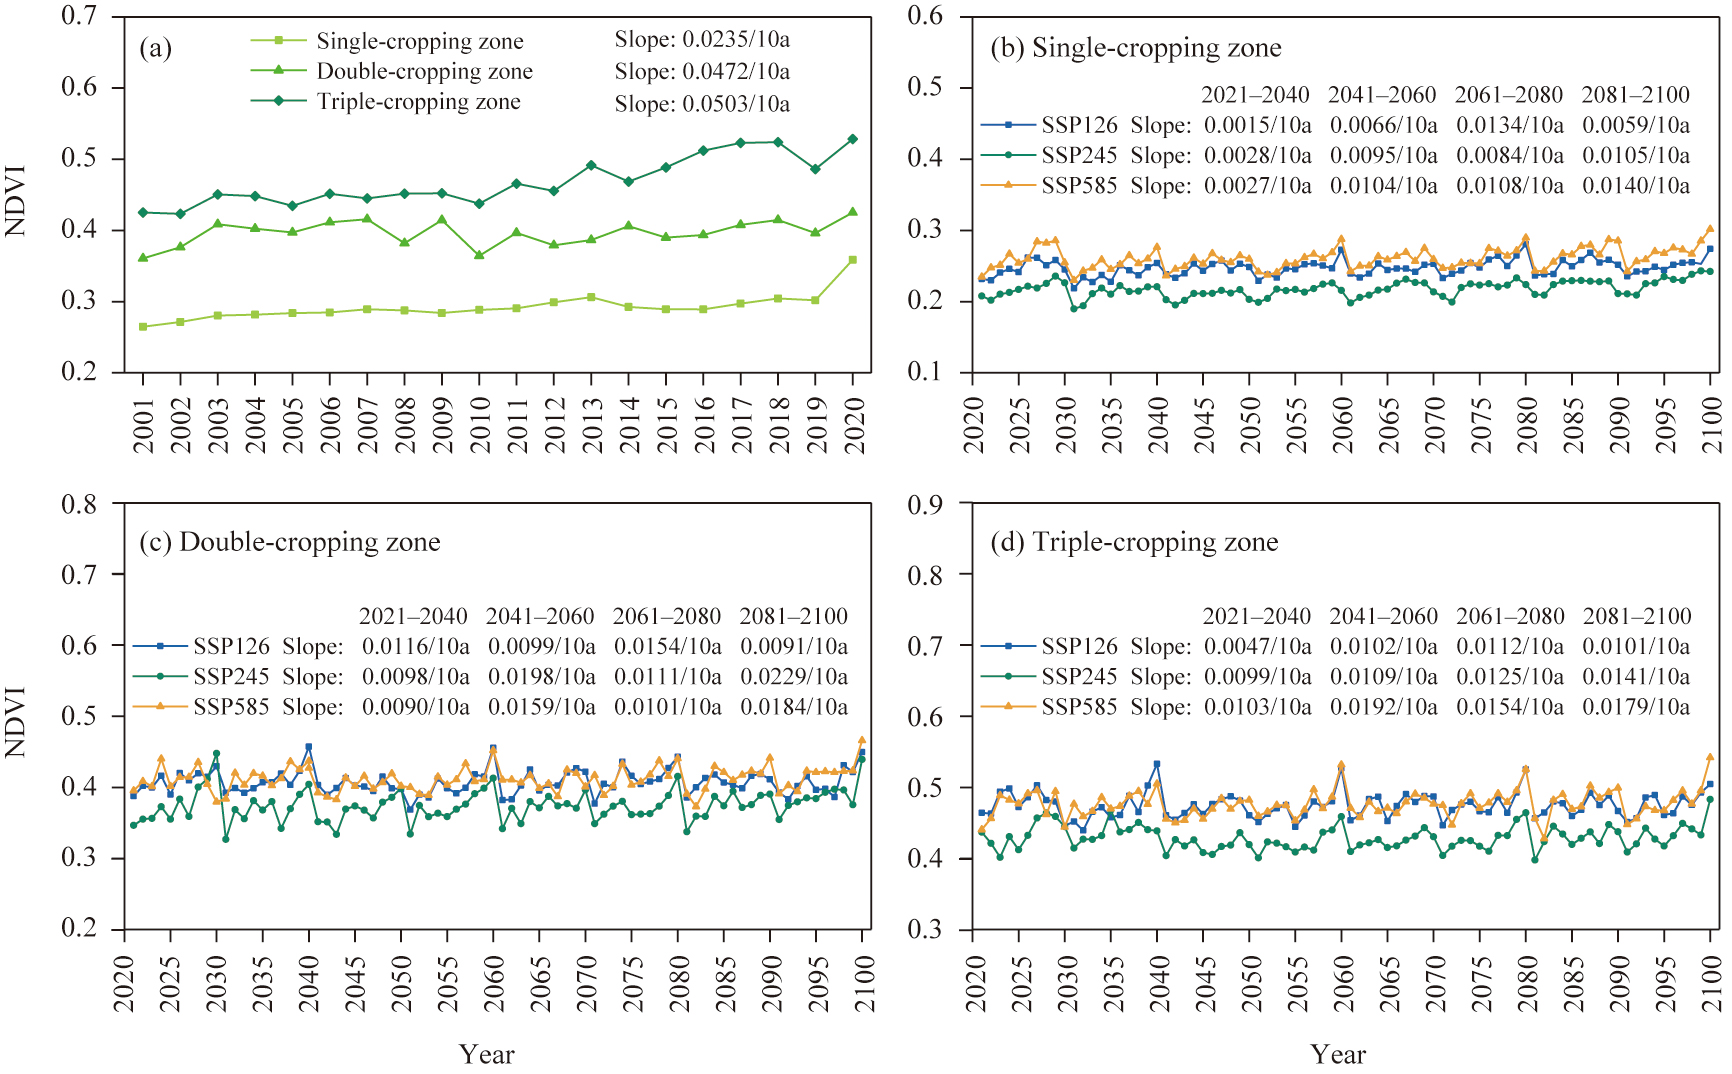
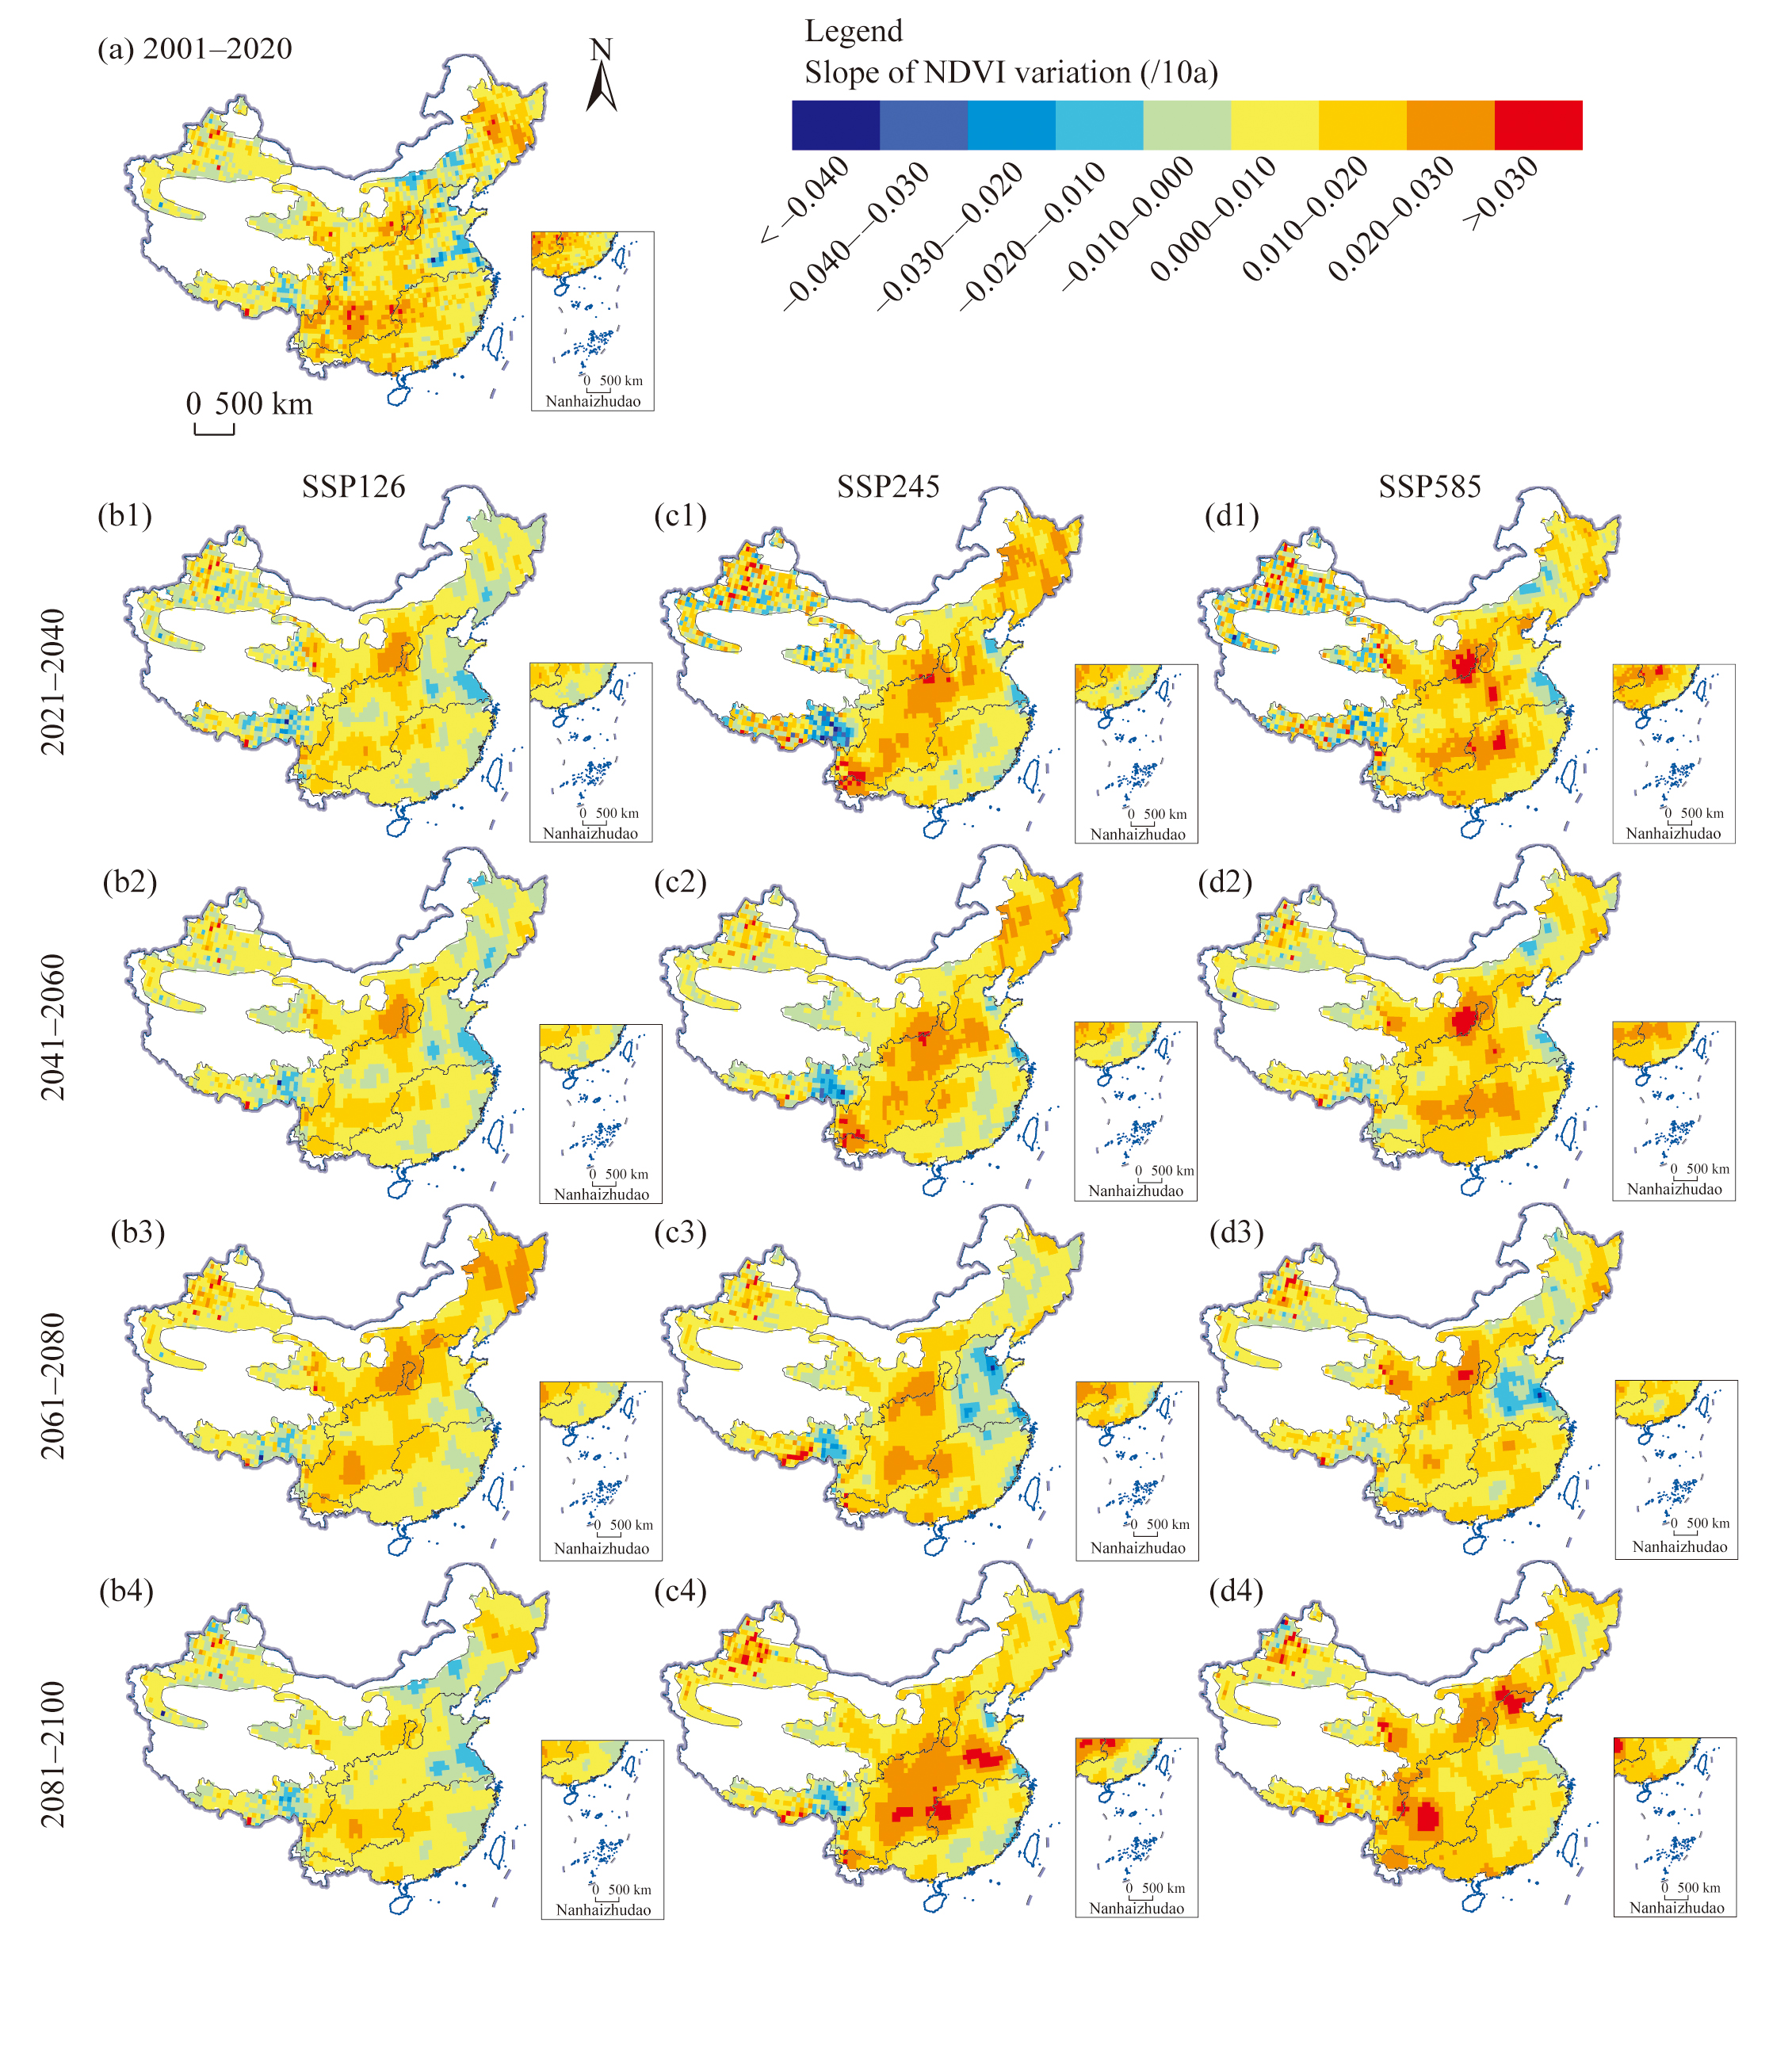
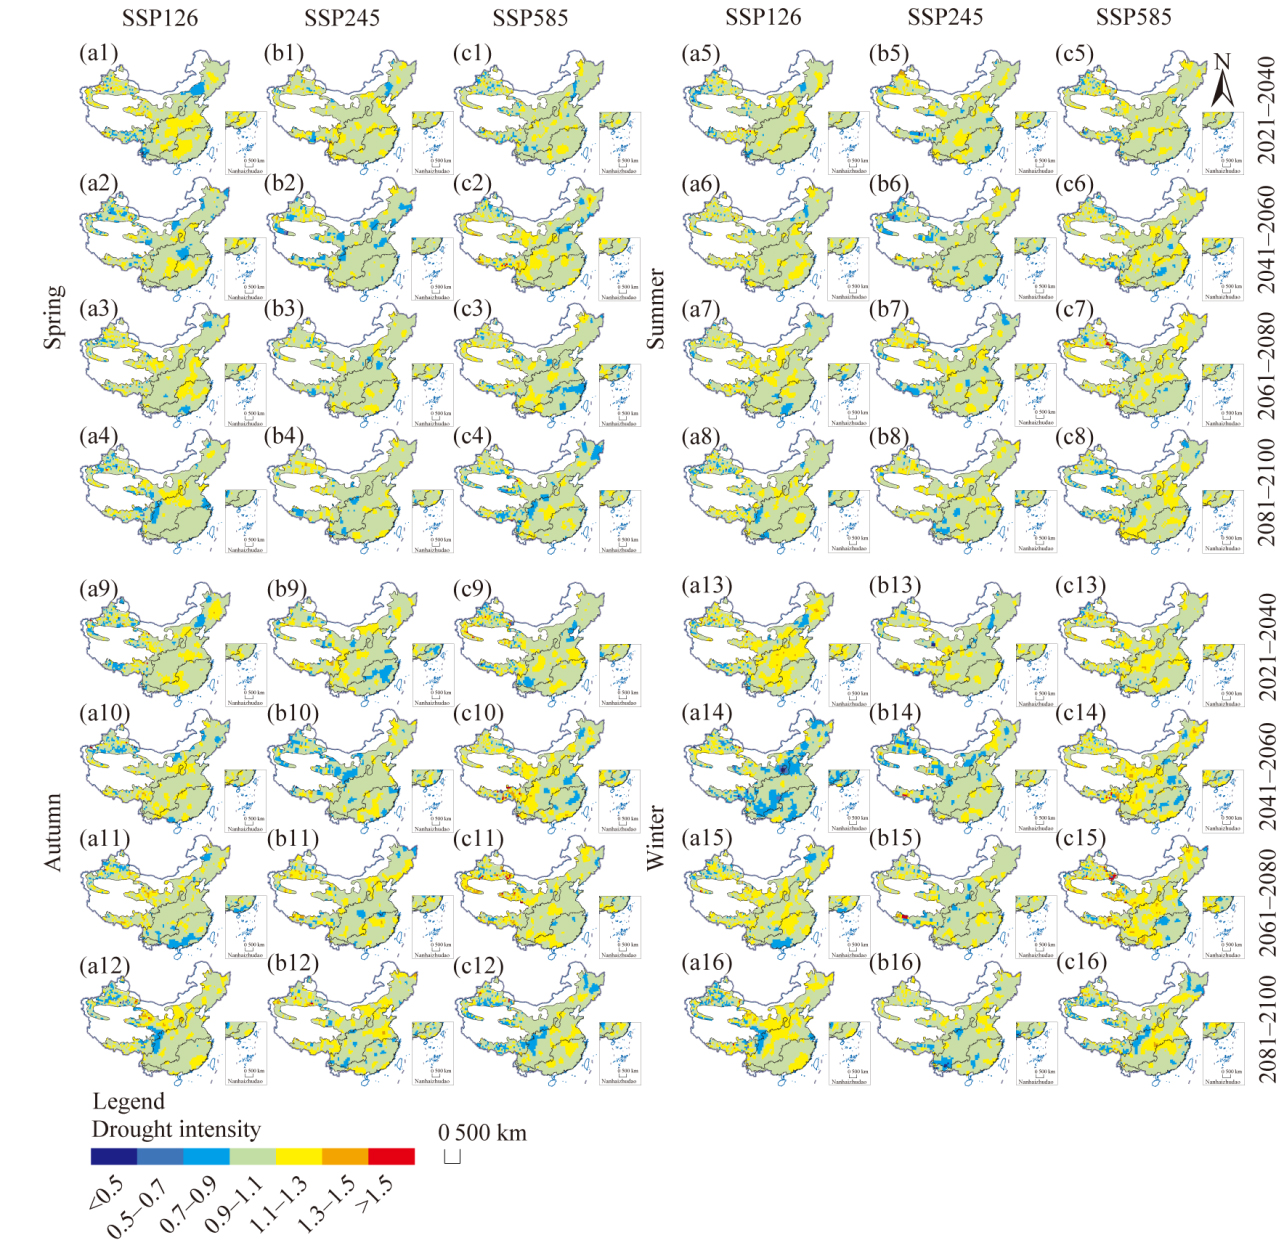
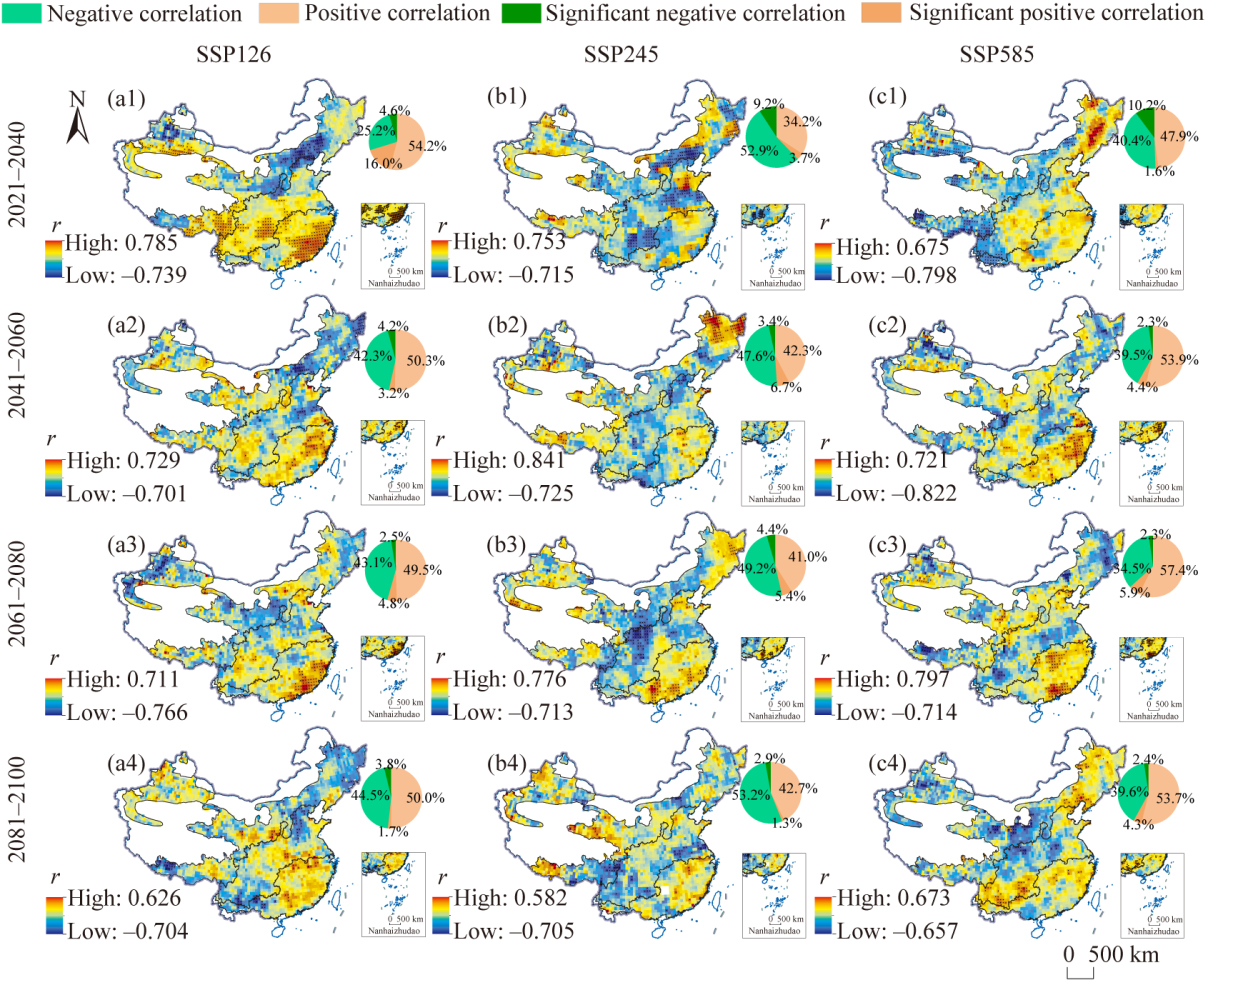
Abstract With ongoing global climate change, drought has become the primary threat constraining food security in China. Traditional assessment frameworks based on administrative boundaries or macro-climatic zoning overlook variation in vulnerability affected by key agronomic practices, such as crop phenology and cropping systems, thereby limiting their accuracy. To address this research gap, this study developed and validated a novel drought risk assessment framework based on agricultural cropping zones (single-, double-, and triple-cropping zones). The framework coupled a Geographical and Temporal Neural Network Weighted Regression (GTNNWR) model for forecasting future crop vegetation dynamics with the Standardized Precipitation Evapotranspiration Index (SPEI) to assess drought risk under historical (2001-2020) and projected future (2021-2100) scenarios. The GTNNWR model achieved R2 values ranging from 0.72 to 0.82 and RMSE values between 0.11 and 0.14 for NDVI prediction, significantly outperforming conventional models. Historical drought risk assessment revealed that drought events were most frequent during summer and concentrated in single-cropping and double-cropping zones. Future projections indicate a substantial intensification of drought risk. Under the Shared Socioeconomic Pathway (SSP)126 scenario, drought risk is projected to increase in the triple-cropping zones of the middle and lower reaches of the Yangtze River Plain. Under the SSP245 scenario, the frequency of spring and winter droughts is anticipated to rise markedly. Under the SSP585 scenario, drought intensity is projected to intensify in central-eastern single-cropping zones and southwestern double-cropping zones. This assessment framework based on agricultural cropping zones can precisely identify drought risks and facilitate adaptation in agricultural management, such as optimizing irrigation systems and adjusting crop structures.
|
|
Received: 24 June 2025
Published: 31 December 2025
|
|
Corresponding Authors:
*QIU Chunxia (E-mail: 000358@xust.edu.cn)
|
|
|
| [1] |
Bock L, Lauer A, Schlund M, et al. 2020. Quantifying progress across different CMIP phases with the ESMValTool. Journal of Geophysical Research: Atmospheres, 125(21): e2019JD032321, doi:10.1029/2019JD032321.
|
|
|
| [2] |
Cai S Y, Zuo D P, Wang H X, et al. 2023. Assessment of agricultural drought based on multi-source remote sensing data in a major grain producing area of Northwest China. Agricultural Water Management, 278: 108142, doi:10.1016/j.agwat.2023.108142.
|
|
|
| [3] |
Chen X X, Wang L C, Cao Q, et al. 2024. Response of global agricultural productivity anomalies to drought stress in irrigated and rainfed agriculture. Science China Earth Sciences, 67(11): 3579-3593.
doi: 10.1007/s11430-023-1328-2
|
|
|
| [4] |
Chen Y, Marek G W, Marek T H, et al. 2019. Simulating the impacts of climate change on hydrology and crop production in the Northern High Plains of Texas using an improved SWAT model. Agricultural Water Management, 221: 13-24.
doi: 10.1016/j.agwat.2019.04.021
|
|
|
| [5] |
Cui C L, Zhang W, Hong Z M, et al. 2020. Forecasting NDVI in multiple complex areas using neural network techniques combined feature engineering. International Journal of Digital Earth, 13(12): 1733-1749.
doi: 10.1080/17538947.2020.1808718
|
|
|
| [6] |
Du Z H, Wang Z Y, Wu S S, et al. 2020. Geographically neural network weighted regression for the accurate estimation of spatial non-stationarity. International Journal of Geographical Information Science, 34(7): 1353-1377.
doi: 10.1080/13658816.2019.1707834
|
|
|
| [7] |
Gao J Q, Yang X G, Zheng B Y, et al. 2019. Effects of climate change on the extension of the potential double cropping region and crop water requirements in northern China. Agricultural and Forest Meteorology, 268: 146-155.
doi: 10.1016/j.agrformet.2019.01.009
|
|
|
| [8] |
Han H M, Liu Z H, Barrios B M, et al. 2024. Time series forecasting model for non-stationary series pattern extraction using deep learning and GARCH modeling. Journal of Cloud Computing, 13(1): 2, doi:10.1186/s13677-023-00576-7.
|
|
|
| [9] |
Han X L, Liu X H, Gao L Z, et al. 1986. Climate zoning of crop planting systems in China. Tillage and Cultivation, Z1: 2-19. (in Chinese)
|
|
|
| [10] |
He J, Yang X H, Li J Q, et al. 2015. Spatiotemporal variation of meteorological droughts based on the daily comprehensive drought index in the Haihe River Basin, China. Natural Hazards, 75(2): 199-217.
doi: 10.1007/s11069-014-1158-8
|
|
|
| [11] |
He J, Yang X H, Li Z, et al. 2016. Spatiotemporal variations of meteorological droughts in China during 1961-2014: An investigation based on multi-threshold identification. International Journal of Disaster Risk Science, 7(1): 63-76.
doi: 10.1007/s13753-016-0083-8
|
|
|
| [12] |
He Q, Wang M, Liu K, et al. 2024. High-resolution standardized precipitation evapotranspiration index (SPEI) reveals trends in drought and vegetation water availability in China. Geography and Sustainability, 6(2): 100228, doi:10.1016/j.geosus.2024.08.007.
|
|
|
| [13] |
Institute of Geographic Sciences and Natural Resources Research, Chinese Academy of Sciences. 2005. China's Agricultural Zone Classification. [2025-04-28]. https://www.resdc.cn/data.aspx?DATAID=274.
|
|
|
| [14] |
Javed T, Wang Z H, Liu J, et al. 2025. The influence of agricultural drought on carbon emissions across the four sub-regions of China. Carbon Balance and Management, 20(1): 9, doi:10.1186/s13021-025-00300-9.
|
|
|
| [15] |
Jia H C, Chen F, Zhang C R, et al. 2022. High emissions could increase the future risk of maize drought in China by 60%-70%. Science of the Total Environment, 852: 158474, doi:10.1016/j.scitotenv.2022.158474.
|
|
|
| [16] |
Li W, Jiang Z H, Li L. 2023. Anthropogenic influence on the record-breaking compound hot and dry event in summer 2022 in the Yangtze River Basin in China. Bulletin of the American Meteorological Society, 104(11): E1928-E1934.
|
|
|
| [17] |
Li X Q, Yuan W P, Dong W J. 2021. A machine learning method for predicting vegetation indices in China. Remote Sensing, 13(6): 1147, doi:10.3390/rs13061147.
|
|
|
| [18] |
Liao J J, Yu C Y, Feng Z, et al. 2021. Spatial differentiation characteristics and driving factors of agricultural eco-efficiency in Chinese provinces from the perspective of ecosystem services. Journal of Cleaner Production, 288: 125466, doi:10.1016/j.jclepro.2020.125466.
|
|
|
| [19] |
Linh D T, Shabbir M N. 2025. Climate smart agriculture: A path to sustainable farming in China. Food and Humanity, 5: 100872, doi:10.1016/j.foohum.2025.100872.
|
|
|
| [20] |
Liu Y, Tian J Y, Liu R H, et al. 2021. Influences of climate change and human activities on NDVI changes in China. Remote Sensing, 13(21): 4326, doi:10.3390/rs13214326.
|
|
|
| [21] |
Liu Z H, Lü A F, Li T H. 2024. Intensified drought threatens future food security in major food-producing countries. Atmosphere, 16(1): 34, doi:10.3390/atmos16010034.
|
|
|
| [22] |
Long J C, Xu C C, Wang Y Z, et al. 2024. From meteorological to agricultural drought: Propagation time and influencing factors over diverse underlying surfaces based on CNN-LSTM model. Ecological Informatics, 82: 102681, doi:10.1016/j.ecoinf.2024.102681.
|
|
|
| [23] |
Ma J N, Zhang C, Li S E, et al. 2023. Changes in vegetation resistance and resilience under different drought disturbances based on NDVI and SPEI time series data in Jilin Province, China. Remote Sensing, 15(13): 3280, doi:10.3390/rs15133280.
|
|
|
| [24] |
Ma L, Long H L, Tang L S, et al. 2021. Analysis of the spatial variations of determinants of agricultural production efficiency in China. Computers and Electronics in Agriculture, 180: 105890, doi:10.1016/j.compag.2020.105890.
|
|
|
| [25] |
Mi Q C, Huo Z G, Li M X, et al. 2025. Development of a drought monitoring system for winter wheat in the Huang-Huai-Hai region, China, utilizing a machine learning-physical process hybrid model. Agronomy, 15(3): 696, doi:10.3390/agronomy15030696.
|
|
|
| [26] |
Minoli S, Jägermeyr J, Asseng S, et al. 2022. Global crop yields can be lifted by timely adaptation of growing periods to climate change. Nature Communications, 13(1): 7079, doi:10.1038/s41467-022-34411-5.
|
|
|
| [27] |
Peng L Q, Sheffield J, Wei Z W, et al. 2024. An enhanced Standardized Precipitation-Evapotranspiration Index (SPEI) drought-monitoring method integrating land surface characteristics. Earth System Dynamics, 15(5): 1277-1300.
doi: 10.5194/esd-15-1277-2024
|
|
|
| [28] |
Ren B N, Xiao Y, Liu B, et al. 2025. Exploring the transmission process of carbon sequestration services and its applications: A case study of Hainan. Forests, 16(1): 136, doi:10.3390/f16010136.
|
|
|
| [29] |
Scarpa G, Gargiulo M, Mazza A, et al. 2018. A CNN-based fusion method for feature extraction from sentinel data. Remote Sensing, 10(2): 236, doi:10.3390/rs10020236.
|
|
|
| [30] |
Serkendiz H, Tatli H. 2023. Assessment of multidimensional drought vulnerability using exposure, sensitivity, and adaptive capacity components. Environmental Monitoring and Assessment, 195(10): 1154, doi:10.1007/s10661-023-11711-x.
|
|
|
| [31] |
Su B D, Huang J L, Mondal S K, et al. 2021. Insight from CMIP6 SSP-RCP scenarios for future drought characteristics in China. Atmospheric Research, 250: 105375, doi:10.1016/j.atmosres.2020.105375.
|
|
|
| [32] |
Sun Y, Lao D Z, Ruan Y J, et al. 2023. A deep learning-based approach to predict large-scale dynamics of normalized difference vegetation index for the monitoring of vegetation activities and stresses using meteorological data. Sustainability, 15(8): 6632, doi:10.3390/su15086632.
|
|
|
| [33] |
Tefera M L, Giovanna S, Alberto C, et al. 2024. Rainfall variability and drought in West Africa: challenges and implications for rainfed agriculture. Theoretical and Applied Climatology, 156(1): 41, doi:10.1007/s00704-024-05251-8.
|
|
|
| [34] |
Tuoku L, Wu Z J, Men B H. 2024. Impacts of climate factors and human activities on NDVI change in China. Ecological Informatics, 81: 102555, doi:10.1016/j.ecoinf.2024.102555.
|
|
|
| [35] |
Ullah F, Wang P Y, Saqib S, et al. 2025. Toxicological complexity of microplastics in terrestrial ecosystems. iScience, 28(2): 111879, doi:10.1016/j.isci.2025.111879.
|
|
|
| [36] |
Vetter T, Reinhardt J, Flörke M, et al. 2017. Evaluation of sources of uncertainty in projected hydrological changes under climate change in 12 large-scale river basins. Climatic Change, 141(3): 419-433.
doi: 10.1007/s10584-016-1794-y
|
|
|
| [37] |
Vicente-Serrano S M, Quiring S M, Peña-Gallardo M, et al. 2020. A review of environmental droughts: Increased risk under global warming? Earth-Science Reviews, 201: 102953, doi:10.1016/j.earscirev.2019.102953.
|
|
|
| [38] |
Vicente-Serrano S M, Peña-Angulo D, Beguería S, et al. 2022. Global drought trends and future projections. Philosophical Transactions of the Royal Society A, 380(2238): 20210285, doi:10.1098/rsta.2021.0285.
|
|
|
| [39] |
Wang S N, Xing X G, Wu Y J, et al. 2024a. Seasonal response of the NDVI to the SPEI at different time scales in Yinshanbeilu, Inner Mongolia, China. Land, 13(4): 523, doi:10.3390/land13040523.
|
|
|
| [40] |
Wang S P, Zhang Q, Wang J S, et al. 2021a. Relationship between drought and precipitation heterogeneity: An analysis across rain-fed agricultural regions in eastern Gansu, China. Atmosphere, 12(10): 1274, doi:10.3390/atmos12101274.
|
|
|
| [41] |
Wang X, Xu Y, Li W, et al. 2025a. Unequal impacts of future droughts on global croplands: contributions of climate and land-use changes across different income groups. npj Natural Hazards, 2(1): 93, doi:10.1038/s44304-025-00144-w.
|
|
|
| [42] |
Wang Y G, Wang J X, Gong D H, et al. 2025b. Spatiotemporal heterogeneity and zonal adaptation strategies for agricultural risks of compound dry and hot events in China's middle Yangtze River Basin. Remote Sensing, 17(16): 2892, doi:10.3390/rs17162892.
|
|
|
| [43] |
Wang Y Q, Shen R P, Huang A Q, et al. 2021b. Spatiotemporal dynamic analysis of MODIS LAI reconstructed in different cultivation areas in China from 2001 to 2017. Journal of Geo-information Science, 23(4): 658-669. (in Chinese)
|
|
|
| [44] |
Wang Z Y, Ding J L, Tan J, et al. 2024b. UAV hyperspectral analysis of secondary salinization in arid oasis cotton fields: effects of FOD feature selection and SOA-RF. Frontiers in Plant Science, 15: 1358965, doi:10.3389/fpls.2024.1358965.
|
|
|
| [45] |
Wu C H, Zhong L L, Yeh P J F, et al. 2024. An evaluation framework for quantifying vegetation loss and recovery in response to meteorological drought based on SPEI and NDVI. Science of the Total Environment, 906: 167632, doi:10.1016/j.scitotenv.2023.167632.
|
|
|
| [46] |
Wu P N, Wang Y L, Li Y M, et al. 2023. Optimizing irrigation strategies for sustainable crop productivity and reduced groundwater consumption in a winter wheat-maize rotation system. Journal of Environmental Management, 348: 119469, doi:10.1016/j.jenvman.2023.119469.
|
|
|
| [47] |
Wu S S, Wang Z Y, Du Z H, et al. 2021. Geographically and temporally neural network weighted regression for modeling spatiotemporal non-stationary relationships. International Journal of Geographical Information Science, 35(3): 582-608.
doi: 10.1080/13658816.2020.1775836
|
|
|
| [48] |
Yang L S, Feng Q, Zhu M, et al. 2022. Variation in actual evapotranspiration and its ties to climate change and vegetation dynamics in Northwest China. Journal of Hydrology, 607: 127533, doi:10.1016/j.jhydrol.2022.127533.
|
|
|
| [49] |
Yin R M, Wang Z Q, Xu F. 2023. Multi-scenario simulation of China's dynamic relationship between water-land resources allocation and cultivated land use based on shared socioeconomic pathways. Journal of Environmental Management, 341: 118062, doi:10.1016/j.jenvman.2023.118062.
|
|
|
| [50] |
Yu G R, Piao S L, Zhang Y J, et al. 2021. Moving toward a new era of ecosystem science. Geography and Sustainability, 2(3): 151-162.
doi: 10.1016/j.geosus.2021.06.004
|
|
|
| [51] |
Yu T Z, Mahe L, Li Y, et al. 2022. Benefits of crop rotation on climate resilience and its prospects in China. Agronomy, 12(2): 436, doi:10.3390/agronomy12020436.
|
|
|
| [52] |
Zhang X, Fan Y C, Tjiputra J, et al. 2025. Divergent impacts of climate interventions on China's north-south water divide. Communications Earth & Environment, 6: 736, doi:10.1038/s43247-025-02708-0.
|
|
|
| [53] |
Zhao J Q, Zhang Q, Zhu X D, et al. 2020. Drought risk assessment in China: Evaluation framework and influencing factors. Geography and Sustainability, 1(3): 220-228.
doi: 10.1016/j.geosus.2020.06.005
|
|
|
| [54] |
Zhao W Z, Bo Y C, Chen J G, et al. 2019. Exploring semantic elements for urban scene recognition: Deep integration of high-resolution imagery and OpenStreetMap (OSM). ISPRS Journal of Photogrammetry and Remote Sensing, 151: 237-250.
doi: 10.1016/j.isprsjprs.2019.03.019
|
|
|
| [55] |
Zhao Z Q, Gao J B, Wang Y L, et al. 2015. Exploring spatially variable relationships between NDVI and climatic factors in a transition zone using geographically weighted regression. Theoretical and Applied Climatology, 120(3): 507-519.
doi: 10.1007/s00704-014-1188-x
|
|
|
| [56] |
Zou J, Ding J L, Welp M, et al. 2020. Assessing the response of ecosystem water use efficiency to drought during and after drought events across Central Asia. Sensors, 20(3): 581, doi:10.3390/s20030581.
|
|
|
|
Viewed |
|
|
|
Full text
|
|
|
|
|
Abstract
|
|
|
|
|
Cited |
|
|
|
|
| |
Shared |
|
|
|
|
| |
Discussed |
|
|
|
|