| Research article |
|


|
|
|
| Wind and sand control in composite shelterbelts combining Cyperus esculentus with trees and shrubs: Evidence from wind tunnel and field studies |
NIE Bixia1,2,3,4, SHEN Xin1,2,3,4, LIU Yalan1,2,3,4, LI Xiangyi1,2,3,4,*( ) ) |
1 Xinjiang Key Laboratory of Desert Plant Roots Ecology and Vegetation Restoration, Xinjiang Institute of Ecology and Geography, Chinese Academy of Sciences, Urumqi 830011, China
2 Cele National Station of Observation and Research for Desert-Grassland Ecosystems, Cele 848300, China
3 State Key Laboratory of Ecological Safety and Sustainable Development in Arid Lands, Urumqi 830011, China
4 University of Chinese Academy of Sciences, Beijing 100049, China |
|
|
|
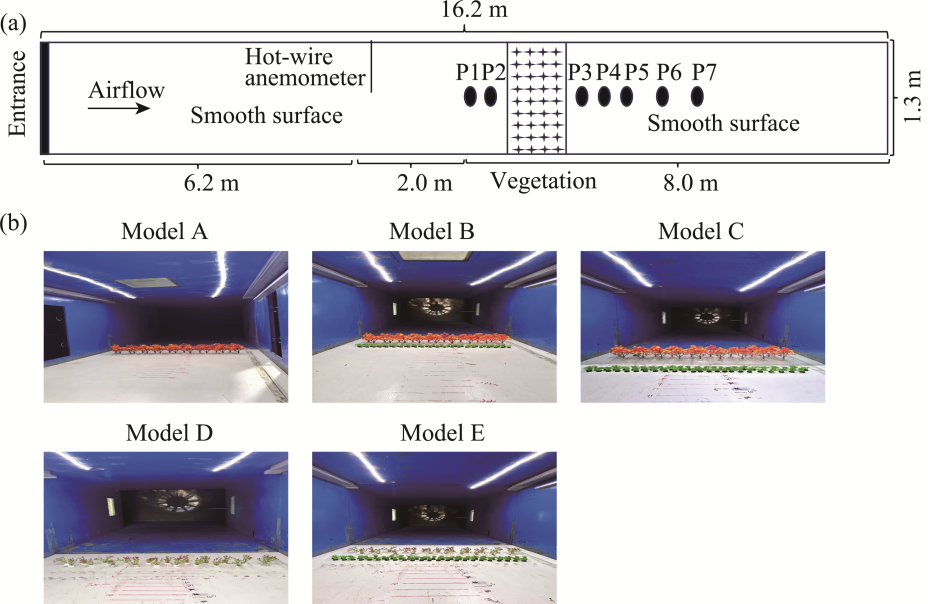
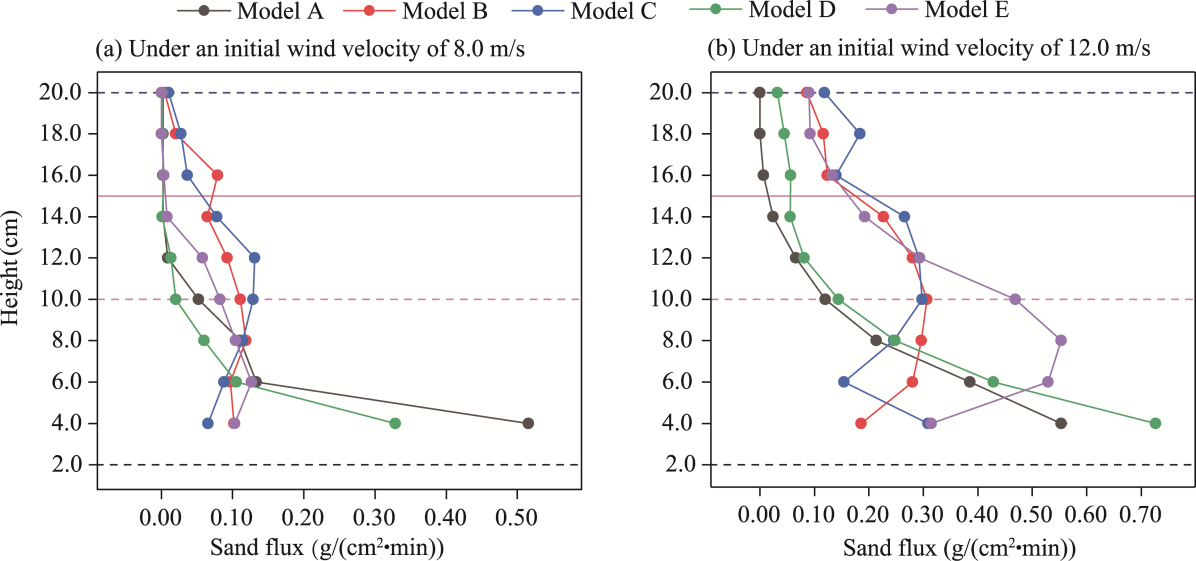
Abstract Cyperus esculentus (C. esculentus), a desert-adapted plant species with both ecological and economic value, has been widely cultivated in northern China's sandy regions. However, limited studies have investigated the performance of composite shelterbelts that integrate C. esculentus. This study systematically evaluated five shelterbelt models—Populus euphratica (P. euphratica), P. euphratica-C. esculentus composite, P. euphratica-nylon net-C. esculentus composite, Tamarix chinensis (T. chinensis), and T. chinensis-C. esculentus composite—using wind tunnel experiments and field observations. Sediment flux was measured at a normalized downwind distance (x/h) of 5, where x refers to the distance from the front edge (upwind side) of the shelterbelt for upwind measurements, and the distance from the rear edge (downwind side) for downwind measurements, and h represents the canopy height. Wind velocity was measured at x/h of -2, -1, 1, 2, 3, 5, and 7, and sand flux was measured at x/h=5, under initial wind velocities of 8.0 and 12.0 m/s. The results indicated that the P. euphratica-nylon net-C. esculentus composite was the most effective in reducing wind velocity, followed by the P. euphratica-C. esculentus composite. In contrast, the P. euphratica and T. chinensis exhibited relatively weaker wind reduction capabilities. Regarding sand flux, under moderate wind velocity (8.0 m/s), both the P. euphratica-C. esculentus composite and P. euphratica-nylon net-C. esculentus composite demonstrated the lowest sand flux values. However, under high wind velocity (12.0 m/s), the P. euphratica-nylon net-C. esculentus composite significantly outperformed the other shelterbelt models in sand retention, highlighting its superior windbreak and sand fixation efficacy. Field observations further validated the windbreak and sand fixation effects of C. esculentus. Comparisons between the bare sand plot and C. esculentus plot within protective forests demonstrated that planting C. esculentus can provide substantial ecological benefits in windbreak and sand-fixation. These findings, reinforced by field observations, strengthen the wind tunnel experiment results and highlight the critical role of C. esculentus in enhancing the performance of composite shelterbelts for desert ecological restoration.
|
|
Received: 06 May 2025
Published: 28 February 2026
|
|
Corresponding Authors:
*LI Xiangyi (E-mail: lixy@ms.xjb.ac.cn)
|
|
|
| [1] |
Aili A, Xu H L, Waheed A, et al. 2024. Synergistic windbreak efficiency of desert vegetation and oasis shelter forests. PLoS ONE, 19(10): e0312876, doi: 10.1371/journal.pone.0312876.
|
|
|
| [2] |
Aydar E F, Tutuncu S, Ozcelik B. 2020. Plant-based milk substitutes: Bioactive compounds, conventional and novel processes, bioavailability studies, and health effects. Journal of Functional Foods, 70: 103975, doi: 10.1016/j.jff.2020.103975.
|
|
|
| [3] |
Barrett R L. 2024. Sedges on the edge: new agronomic and research opportunities? Plant and Soil, 495(1-2): 195-200.
doi: 10.1007/s11104-023-06145-w
|
|
|
| [4] |
Cleugh H A. 1998. Effects of windbreaks on airflow, microclimates and crop yields. Agroforestry Systems, 41(1): 55-84.
doi: 10.1023/A:1006019805109
|
|
|
| [5] |
Cornelis W M, Gabriels D. 2005. Optimal windbreak design for wind-erosion control. Journal of Arid Environments, 61(2): 315-332.
doi: 10.1016/j.jaridenv.2004.10.005
|
|
|
| [6] |
D'Ettorre U S, Liso I S, Parise M. 2024. Desertification in karst areas: A review. Earth-Science Reviews, 253: 104786, doi: 10.1016/j.earscirev.2024.104786.
|
|
|
| [7] |
Du Y, Zhang Y L, Chai X T, et al. 2023. Effects of different tillage systems and mowing time on nutrient accumulation and forage nutritive value of Cyperus esculentus. Frontiers in Plant Science, 14: 1162572, doi: 10.3389/fpls.2023.1162572.
|
|
|
| [8] |
Dupont S, Bergametti G, Simoëns S. 2015. Modelling aeolian erosion in presence of vegetation. Procedia IUTAM, 17: 91-100.
doi: 10.1016/j.piutam.2015.06.013
|
|
|
| [9] |
Fu L T. 2019. Comparisons suggest more efforts are required to parameterize wind flow around shrub vegetation elements for predicting aeolian flux. Scientific Reports, 9: 3841, doi: 10.1038/s41598-019-40491-z.
|
|
|
| [10] |
Gao H. 2010. Study on effect on windspeed reduction and sand-break by low coverage belt Caragana Korshinskii Kom. plantation. PhD Dissertation. Beijing: Beijing Forestry University. (in Chinese)
|
|
|
| [11] |
Gillies J A, Nield J M, Nickling W G. 2014. Wind speed and sediment transport recovery in the lee of a vegetated and denuded nebkha within a nebkha dune field. Aeolian Research, 12: 135-141.
doi: 10.1016/j.aeolia.2013.12.005
|
|
|
| [12] |
Gui D W, Liu Q, Martínez-Valderrama J, et al. 2024. Desertification baseline: A bottleneck for addressing desertification. Earth-Science Reviews, 257: 104892, doi: 10.1016/j.earscirev.2024.104892.
|
|
|
| [13] |
Hesp P A, Dong Y X, Cheng H, et al. 2019. Wind flow and sedimentation in artificial vegetation: Field and wind tunnel experiments. Geomorphology, 337: 165-182.
doi: 10.1016/j.geomorph.2019.03.020
|
|
|
| [14] |
Hou S A, Yu Y, Wang Q Y. 2024. Predictive modeling of diverse factors impacting regional soil erosion degree with machine learning. Earth Science Informatics, 17(4): 3039-3051.
doi: 10.1007/s12145-024-01329-z
|
|
|
| [15] |
Jacobs A F G, Van Boxel J H. 1988. Changes of the displacement height and roughness length of maize during a growing season. Agricultural and Forest Meteorology, 42(1): 53-62.
doi: 10.1016/0168-1923(88)90066-4
|
|
|
| [16] |
Jiang N, Zhang Q Q, Zhang S C, et al. 2022. Spatial and temporal evolutions of vegetation coverage in the Tarim River Basin and their responses to phenology. CATENA, 217: 106489, doi: 10.1016/j.catena.2022.106489.
|
|
|
| [17] |
Jiang N, Cheng H, Liu C C, et al. 2024. A wind tunnel study of the effects of vegetation structural characteristics on the airflow field. CATENA, 242: 108064, doi: 10.1016/j.catena.2024.108064.
|
|
|
| [18] |
King J, Nickling W G, Gillies J A. 2005. Representation of vegetation and other nonerodible elements in aeolian shear stress partitioning models for predicting transport threshold. Journal of Geophysical Research-Earth Surface, 110 (F4): F04015, doi: 10.1029/2004JF000281.
|
|
|
| [19] |
King J, Nickling W G, Gillies J A. 2006. Aeolian shear stress ratio measurements within mesquite-dominated landscapes of the Chihuahuan Desert, New Mexico, USA. Geomorphology, 82(3-4): 229-244.
doi: 10.1016/j.geomorph.2006.05.004
|
|
|
| [20] |
Latif Bhutto S, Miri A, Zhang Y, et al. 2022. Experimental study on the effect of four single shrubs on aeolian erosion in a wind tunnel. CATENA, 212: 106097, doi: 10.1016/j.catena.2022.106097.
|
|
|
| [21] |
Leenders J K, van Boxel J H, Sterk G. 2007. The effect of single vegetation elements on wind speed and sediment transport in the Sahelian zone of Burkina Faso. Earth Surface Processes and Landforms, 32(10): 1454-1474.
doi: 10.1002/esp.v32:10
|
|
|
| [22] |
Li H L, Wang Y D, Li S Y, et al. 2022. Shelter efficiency of various shelterbelt configurations: A wind tunnel study. Atmosphere, 13(7): 1022, doi: 10.3390/atmos13071022.
|
|
|
| [23] |
Li J, Dong S, Li Y. 2021. Comparative study on windbreak effects of two different configuration shelterbelts. IOP Conference Series: Earth and Environmental Science, 895: 012020, doi: 10.1088/1755-1315/895/1/012020.
|
|
|
| [24] |
Li M, Zhang Z Y, Ju C X, et al. 2023. Sensitivity of temperature and precipitation characteristics to land use classification over the Taklimakan Desert and surrounding area. Theoretical and Applied Climatology, 154 (3-4): 987-998.
doi: 10.1007/s00704-023-04608-9
|
|
|
| [25] |
Li Y Q, Brandle J, Awada T, et al. 2013. Accumulation of carbon and nitrogen in the plant-soil system after afforestation of active sand dunes in China's Horqin Sandy Land. Agriculture, Ecosystems & Environment, 177: 75-84.
doi: 10.1016/j.agee.2013.06.007
|
|
|
| [26] |
Liu Y L, Ren W, Zhao Y, et al. 2022. Effect of variation in row spacing on soil wind erosion, soil properties, and Cyperus esculentus yield in sandy land. Sustainability, 14(21): 14200, doi: 10.3390/su142114200.
|
|
|
| [27] |
Mayaud J R, Wiggs G F S, Bailey R M. 2016a. Dynamics of skimming flow in the wake of a vegetation patch. Aeolian Research, 22: 141-151.
doi: 10.1016/j.aeolia.2016.08.001
|
|
|
| [28] |
Mayaud J R, Wiggs G F S, Bailey R M. 2016b. Characterizing turbulent wind flow around dryland vegetation. Earth Surface Processes and Landforms, 41(10): 1421-1436.
doi: 10.1002/esp.v41.10
|
|
|
| [29] |
Miri A, Dragovich D, Dong Z B. 2017. Vegetation morphologic and aerodynamic characteristics reduce aeolian erosion. Scientific Reports, 7: 12831, doi: 10.1038/s41598-017-13084-x.
|
|
|
| [30] |
Miri A, Dragovich D, Dong Z B. 2018. The response of live plants to airflow—Implication for reducing erosion. Aeolian Research, 33: 93-105.
doi: 10.1016/j.aeolia.2018.06.002
|
|
|
| [31] |
Miri A, Dragovich D, Dong Z B. 2019. Wind-borne sand mass flux in vegetated surfaces—Wind tunnel experiments with live plants. CATENA, 172: 421-434.
doi: 10.1016/j.catena.2018.09.006
|
|
|
| [32] |
Miri A, Davidson-Arnott R. 2021. The effectiveness of a single Tamarix tree in reducing aeolian erosion in an arid region. Agricultural and Forest Meteorology, 300: 108324, doi: 10.1016/j.agrformet.2021.108324
|
|
|
| [33] |
Miri A, Dragovich D, Dong Z B. 2021. Wind flow and sediment flux profiles for vegetated surfaces in a wind tunnel and field-scale windbreak. CATENA, 196: 104836, doi: 10.1016/j.catena.2020.104836.
|
|
|
| [34] |
Nickling W G. 1983. Grain-size characteristics of sediment transported during dust storms. Journal of Sedimentary Research, 53(3): 1011-1024.
|
|
|
| [35] |
Okin G S. 2008. A new model of wind erosion in the presence of vegetation. Journal of Geophysical Research: Earth Surface, 113(F2), F02S10, doi: 10.1029/2007JF000758.
|
|
|
| [36] |
Pi H W, Huggins D R, Sharratt B. 2020. Threshold friction velocities influenced by standing crop residue in the inland Pacific Northwest, USA. Land Degradation & Development, 31(16): 2356-2368.
doi: 10.1002/ldr.v31.16
|
|
|
| [37] |
Salvati L. 2014. A socioeconomic profile of vulnerable land to desertification in Italy. Science of The Total Environment, 466-467: 287-299.
doi: 10.1016/j.scitotenv.2013.06.091
|
|
|
| [38] |
Seginer I. 1975. Flow around a windbreak in oblique wind. Boundary-Layer Meteorology, 9: 133-141.
doi: 10.1007/BF00215636
|
|
|
| [39] |
Shen X, Sun M X, Nie B X, et al. 2024. Physiological adaptation of Cyperus esculentus L. seedlings to varying concentrations of saline-alkaline stress: Insights from photosynthetic performance. Plant Physiology and Biochemistry, 214: 108911, doi: 10.1016/j.plaphy.2024.108911.
|
|
|
| [40] |
Torita H, Satou H. 2007. Relationship between shelterbelt structure and mean wind reduction. Agricultural and Forest Meteorology, 145(3-4): 186-194.
doi: 10.1016/j.agrformet.2007.04.018
|
|
|
| [41] |
Wang H F, Li Z Q, Goloub P, et al. 2022. Identification of typical dust sources in Tarim Basin based on multi-wavelength Raman polarization lidar. Atmospheric Environment, 290: 119358, doi: 10.1016/j.atmosenv.2022.119358.
|
|
|
| [42] |
Wu T G, Yu M K, Wang G, et al. 2012. Effects of stand structure on wind speed reduction in a Metasequoia glyptostroboides shelterbelt. Agroforestry Systems, 87(2): 251-257.
doi: 10.1007/s10457-012-9540-6
|
|
|
| [43] |
Wu X X, Zou X X, Zhou N, et al. 2015. Deceleration efficiencies of shrub windbreaks in a wind tunnel. Aeolian Research, 16: 11-23.
doi: 10.1016/j.aeolia.2014.10.004
|
|
|
| [44] |
Yang B, Raupach M R, Shaw R H, et al. 2006. Large-eddy simulation of turbulent flow across a forest edge. Part I: Flow statistics. Boundary-Layer Meteorol, 120(3): 377-412.
doi: 10.1007/s10546-006-9057-5
|
|
|
| [45] |
Yang X G, Li F R, Fan W Y, et al. 2021. Evaluating the efficiency of wind protection by windbreaks based on remote sensing and geographic information systems. Agroforestry Systems, 95: 353-365.
doi: 10.1007/s10457-021-00594-x
|
|
|
| [46] |
Yuan W W, Zhu N F, Zhang L, et al. 2024. Three-dimensional aerodynamic structure estimation and wind field simulation for wide tree shelterbelts. Forest Ecology and Management, 559: 121813, doi: 10.1016/j.foreco.2024.121813.
|
|
|
| [47] |
Zhang K, Qu J J, Zhang X X, et al. 2022. Protective efficiency of railway Arbor-shrub windbreak forest belts in Gobi regions: Numerical simulation and wind tunnel tests. Frontiers in Environmental Science, 10: 885070, doi: 10.3389/fenvs.2022.885070.
|
|
|
| [48] |
Zhang S, Yuan W J, Yu Y, et al. 2024. Shrubs plays an important role in configuration of shelterbelt in windy and sandy areas. Frontiers in Ecology and Evolution, 12: 1347714, doi: 10.3389/fevo.2024.1347714.
|
|
|
|
Viewed |
|
|
|
Full text
|
|
|
|
|
Abstract
|
|
|
|
|
Cited |
|
|
|
|
| |
Shared |
|
|
|
|
| |
Discussed |
|
|
|
|