| Research article |
|


|
|
|
| Multi-media distribution, sources, and ecological risk of per- and poly-fluoroalkyl substances (PFAS) in the Weihe River Basin, China |
TANG Bin1,2,3,4, SONG Jinxi1,2,3,4,*( ), LU Aoran1,2,3,4, ZHANG Zhuo1,2,3,4, MAO Ruichen5, YANG Chenxi1,2,3,4, LI Nan1,2,3,4, FENG Jiayuan1,2,3,4 ), LU Aoran1,2,3,4, ZHANG Zhuo1,2,3,4, MAO Ruichen5, YANG Chenxi1,2,3,4, LI Nan1,2,3,4, FENG Jiayuan1,2,3,4 |
1 Xi'an Key Laboratory of Environmental Simulation and Ecological Health in the Yellow River Basin, Xi'an 710127, China
2 Shaanxi Key Laboratory of Earth Surface System and Environmental Carrying Capacity, Xi'an 710127, China
3 College of Urban and Environmental Sciences, Northwest University, Xi'an 710127, China
4 Yellow River Institute of Shaanxi Province, Xi'an 710127, China
5 School of Water and Environment, Chang'an University, Xi'an 710054, China |
|
|
|
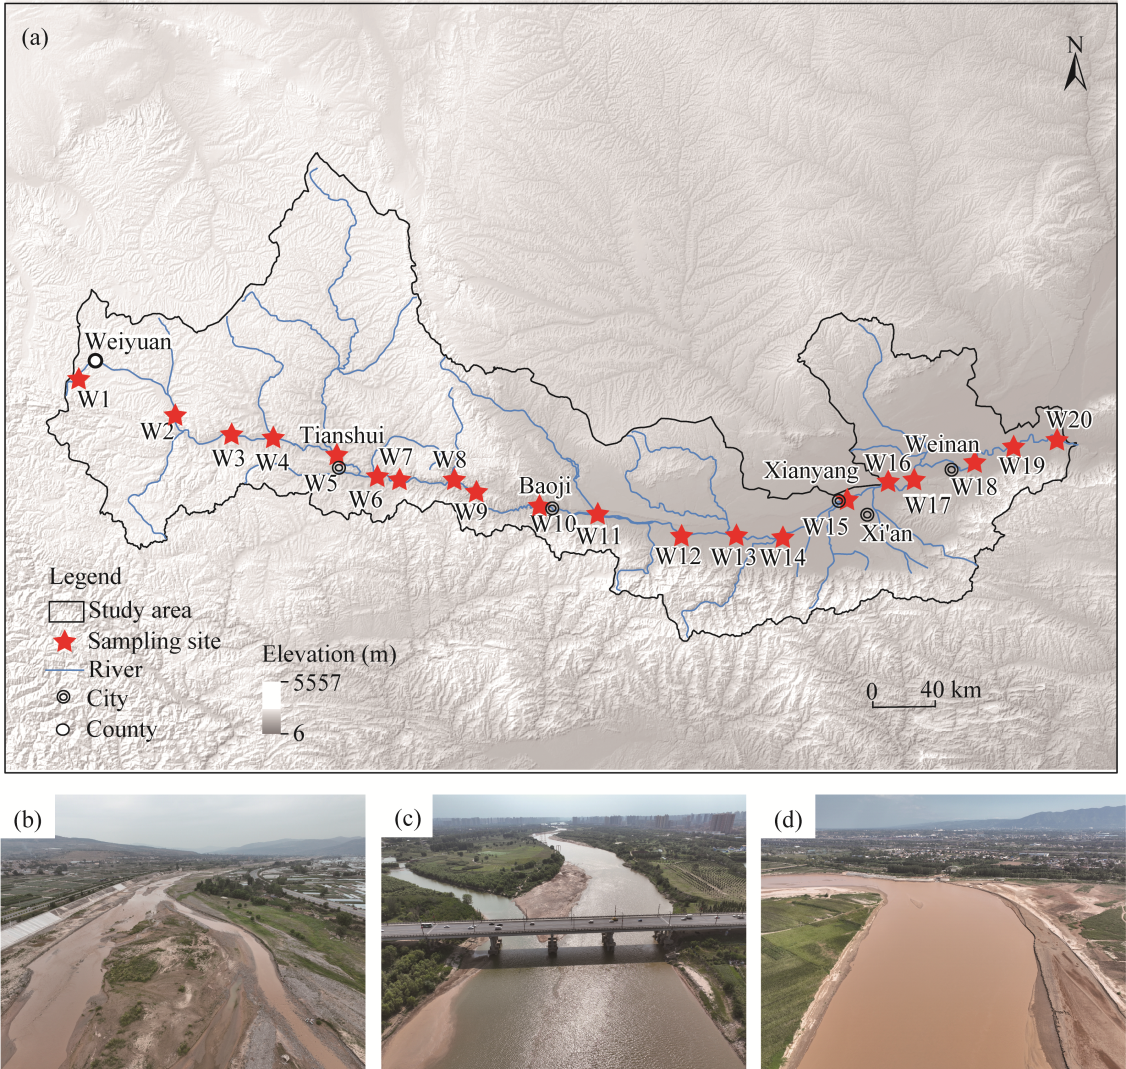
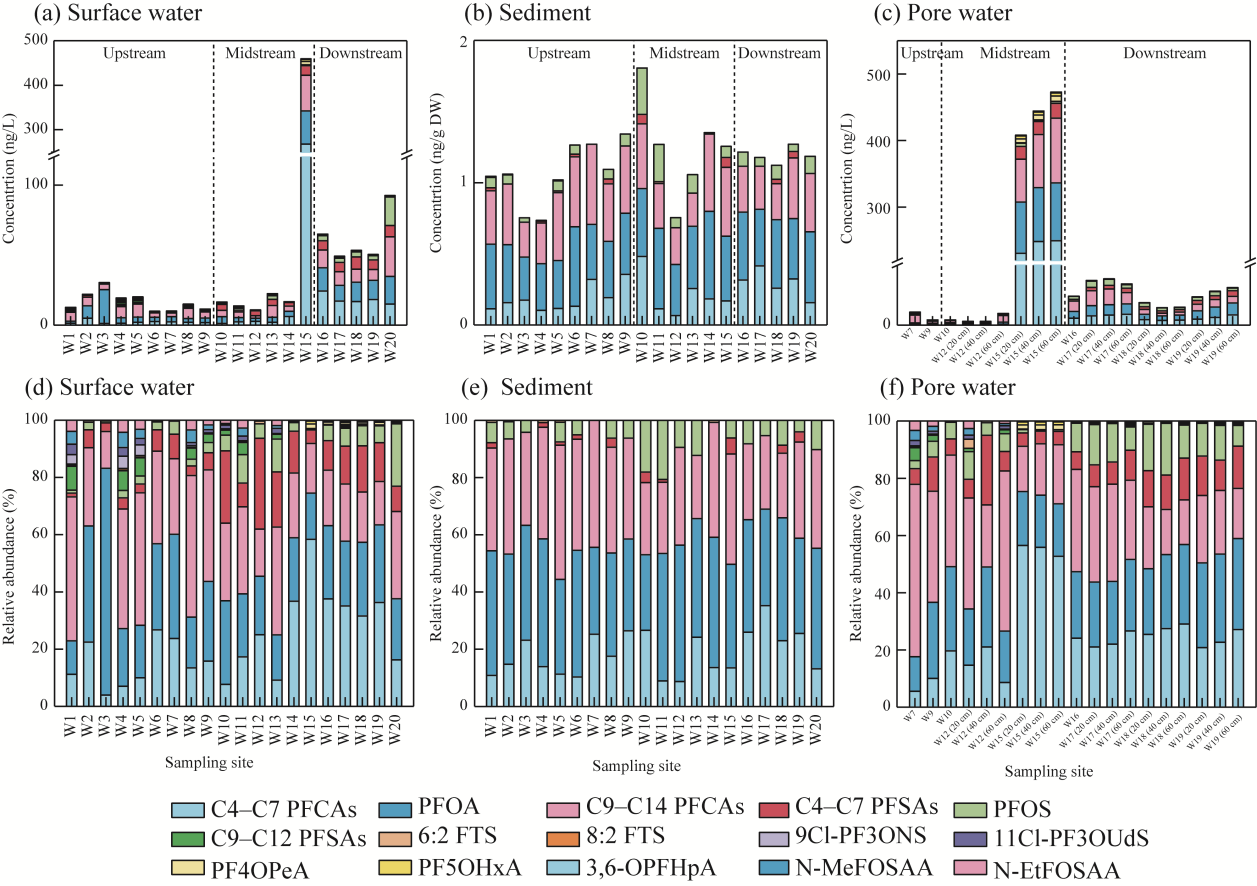
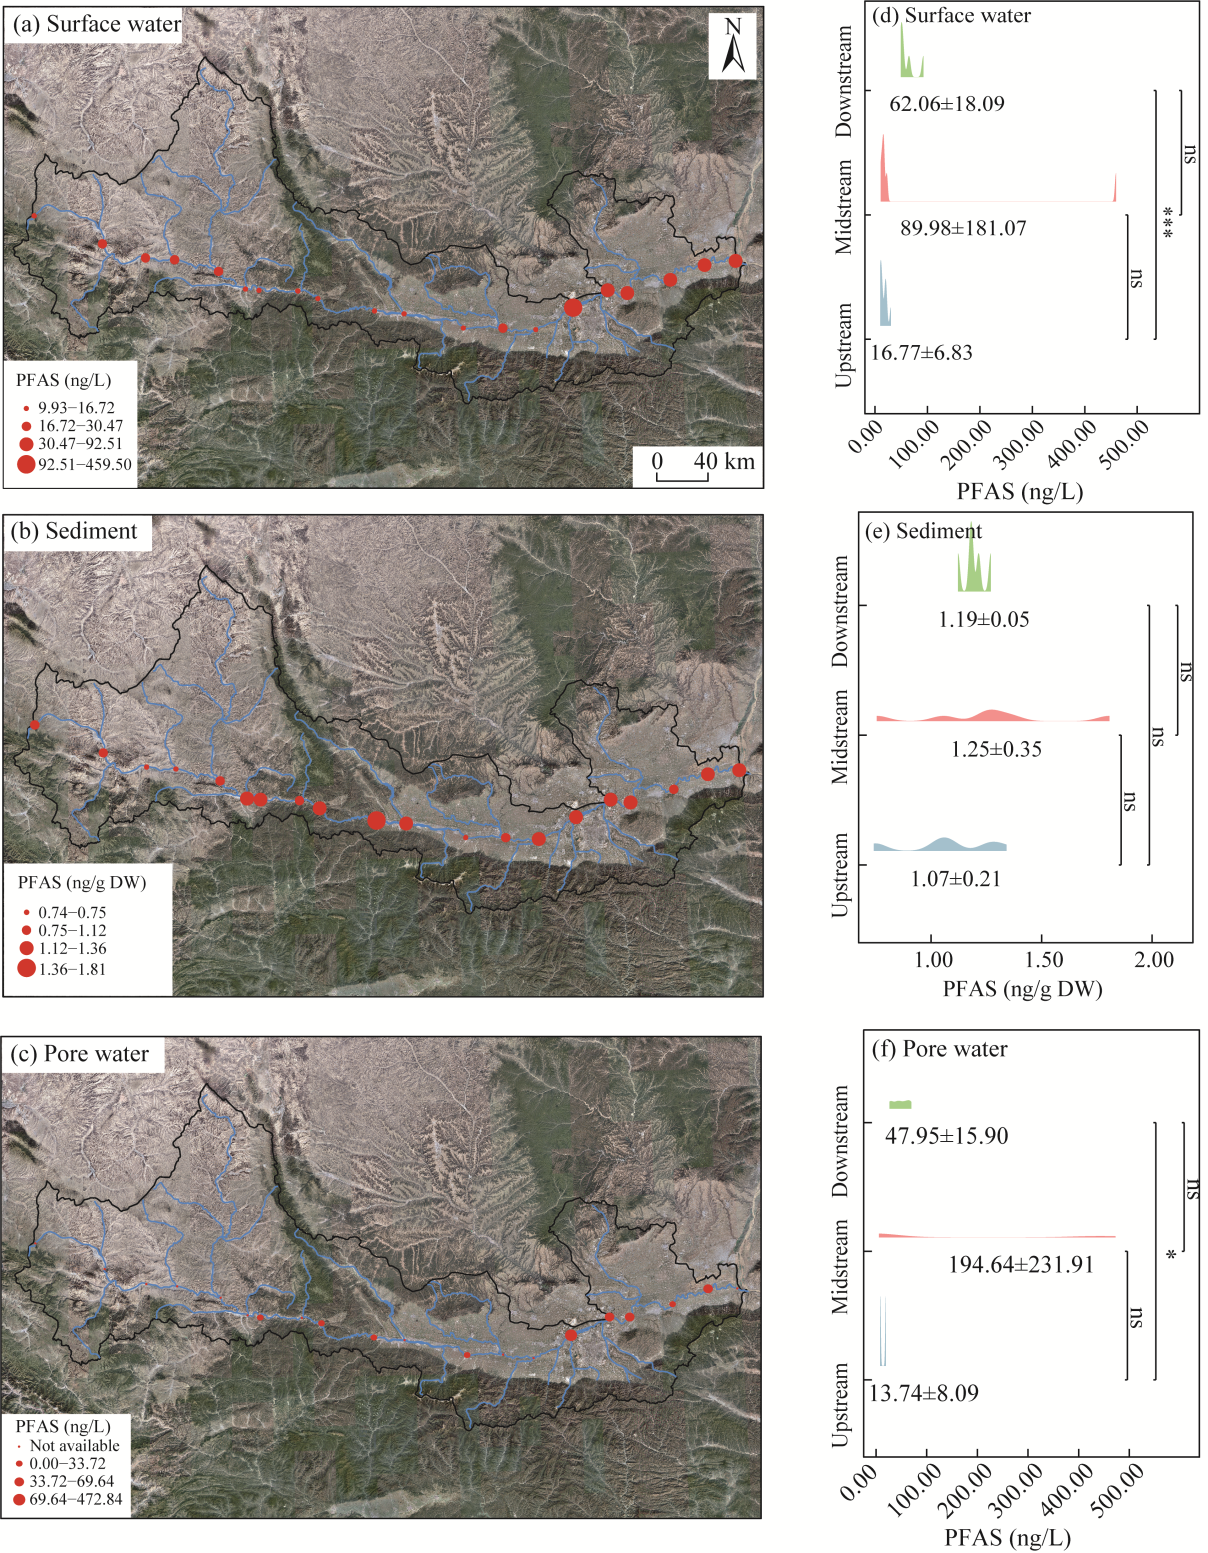
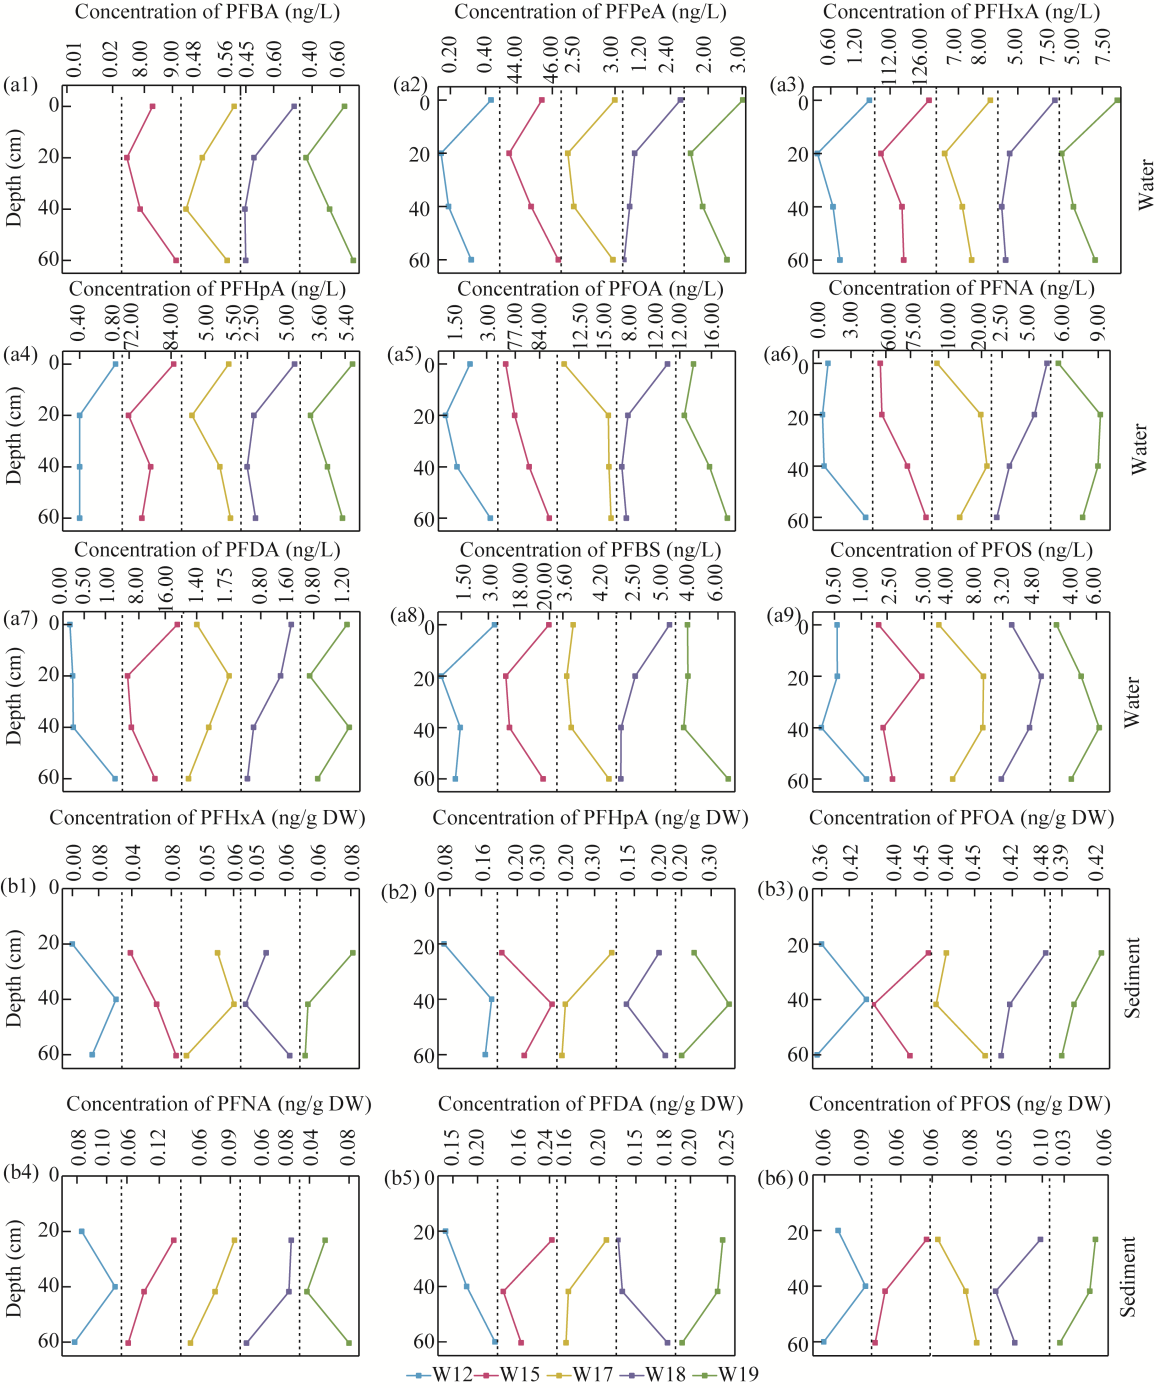
Abstract Per- and poly-fluoroalkyl substances (PFAS) have garnered significant global attention due to their widespread presence and potential environmental and health risks. However, research on the occurrence and environmental behavior of PFAS across different media remains limited. We analyzed the occurrence, distribution, sources, and ecological risks of 32 PFAS across multiple media in the Weihe River, China. The concentrations of PFAS ranged from 5.89 to 472.84 ng/L in the pore water and from 9.93 to 459.50 ng/L in surface water, exhibiting significant spatial variability (P<0.05). In contrast, the PFAS concentration range in the sediments was 0.74-1.81 ng/g dry weight, with no pronounced spatial variation in solid-phase PFAS (P>0.05). Vertically, concentrations in 33.00% of pore water samples exceeded those in surface water, showing a heterogeneous vertical distribution with enrichment at depths of 40-60 cm. The physical-chemical characteristics of PFAS and the hydrological and sedimentary processes at the basin scale were responsible for PFAS partitioning between the aquatic environment and sediments. Four major sources were identified through integrated source apportionment: industrial and domestic wastewater (58.25%), aqueous film-forming foam (18.07%), combined input from household pollution and metal plating (8.70%), and stormwater runoff and landfill leachate (14.98%). The ecological risk assessment revealed negligible risks from short-chain PFAS in surface water and pore water, whereas long-chain PFAS posed low to moderate ecological risks. Furthermore, the discharge of PFAS from the Weihe River to the Yellow River was estimated up to 708.20 kg/a. This study provides critical data informing strategies for mitigating PFAS pollution in rivers across typical arid and semi-arid areas of China.
|
|
Received: 28 September 2025
Published: 30 April 2026
|
|
Corresponding Authors:
*SONG Jinxi (E-mail: jinxisong@nwu.edu.cn)
|
| Cite this article:
TANG Bin, SONG Jinxi, LU Aoran, ZHANG Zhuo, MAO Ruichen, YANG Chenxi, LI Nan, FENG Jiayuan. Multi-media distribution, sources, and ecological risk of per- and poly-fluoroalkyl substances (PFAS) in the Weihe River Basin, China. Journal of Arid Land, 2026, 18(4): 632-656.
URL:
http://jal.xjegi.com/10.1016/j.jaridl.2026.04.005 OR http://jal.xjegi.com/Y2026/V18/I4/632
|
|
|
| [1] |
Boano F, Harvey J W, Marion A, et al. 2014. Hyporheic flow and transport processes: Mechanisms, models, and biogeochemical implications. Reviews of Geophysics, 52(4): 603-679.
doi: 10.1002/2012RG000417
|
|
|
| [2] |
Buck R C, Franklin J, Berger U, et al. 2011. Perfluoroalkyl and polyfluoroalkyl substances in the environment: terminology, classification, and origins. Integrated Environmental Assessment and Management, 7(4): 513-541.
doi: 10.1002/ieam.258
pmid: 21793199
|
|
|
| [3] |
Cai L L, Hu J R, Li J, et al. 2022. Occurrence, source apportionment, and pollution assessment of per- and polyfluoroalkyl substances in a river across rural and urban areas. Science of The Total Environment, 835: 155505, doi: 10.1016/j.scitotenv.2022.155505.
|
|
|
| [4] |
Cai M H, Yang H Z, Xie Z Y, et al. 2012. Per- and polyfluoroalkyl substances in snow, lake, surface runoff water and coastal seawater in Fildes Peninsula, King George Island, Antarctica. Journal of Hazardous Materials, 209-210: 335-342.
doi: 10.1016/j.jhazmat.2012.01.030
pmid: 22305203
|
|
|
| [5] |
Chang J X, Wang Y M, Istanbulluoglu E, et al. 2015. Impact of climate change and human activities on runoff in the Weihe River Basin, China. Quaternary International, 380-381: 169-179.
|
|
|
| [6] |
Chen S, Jiao X C, Gai N, et al. 2016. Perfluorinated compounds in soil, surface water, and groundwater from rural areas in eastern China. Environmental Pollution, 211: 124-131.
doi: 10.1016/j.envpol.2015.12.024
pmid: 26745397
|
|
|
| [7] |
Chen Y, Wei L J, Luo W, et al. 2023. Occurrence, spatial distribution, and sources of PFASs in the water and sediment from lakes in the Tibetan Plateau. Journal of Hazardous Materials, 443: 130170, doi: 10.1016/j.jhazmat.2022.130170.
|
|
|
| [8] |
Cheng D M, Liu X H, Wang L, et al. 2014. Seasonal variation and sediment-water exchange of antibiotics in a shallower large lake in North China. Science of The Total Environment, 476-477: 266-275.
doi: 10.1016/j.scitotenv.2014.01.010
|
|
|
| [9] |
DEEGS (Department of Ecology and Environment of Gansu Province). 2025. Report on the state of the ecology and environment in Gansu 2024. DEEGS, Lanzhou, China. [2025-04-22]. https://sthj.gansu.gov.cn/.
|
|
|
| [10] |
DEESX (Department of Ecology and Environment of Shaanxi Province). 2025. Report on the state of the ecology and environment in Shaanxi 2024. DEESX, Xi'an, China. [2025-05-26]. https://sthjt.shaanxi.gov.cn/.
|
|
|
| [11] |
Diao J Y, Chen Z W, Wang T Y, et al. 2022. Perfluoroalkyl substances in marine food webs from South China Sea: Trophic transfer and human exposure implication. Journal of Hazardous Materials, 431: 128602, doi: 10.1016/j.jhazmat.2022.128602.
|
|
|
| [12] |
Dosunmu O, Whiting R, Matharu A, et al. 2025. The unintentional role of chemical regulation in regrettable substitution: The case of PFAS. Environmental Science & Policy, 174: 104275, doi: 10.1016/j.envsci.2025.104275.
|
|
|
| [13] |
EPA (Environmental Protection Agency). 2012. Ecological Structure-Activity Relationships Program (ECOSAR) Methodology Document v2.0. Washington DC:EPA.
|
|
|
| [14] |
Evich M G, Davis M J B, McCord J P, et al. 2022. Per- and polyfluoroalkyl substances in the environment. Science, 375(6580): eabg9065, doi: 10.1126/science.abg9065.
|
|
|
| [15] |
Gao L J, Liu J L, Bao K, et al. 2020. Multicompartment occurrence and partitioning of alternative and legacy per- and polyfluoroalkyl substances in an impacted river in China. Science of The Total Environment, 729: 138753, doi: 10.1016/j.scitotenv.2020.138753.
|
|
|
| [16] |
Ghaznavi S M, Choudhary M, Hannan M, et al. 2025. A critical review of per-and polyfluoroalkyl substances adsorption by soil. Journal of Hazardous Materials: Organics, 1(1): 100001, doi: 10.1016/j.hazmo.2025.100001.
|
|
|
| [17] |
Glüge J, Scheringer M, Cousins I T, et al. 2020. An overview of the uses of per- and polyfluoroalkyl substances (PFAS). Environmental Science: Processes & Impacts, 22(12): 2345-2373.
|
|
|
| [18] |
Guelfo J L, Higgins C P. 2013. Subsurface transport potential of perfluoroalkyl acids at Aqueous Film-Forming Foam (AFFF)-Impacted Sites. Environmental Science & Technology, 47(9): 4164-4171.
doi: 10.1021/es3048043
|
|
|
| [19] |
Hamid H, Li L Y, Grace J R. 2020. Formation of perfluorocarboxylic acids from 6:2 fluorotelomer sulfonate (6:2 FTS) in landfill leachate: Role of microbial communities. Environmental Pollution, 259: 113835, doi: 10.1016/j.envpol.2019.113835.
|
|
|
| [20] |
Heys K A, Shore R F, Pereira M G, et al. 2016. Risk assessment of environmental mixture effects. RSC Advances, 6(53): 47844-47857.
doi: 10.1039/C6RA05406D
|
|
|
| [21] |
Higgins C P, Luthy R G. 2006. Sorption of perfluorinated surfactants on sediments. Environmental Science & Technology, 40(23): 7251-7256.
doi: 10.1021/es061000n
|
|
|
| [22] |
Hu J J, Yu S K, Yin C, et al. 2025. Sorption and mechanisms of legacy and emerging per- and polyfluoroalkyl substances (PFASs) on different particle size fractions of marine sediments. Environmental Research, 278: 121643, doi: 10.1016/j.envres.2025.121643.
|
|
|
| [23] |
Hubert M, Arp H P H, Hansen M C, et al. 2023. Influence of grain size, organic carbon and organic matter residue content on the sorption of per-and polyfluoroalkyl substances in aqueous film forming foam contaminated soils-Implications for remediation using soil washing. Science of The Total Environment, 875: 162668, doi: 10.1016/j.scitotenv.2023.162668.
|
|
|
| [24] |
Jurado E, Zaldivar J M, Marinov D, et al. 2007. Fate of persistent organic pollutants in the water column: Does turbulent mixing matter? Marine Pollution Bulletin, 54(4): 441-451.
pmid: 17257629
|
|
|
| [25] |
Land M, de Wit C A, Bignert A, et al. 2018. What is the effect of phasing out long-chain per- and polyfluoroalkyl substances on the concentrations of perfluoroalkyl acids and their precursors in the environment? A systematic review. Environmental Evidence, 7(1): 4, doi: 10.1186/s13750-017-0114-y.
|
|
|
| [26] |
Lee Y M, Lee J Y, Kim M K, et al. 2020. Concentration and distribution of per- and polyfluoroalkyl substances (PFAS) in the Asan Lake area of South Korea. Journal of Hazardous Materials, 381: 120909, doi: 10.1016/j.jhazmat.2019.120909.
|
|
|
| [27] |
Li F, Duan J, Tian S T, et al. 2020a. Short-chain per- and polyfluoroalkyl substances in aquatic systems: Occurrence, impacts and treatment. Chemical Engineering Journal, 380: 122506, doi: 10.1016/j.cej.2019.122506.
|
|
|
| [28] |
Li H, Zhu X, Zhang J, et al. 2023. Characterizing the long-term occurrence and anthropogenic drivers of per- and polyfluoroalkyl substances in surface water of the Rhine River. Water Research, 245: 120528, doi: 10.1016/j.watres.2023.120528.
|
|
|
| [29] |
Li J, Gao Y, Xu N, et al. 2020b. Perfluoroalkyl substances in the Yangtze River: Changing exposure and its implications after operation of the Three Gorges Dam. Water Research, 182: 115933, doi: 10.1016/j.watres.2020.115933.
|
|
|
| [30] |
Li J, Li X L, Zhu Y, et al. 2025. The first survey of legacy and emerging per- and polyfluoroalkyl substances (PFAS) in Hulun Lake, China: Occurrence, sources, and environmental impacts. Emerging Contaminants, 11(1): 100431, doi: 10.1016/j.emcon.2024.100431.
|
|
|
| [31] |
Li W Z, Li H Z, Zhang D N, et al. 2022. Legacy and emerging per- and polyfluoroalkyl substances behave distinctly in spatial distribution and multimedia partitioning: A case study in the Pearl River, China. Environmental Science & Technology, 56(6): 3492-3502.
doi: 10.1021/acs.est.1c07362
|
|
|
| [32] |
Lin A Y C, Panchangam S C, Lo C C. 2009. The impact of semiconductor, electronics and optoelectronic industries on downstream perfluorinated chemical contamination in Taiwanese rivers. Environmental Pollution, 157(4): 1365-1372.
doi: 10.1016/j.envpol.2008.11.033
|
|
|
| [33] |
Liu B L, Zhang H, Xie L W, et al. 2015. Spatial distribution and partition of perfluoroalkyl acids (PFAAs) in rivers of the Pearl River Delta, southern China. Science of The Total Environment, 524-525: 1-7.
doi: 10.1016/j.scitotenv.2015.04.004
|
|
|
| [34] |
Liu J J, Zhang Y H, Li F, et al. 2024. Contamination status, partitioning behavior, ecological risks assessment of legacy and emerging per- and polyfluoroalkyl substances in a typical heavily polluted semi-enclosed bay, China. Environmental Research, 247: 118214, doi: 10.1016/j.envres.2024.118214.
|
|
|
| [35] |
Liu W X, Wu J Y, He W, et al. 2019. A review on perfluoroalkyl acids studies: Environmental behaviors, toxic effects, and ecological and health risks. Ecosystem Health and Sustainability, 5(1): 1-19.
doi: 10.1080/20964129.2018.1558031
|
|
|
| [36] |
Lougkovois R, Gkotsis G, Parinos C, et al. 2025. Storm Daniel extreme flood event in Thessaly, Greece: Assessing the pollution status of the impacted coastal marine areas through extended screening of emerging contaminants using LC-TIMS-HRMS. Environmental Science & Technology Letters, 12(4): 432-439.
|
|
|
| [37] |
Lyu X Y, Xiao F, Shen C Y, et al. 2022. Per- and polyfluoroalkyl substances (PFAS) in subsurface environments: Occurrence, fate, transport, and research prospect. Reviews of Geophysics, 60(3): e2021RG000765, doi: 10.1029/2021RG000765.
|
|
|
| [38] |
Maskaoui K, Zhou J L, Hong H S, et al. 2002. Contamination by polycyclic aromatic hydrocarbons in the Jiulong River estuary and Western Xiamen Sea, China. Environmental Pollution, 118(1): 109-122.
pmid: 11996375
|
|
|
| [39] |
Maskaoui K, Zhou J L, Zheng T L, et al. 2005. Organochlorine micropollutants in the Jiulong River Estuary and Western Xiamen Sea, China. Marine Pollution Bulletin, 51(8-12): 950-959.
doi: 10.1016/j.marpolbul.2004.11.018
pmid: 16291197
|
|
|
| [40] |
Massarsky A, Donnell M T, de Gandiaga E, et al. 2022. Critical evaluation of ECOSAR and E-FAST platforms to predict ecological risks of PFAS. Environmental Advances, 8: 100221, doi: 10.1016/j.envadv.2022.100221.
|
|
|
| [41] |
Miralles-Marco A, Harrad S. 2015. Perfluorooctane sulfonate: A review of human exposure, biomonitoring and the environmental forensics utility of its chirality and isomer distribution. Environment International, 77: 148-159.
doi: 10.1016/j.envint.2015.02.002
pmid: 25728452
|
|
|
| [42] |
Munoz G, Budzinski H, Babut M, et al. 2017. Evidence for the trophic transfer of perfluoroalkylated substances in a temperate macrotidal estuary. Environmental Science & Technology, 51(15): 8450-8459.
doi: 10.1021/acs.est.7b02399
|
|
|
| [43] |
Pan C G, Wang Y H, Yu K F, et al. 2020. Occurrence and distribution of perfluoroalkyl substances in surface riverine and coastal sediments from the Beibu Gulf, south China. Marine Pollution Bulletin, 150: 110706, doi: 10.1016/j.marpolbul.2019.110706.
|
|
|
| [44] |
Peralta-Maraver I, Reiss J, Robertson A L. 2018. Interplay of hydrology, community ecology and pollutant attenuation in the hyporheic zone. Science of The Total Environment, 610-611: 267-275.
doi: 10.1016/j.scitotenv.2017.08.036
|
|
|
| [45] |
Perkola N, Sainio P. 2013. Survey of perfluorinated alkyl acids in Finnish effluents, storm water, landfill leachate and sludge. Environmental Science and Pollution Research, 20(11): 7979-7987.
doi: 10.1007/s11356-013-1518-z
|
|
|
| [46] |
Reif D, Zoboli O, Wolfram G, et al. 2022. Pollutant source or sink? Adsorption and mobilization of PFOS and PFOA from sediments in a large shallow lake with extended reed belt. Journal of Environmental Management, 320: 115871, doi: 10.1016/j.jenvman.2022.115871.
|
|
|
| [47] |
Riaz R, Junaid M, Rehman M Y A, et al. 2023. Spatial distribution, compositional profile, sources, ecological and human health risks of legacy and emerging per- and polyfluoroalkyl substances (PFASs) in freshwater reservoirs of Punjab, Pakistan. Science of The Total Environment, 856: 159144, doi: 10.1016/j.scitotenv.2022.159144.
|
|
|
| [48] |
Song J X, Tang B, Zhang J L, et al. 2018. System dynamics simulation for optimal stream flow regulations under consideration of coordinated development of ecology and socio-economy in the Weihe River Basin, China. Ecological Engineering, 124: 51-68.
doi: 10.1016/j.ecoleng.2018.09.024
|
|
|
| [49] |
Tang W Q, Wang T T, Miao J W, et al. 2025. Presence and sources of per- and polyfluoroalkyl substances (PFASs) in the three major rivers on Hainan Island. Environmental Research, 266: 120590, doi: 10.1016/j.envres.2024.120590.
|
|
|
| [50] |
Tao Y R, Pang Y, Luo M K, et al. 2024. Multi-media distribution and risk assessment of per- and polyfluoroalkyl substances in the Huai River Basin, China. Science of The Total Environment, 914: 169581, doi: 10.1016/j.scitotenv.2023.169581.
|
|
|
| [51] |
Thomaidi V S, Tsahouridou A, Matsoukas C, et al. 2020. Risk assessment of PFASs in drinking water using a probabilistic risk quotient methodology. Science of The Total Environment, 712: 136485, doi: 10.1016/j.scitotenv.2019.136485.
|
|
|
| [52] |
UNEP (United Nations Environment Programme). 2009. Listing of Perfluorooctane Sulfonic Acid (PFOS), its Salts and Perfluorooctane Sulfonyl Fluoride (PFOSF) in Annex B of the Stockholm Convention on Persistent Organic Pollutants. Geneva: UNEP.
|
|
|
| [53] |
UNEP (United Nations Environment Programme). 2019. Listing of Perfluorooctanoic Acid (PFOA), its Salts and PFOA-Related Compounds in Annex A to the Stockholm Convention on Persistent Organic Pollutants with Specific Exemptions. Geneva: UNEP.
|
|
|
| [54] |
Wang S W, Huang J, Yang Y, et al. 2013. First report of a Chinese PFOS alternative overlooked for 30 years: Its toxicity, persistence, and presence in the environment. Environmental Science & Technology, 47(18): 10163-10170.
doi: 10.1021/es401525n
|
|
|
| [55] |
Wang T Y, Khim J S, Chen C L, et al. 2012. Perfluorinated compounds in surface waters from Northern China: Comparison to level of industrialization. Environment International, 42: 37-46.
doi: 10.1016/j.envint.2011.03.023
pmid: 21536332
|
|
|
| [56] |
Xiao F. 2017. Emerging poly- and perfluoroalkyl substances in the aquatic environment: A review of current literature. Water Research, 124: 482-495.
doi: S0043-1354(17)30597-3
pmid: 28800519
|
|
|
| [57] |
Yamazaki E, Lalwani D, Thaker P, et al. 2025. Historical reconstruction of PFAS discharge into the Cooum River-before and after the great Chennai flood in 2015. Chemosphere, 371: 144068, doi: 10.1016/j.chemosphere.2025.144068.
|
|
|
| [58] |
Yu L, Liu X D, Hua Z L, et al. 2024. Intense turbulent bursts promote the release of perfluoroalkyl acids from sediments at high flow velocity. Environmental Science & Technology, 58(26): 11737-11747.
doi: 10.1021/acs.est.4c03885
|
|
|
| [59] |
Zhang S Y, Zhang L L, Zhang Q M, et al. 2025. Pollution characteristics and ecological risks of perfluoroalkyl substances at key discharge points in the Wei River Basin. Environmental Science: Water Research & Technology, 11(12): 3061-3073.
|
|
|
| [60] |
Zhou L F, Chen W J, Zhang Y, et al. 2023. Pollution characteristics and risk assessment of per- and polyfluoroalkyl substances in waters of Meiliang Bay, Taihu Lake. Environmental Chemistry, 42(10): 3408-3419. (in Chinese)
|
|
|
| [61] |
Zhou J, Li Z, Guo X T, et al. 2019. Evidences for replacing legacy per- and polyfluoroalkyl substances with emerging ones in Fen and Wei River basins in central and western China. Journal of Hazardous Materials, 377: 78-87.
doi: S0304-3894(19)30584-9
pmid: 31151043
|
|
|
| [62] |
Zushi Y, Masunaga S. 2009. First-flush loads of perfluorinated compounds in stormwater runoff from Hayabuchi River basin, Japan served by separated sewerage system. Chemosphere, 76(6): 833-840.
|
|
|
| [63] |
Zushi Y, Ye F, Motegi M, et al. 2012. Spatial distribution and loading amounts of particle sorbed and dissolved perfluorinated compounds in the basin of Tokyo Bay. Chemosphere, 88(11): 1353-1357.
doi: 10.1016/j.chemosphere.2012.05.038
pmid: 22698375
|
|
|
|
Viewed |
|
|
|
Full text
|
|
|
|
|
Abstract
|
|
|
|
|
Cited |
|
|
|
|
| |
Shared |
|
|
|
|
| |
Discussed |
|
|
|
|