Please wait a minute...
Journal of Arid Land  2023, Vol. 15 Issue (3): 253-273    DOI: 10.1007/s40333-023-0052-1
Research article     
Driving forces behind the spatiotemporal heterogeneity of land-use and land-cover change: A case study of the Weihe River Basin, China
WU Jingyan, LUO Jungang(), ZHANG Han, YU Mengjie
State Key Laboratory of Eco-hydraulics in Northwest Arid Region, Xi'an University of Technology, Xi'an 710048, China
Download: HTML     PDF(9149KB)
Export: BibTeX | EndNote (RIS)      

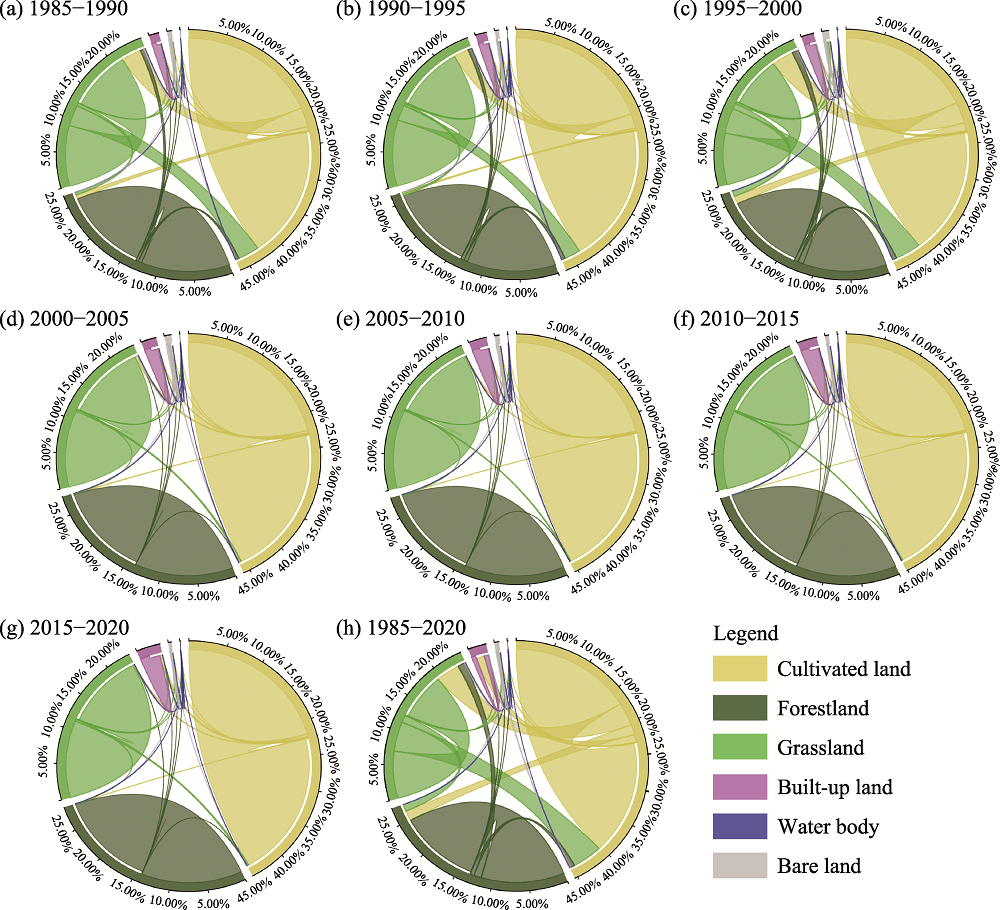
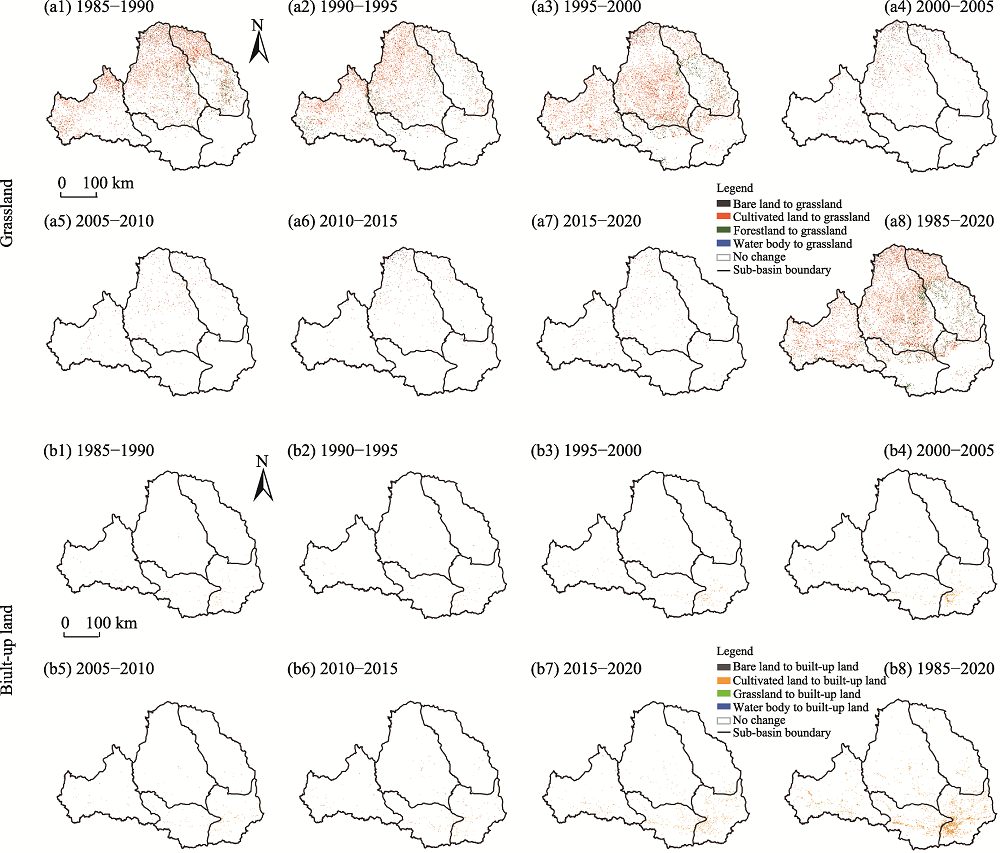
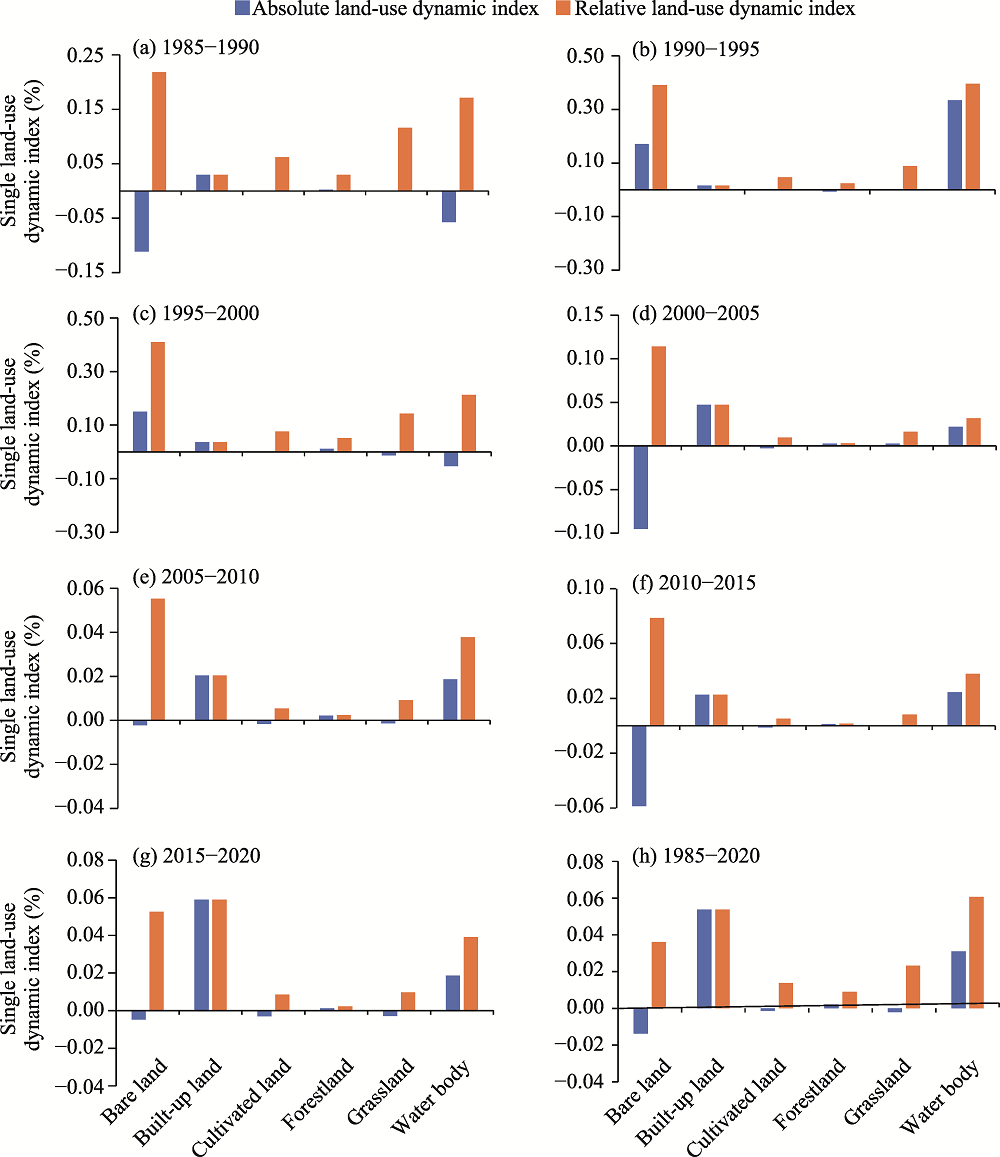
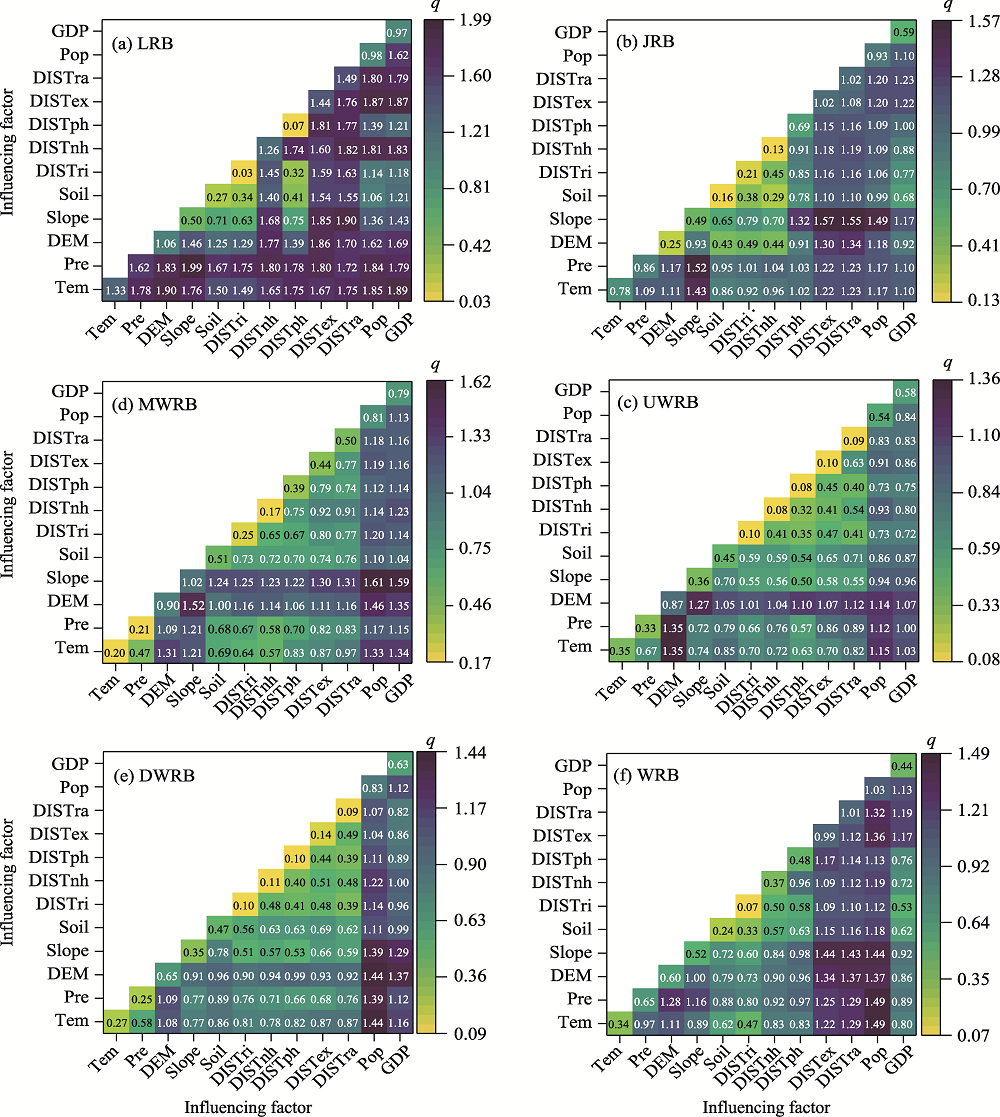
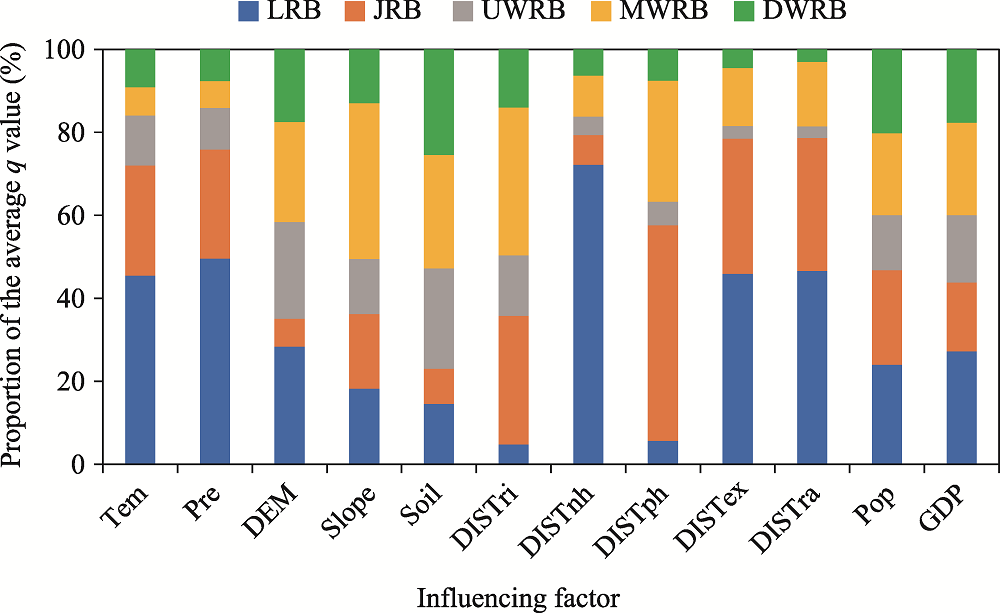
Abstract  

The impact of socioeconomic development on land-use and land-cover change (LUCC) in river basins varies spatially and temporally. Exploring the spatiotemporal evolutionary trends and drivers of LUCC under regional disparities is the basis for the sustainable development and management of basins. In this study, the Weihe River Basin (WRB) in China was selected as a typical basin, and the WRB was divided into the upstream of the Weihe River Basin (UWRB), the midstream of the Weihe River Basin (MWRB), the downstream of the Weihe River Basin (DWRB), the Jinghe River Basin (JRB), and the Luohe River Basin (LRB). Based on land-use data (cultivated land, forestland, grassland, built-up land, bare land, and water body) from 1985 to 2020, we analyzed the spatiotemporal heterogeneity of LUCC in the WRB using a land-use transfer matrix and a dynamic change model. The driving forces of LUCC in the WRB in different periods were detected using the GeoDetector, and the selected influencing factors included meteorological factors (precipitation and temperature), natural factors (elevation, slope, soil, and distance to rivers), social factors (distance to national highway, distance to railway, distance to provincial highway, and distance to expressway), and human activity factors (population density and gross domestic product (GDP)). The results indicated that the types and intensities of LUCC conversions showed considerable disparities across different sub-basins, where complex conversions among cultivated land, forestland, and grassland occurred in the LRB, JRB, and UWRB, with higher dynamic change before 2000. The conversion of other land-use types to built-up land was concentrated in the UWRB, MWRB, and DWRB, with substantial increases after 2000. Additionally, the driving effects of the influencing factors on LUCC in each sub-basin also exhibited distinct diversity, with the LRB and JRB being influenced by the meteorological and social factors, and the UWRB, MWRB, and DWRB being driven by human activity factors. Moreover, the interaction of these influencing factors indicated an enhanced effect on LUCC. This study confirmed the spatiotemporal heterogeneity effects of socioeconomic status on LUCC in the WRB under regional differences, contributing to the sustainable development of the whole basin by managing sub-basins according to local conditions.


Key wordsland-use and land-cover change (LUCC)      spatial heterogeneity      land-use conversion      dynamic change model      GeoDetector      human activities      Weihe River Basin     
Received: 27 May 2022      Published: 31 March 2023
Corresponding Authors: * LUO Jungang (E-mail: jgluo@xaut.edu.cn)
Cite this article:

WU Jingyan, LUO Jungang, ZHANG Han, YU Mengjie. Driving forces behind the spatiotemporal heterogeneity of land-use and land-cover change: A case study of the Weihe River Basin, China. Journal of Arid Land, 2023, 15(3): 253-273.

URL:

http://jal.xjegi.com/10.1007/s40333-023-0052-1     OR     http://jal.xjegi.com/Y2023/V15/I3/253

Fig. 1 Geographical location of the Weihe River Basin (WRB) in the Yellow River Basin (a) and overview of the WRB and its sub-basins (b). UWRB, the upstream of the Weihe River Basin; MWRB, the midstream of the Weihe River Basin; DWRB, the downstream of the Weihe River Basin; JRB, Jinghe River Basin; LRB, Luohe River Basin.
Category Parameter Type Scale/resolution Period Data source
Land use LUCC Raster 30 m×30 m 1985-2020 (interval of 5 a) Big Earth Data Science Engineering Program (https://data.casearth.cn)
Meteorological factors Precipitation Numeric Annual 1980-2019 National Meteorological Science Data Center (https://data.cma.cn)
Temperature Numeric Annual 1980-2019
Natural
factors
Elevation (DEM) Raster 30 m×30 m 2009 Geospatial Data Cloud (http://www.gscloud.cn)
Slope Raster 30 m×30 m 2009
Soil Raster 1000 m×1000 m 2010 Resource and Environment Science and Data Center (https://www.resdc.cn)
Distance to rivers Vector 1:250,000 2015
Social
factors
Distance to national highway Vector 1:250,000 2015 National Cryosphere Desert Data Center (http://www.ncdc.ac.cn)
Distance to railway Vector 1:250,000 2015
Distance to provincial highway Vector 1:250,000 2015
Distance to expressway Vector 1:250,000 2015
Human activity factors Population density Raster 1000 m×1000 m 1985-2015 (interval of 5 a) Resource and Environment Science and Data Center (https://www.resdc.cn)
Gross domestic product (GDP) Raster 1000 m×1000 m 1985-2015 (interval of 5 a)
Table 1 Details of the datasets of land-use and land-cover change (LUCC) and its influencing factors
Condition Interaction
q(x1x2)<Min(q(x1), q(x2)) Weaken, nonlinear
Min(q(x1), q(x2))<q(x1x2)<Max(q(x1), q(x2)) Weaken
q(x1x2)>Max(q(x1), q(x2)) Enhance
q(x1x2)=q(x1)+q(x2) Independent
q(x1x2)>q(x1)+q(x2) Enhance, nonlinear
Table 2 Description about the types of interaction detection
Fig. 2 Spatial distribution and area proportions of land-use types in the WRB in 1985 (a), 1990 (b), 1995 (c), 2000 (d), 2005 (e), 2010 (f), 2015 (g), and 2020 (h)
Fig. 3 Area proportions of cultivated land (a), forestland (b), grassland (c), built-up land (d), bare land (e), and water body (f) in different sub-basins in the WRB from 1985 to 2020 at an interval of 5 a
Fig. 4 Structure chart of the transfers of different land-use types in the WRB in 1985-1990 (a), 1990-1995 (b), 1995-2000 (c), 2000-2005 (d), 2005-2010 (e), 2010-2015 (f), 2015-2020 (g), and 1985-2020 (h)
Period Bare land Built-up land Cultivated land Forestland Grassland Water body Total
1985-1990 Bare land 195.75 0.26 217.75 0.01 697.08 0.00 1110.85
Built-up land 0.00 1662.52 0.00 0.00 0.00 0.00 1662.52
Cultivated land 123.60 239.19 52,719.58 1658.10 7723.83 12.26 62,476.57
Forestland 0.05 0.72 1057.96 33,275.83 1366.82 8.49 35,709.87
Grassland 174.28 7.21 8313.03 1208.17 23,868.92 0.21 33,571.82
Water body 0.00 0.05 40.90 0.99 0.07 31.52 73.52
Total 493.67 1909.94 62,349.22 36,143.11 33,656.72 52.48 134,605.14
Period Bare land Built-up land Cultivated land Forestland Grassland Water body Total
1990-1995 Bare land 222.72 0.22 80.13 0.00 190.44 0.16 493.67
Built-up land 0.00 1909.94 0.00 0.00 0.00 0.00 1909.94
Cultivated land 130.40 141.41 55,346.24 780.44 5858.73 91.99 62,349.22
Forestland 0.00 0.03 1362.27 33,410.33 1367.65 2.83 36,143.11
Grassland 561.60 10.52 6211.72 808.50 26,063.58 0.80 33,656.72
Water body 0.00 0.07 6.14 0.73 1.15 44.40 52.48
Total 914.72 2062.18 63,006.50 35,000.01 33,481.56 140.17 134,605.14
Period Bare land Built-up land Cultivated land Forestland Grassland Water body Total
1995-2000 Bare land 321.44 0.65 217.20 3.69 371.01 0.74 914.72
Built-up land 0.00 2062.18 0.00 0.00 0.00 0.00 2062.18
Cultivated land 429.78 356.81 50,557.45 3187.17 8430.70 44.59 63,006.50
Forestland 1.84 0.16 1448.02 31,426.82 2121.59 1.58 35,000.01
Grassland 843.62 18.22 9856.08 2349.17 20,405.21 9.27 33,481.56
Water body 4.38 0.80 76.55 3.09 8.42 46.93 140.17
Total 1601.06 2438.83 62,155.29 36,969.94 31,336.93 103.11 134,605.14
Period Bare land Built-up land Cultivated land Forestland Grassland Water body Total
2000-2005 Bare land 764.48 3.56 330.92 6.68 495.06 0.36 1601.06
Built-up land 0.00 2438.83 0.00 0.00 0.00 0.00 2438.83
Cultivated land 40.82 543.03 60,262.11 305.95 991.16 12.23 62,155.29
Forestland 0.02 2.97 28.63 36,920.91 17.18 0.23 36,969.94
Grassland 35.69 27.33 780.64 214.70 30,277.49 1.07 31,336.93
Water body 0.10 0.03 2.00 0.16 0.25 100.57 103.11
Total 841.11 3015.74 61,404.30 37,448.40 31,781.14 114.46 134,605.14
Period Bare land Built-up land Cultivated land Forestland Grassland Water body Total
2005-2010 Bare land 720.35 3.50 56.27 1.02 59.91 0.07 841.11
Built-up land 0.00 3015.74 0.00 0.00 0.00 0.00 3015.74
Cultivated land 31.09 284.17 60,336.69 195.52 542.35 14.47 61,404.30
Forestland 0.03 1.05 15.18 37,424.47 7.10 0.58 37,448.40
Grassland 80.09 19.26 511.56 218.02 30,951.17 1.03 31,781.14
Water body 0.24 0.05 4.49 0.19 0.50 108.99 114.46
Total 831.80 3323.76 60,924.19 37,839.24 31,561.02 125.14 134,605.14
Period Bare land Built-up land Cultivated land Forestland Grassland Water body Total
2010-2015 Bare land 546.55 3.90 116.26 0.54 164.41 0.13 831.80
Built-up land 0.00 3323.76 0.00 0.00 0.00 0.00 3323.76
Cultivated land 20.10 353.17 59,947.23 119.64 466.57 17.47 60,924.19
Forestland 0.13 1.32 23.55 37,802.43 11.45 0.37 37,839.24
Grassland 21.10 19.96 473.44 146.40 30,898.60 1.52 31,561.02
Water body 0.28 0.02 3.28 0.21 0.35 120.99 125.14
Total 588.16 3702.14 60,563.76 38,069.22 31,541.38 140.48 134,605.14
Period Bare land Built-up land Cultivated land Forestland Grassland Water body Total
2015-2020 Bare land 503.83 7.02 45.48 0.26 31.46 0.10 588.16
Built-up land 0.00 3702.14 0.00 0.00 0.00 0.00 3702.14
Cultivated land 26.07 1025.93 58,830.17 177.73 487.87 15.99 60,563.76
Forestland 0.26 8.12 58.83 37,973.94 26.73 1.35 38,069.22
Grassland 42.12 51.44 735.70 151.70 30,557.59 2.84 31,541.38
Water body 1.69 1.59 3.34 0.17 0.37 133.32 140.48
Total 573.97 4796.25 59,673.51 38,303.79 31,104.03 153.60 134,605.14
Period Bare land Built-up land Cultivated land Forestland Grassland Water body Total
1985-2020 Bare land 141.64 2.45 477.52 9.95 467.65 11.63 1110.85
Built-up land 0.00 1662.52 0.00 0.00 0.00 0.00 1662.52
Cultivated land 177.51 3014.65 45,972.82 4013.84 9212.04 85.70 62,476.57
Forestland 2.09 21.35 1546.09 31,390.12 2739.03 11.19 35,709.87
Grassland 249.99 89.12 11,650.04 2889.12 18,684.02 9.54 33,571.82
Water body 2.73 6.16 27.04 0.75 1.28 35.55 73.52
Total 573.97 4796.25 59,673.51 38,303.79 31,104.03 153.60 134,605.14
Table S1 Transfer matrix of land-use and land-cover change (LUCC) in different periods (unit: km2)
Fig. 5 Spatial distribution of other land-use types converted to cultivated land (a1-a8) and forestland (b1-b8) in the WRB in 1985-1990 (a1 and b1), 1990-1995 (a2 and b2), 1995-2000 (a3 and b3), 2000-20005 (a4 and b4), 2005-2010 (a5 and b5), 2010-2015 (a6 and b6), 2015-2020 (a7 and b7), and 1985-2020 (a8 and b8)
Fig. 6 Spatial distribution of other land-use types converted to grassland (a1-a8) and built-up land (b1-b8) in the WRB in 1985-1990 (a1 and b1), 1990-1995 (a2 and b2), 1995-2000 (a3 and b3), 2000-20005 (a4 and b4), 2005-2010 (a5 and b5), 2010-2015 (a6 and b6), 2015-2020 (a7 and b7), and 1985-2020 (a8 and b8)
Fig. 7 Single land-use dynamic index (including relative land-use dynamic index and absolute land-use dynamic index) values of land-use types in the WRB in 1985-1990 (a), 1990-1995 (b), 1995-2000 (c), 2000-2005 (d), 2005-2010 (e), 2010-2015 (f), 2015-2020 (g), and 1985-2020 (h). Note that values of relative or absolute land-use dynamic index less than zero represent decrease in the area of land-use type, and values of relative or absolute land-use dynamic index greater than zero represent increase in the area of land-use type.
1985-1990 1990-1995 1995-2000 2000-2005 2005-2010 2010-2015 2015-2020
Comprehensive land-use dynamic index (%) 0.20 0.40 0.90 0.40 0.20 0.18 0.39
Table 3 Comprehensive land-use dynamic index in the Weihe River Basin (WRB) in 1985-2020 at an inverval of 5 a
Fig. 8 Variations of q values for different influencing factors of LUCC in the WRB and its sub-basins from 1985 to 2020. (a), LRB; (b), JRB; (c), UWRB; (d), MWRB; (e), DWRB; (f), WRB. q, the value of driving forces of the influencing factor; Tem, temperature; Pre, precipitation; DEM, elevation; DISTri, distance to rivers; DISTnh, distance to national highway; DISTph, distance to provincial highway; DISTex, distance to expressway; DISTra, distance to railway; Pop, population density; GDP, gross domestic product.
Fig. 9 Average q value of each influencing factor of LUCC in the WRB and its sub-basins. (a), LRB; (b), JRB; (c), UWRB; (d), MWRB; (e), DWRB; (f), WRB. q, the value of driving forces of the influencing factor; Tem, temperature; Pre, precipitation; DEM, elevation; DISTri, distance to rivers; DISTnh, distance to national highway; DISTph, distance to provincial highway; DISTex, distance to expressway; DISTra, distance to railway; Pop, population density; GDP, gross domestic product.
Fig. 10 Heat map of the 5-a average interaction of influencing factors of LUCC in the WRB and its sub-basins from 1985 to 2020. (a), LRB; (b), JRB; (c), UWRB; (d), MWRB; (e), DWRB; (f), WRB. Tem, temperature; Pre, precipitation; DEM, elevation; DISTri, distance to rivers; DISTnh, distance to national highway; DISTph, distance to provincial highway; DISTex, distance to expressway; DISTra, distance to railway; Pop, population density; GDP, gross domestic product.
Fig. 11 Proportion of the average q value of each influencing factor of LUCC in each sub-basin of the WRB. q, the value of driving forces of the influencing factor; Tem, temperature; Pre, precipitation; DEM, elevation; DISTri, distance to rivers; DISTnh, distance to national highway; DISTph, distance to provincial highway; DISTex, distance to expressway; DISTra, distance to railway; Pop, population density; GDP, gross domestic product.
[1]   Bai L M, Xiu C L, Feng X H, et al. 2019. Influence of urbanization on regional habitat quality: a case study of Changchun City. Habitat International, 93: 102042, doi: 10.1016/j.habitatint.2019.102042.
doi: 10.1016/j.habitatint.2019.102042
[2]   Batunacun, Nendel C, Hu Y F, et al. 2018. Land-use change and land degradation on the Mongolian Plateau from 1975 to 2015—A case study from Xilingol, China. Land Degradation & Development, 29(6): 1595-1606.
doi: 10.1002/ldr.v29.6
[3]   Chen M X, Li Y, Gong Y H, et al. 2016. The population distribution and trend of urbanization pattern on two sides of Hu Huanyong population line: A tentative response to Premier Li Keqiang. Acta Geographica Sinica, 71(2): 179-193. (in Chinese)
doi: 10.11821/dlxb201602001
[4]   Du J, Shi C X. 2012. Effects of climatic factors and human activities on runoff of the Weihe River in recent decades. Quaternary International, 282: 58-65.
doi: 10.1016/j.quaint.2012.06.036
[5]   Guo B, Wang Y, Pei L, et al. 2021. Determining the effects of socioeconomic and environmental determinants on chronic obstructive pulmonary disease (COPD) mortality using geographically and temporally weighted regression model across Xi'an during 2014-2016. Science of The Total Environment, 756: 143869, doi: 10.1016/j.scitotenv.2020.143869.
doi: 10.1016/j.scitotenv.2020.143869
[6]   Hasselmann F, Csaplovics E, Falconer I, et al. 2010. Technological driving forces of LUCC: Conceptualization, quantification, and the example of urban power distribution networks. Land Use Policy, 27(2): 628-637.
doi: 10.1016/j.landusepol.2009.08.016
[7]   Huang X X, Wang H J, Xiao F T. 2022. Simulating urban growth affected by national and regional land use policies: Case study from Wuhan, China. Land Use Policy, 112: 105850, doi: 10.1016/j.landusepol.2021.105850.
doi: 10.1016/j.landusepol.2021.105850
[8]   Jian S Q, Zhao C Y, Fang S M, et al. 2015. Effects of different vegetation restoration on soil water storage and water balance in the Chinese Loess Plateau. Agricultural and Forest Meteorology, 206: 85-96.
doi: 10.1016/j.agrformet.2015.03.009
[9]   Jiang L, Yu J, Wen J H, et al. 2021. Risk assessment of extreme flood in the north bank of the Hangzhou Bay under land use change scenarios. Progress in Geography, 40(8): 1355-1370. (in Chinese)
doi: 10.18306/dlkxjz.2021.08.009
[10]   Kindu M, Angelova D, Schneider T, et al. 2020. Monitoring of urban growth patterns in rapidly growing Bahir Dar City of northwest Ethiopia with 30 year Landsat imagery record. ISPRS International Journal of Geo-Information, 9(9): 548, doi: 10.3390/ijgi9090548.
doi: 10.3390/ijgi9090548
[11]   Kong X S, Fu M X, Zhao X, et al. 2022. Ecological effects of land-use change on two sides of the Hu Huanyong Line in China. Land Use Policy, 113: 105895, doi: 10.1016/j.landusepol.2021.105895.
doi: 10.1016/j.landusepol.2021.105895
[12]   Ma Y L, Xu R S. 2010. Remote sensing monitoring and driving force analysis of urban expansion in Guangzhou City, China. Habitat International, 34(2): 228-235.
doi: 10.1016/j.habitatint.2009.09.007
[13]   Nhi P T T, Khoi D N, Trang N T T, et al. 2022. Hydrological impacts of future climate and land use/cover changes in the Lower Mekong Basin: a case study of the Srepok River Basin, Vietnam. Environmental Monitoring and Assessment, 194(Suppl 2): 768, doi: 10.1007/s10661-022-10175-9.
doi: 10.1007/s10661-022-10175-9
[14]   Nie T, Dong G T, Jiang X H, et al. 2021. Spatio-temporal changes and driving forces of vegetation coverage on the Loess Plateau of northern Shaanxi. Remote Sensing, 13(4): 613, doi: 10.3390/rs13040613.
doi: 10.3390/rs13040613
[15]   Ning J, Liu J Y, Kuang W H, et al. 2018. Spatiotemporal patterns and characteristics of land-use change in China during 2010-2015. Journal of Geographical Sciences, 28(5): 547-562.
doi: 10.1007/s11442-018-1490-0
[16]   Omer A, Ma Z G, Yuan X, et al. 2021. A hydrological perspective on drought risk-assessment in the Yellow River Basin under future anthropogenic activities. Journal of Environmental Management, 289: 112429, doi: 10.1016/j.jenvman.2021.112429.
doi: 10.1016/j.jenvman.2021.112429
[17]   Shaharum N S N, Shafri H Z M, Gambo J, et al. 2018. Mapping of Krau Wildlife Reserve (KWR) protected area using Landsat 8 and supervised classification algorithms. Remote Sensing Applications: Society and Environment, 10: 24-35.
doi: 10.1016/j.rsase.2018.01.002
[18]   Song F, Su F L, Mi C X, et al. 2021. Analysis of driving forces on wetland ecosystem services value change: A case in Northeast China. Science of The Total Environment, 751: 141778, doi: 10.1016/j.scitotenv.2020.141778.
doi: 10.1016/j.scitotenv.2020.141778
[19]   Song Y Z, Wang J F, Ge Y, et al. 2020. An optimal parameters-based geographical detector model enhances geographic characteristics of explanatory variables for spatial heterogeneity analysis: cases with different types of spatial data. GIScience & Remote Sensing, 57(5): 593-610.
[20]   Sun X, Lu Z M, Li F, et al. 2018. Analyzing spatio-temporal changes and trade-offs to support the supply of multiple ecosystem services in Beijing, China. Ecological Indicators, 94: 117-129.
doi: 10.1016/j.ecolind.2018.06.049
[21]   Wang H Y, Qin F, Xu C D, et al. 2021. Evaluating the suitability of urban development land with a Geodetector. Ecological Indicators, 123: 107339, doi: 10.1016/j.ecolind.2021.107339.
doi: 10.1016/j.ecolind.2021.107339
[22]   Wang J F, Li X H, Christakos G, et al. 2010. Geographical detectors-based health risk assessment and its application in the neural tube defects study of the Heshun Region, China. International Journal of Geographical Information Science, 24(1): 107-127.
doi: 10.1080/13658810802443457
[23]   Wang J T, Peng J, Zhao M Y, et al. 2017. Significant trade-off for the impact of Grain-for-Green Programme on ecosystem services in North-western Yunnan, China. Science of The Total Environment, 574: 57-64.
doi: 10.1016/j.scitotenv.2016.09.026
[24]   Wei H, Xiong L Y, Tang G A, et al. 2021. Spatial-temporal variation of land use and land cover change in the glacial affected area of the Tianshan Mountains. CATENA, 202: 105256, doi: 10.1016/j.catena.2021.105256.
doi: 10.1016/j.catena.2021.105256
[25]   Wei X D, Lin L G, Luo P P, et al. 2022. Spatiotemporal pattern and driving force analysis of multi-functional coupling coordinated development of cultivated land. Transactions of the Chinese Society of Agricultural Engineering, 38(4): 260-269. (in Chinese)
[26]   Wu J Y, Luo J G, Zhang H, et al. 2022a. Projections of land use change and habitat quality assessment by coupling climate change and development patterns. Science of The Total Environment, 847: 157491, doi: 10.1016/j.scitotenv.2022.157491.
doi: 10.1016/j.scitotenv.2022.157491
[27]   Wu J Y, Luo J G, Du X Z, et al. 2022b. Optimizing water allocation in an inter-basin water diversion project with equity-efficiency tradeoff: A bi-level multiobjective programming model under uncertainty. Journal of Cleaner Production, 371: 133606, doi: 10.1016/j.jclepro.2022.133606.
doi: 10.1016/j.jclepro.2022.133606
[28]   Wu R, Li Z G, Wang S J, 2021. The varying driving forces of urban land expansion in China: Insights from a spatial-temporal analysis. Science of The Total Environment, 766: 142591, doi: 10.1016/j.scitotenv.2020.142591.
doi: 10.1016/j.scitotenv.2020.142591
[29]   Wulder M A, White J C, Goward S N, et al. 2008. Landsat continuity: Issues and opportunities for land cover monitoring. Remote Sensing of Environment, 112(3): 955-969.
doi: 10.1016/j.rse.2007.07.004
[30]   Xu C, Jiang Y N, Su Z H, et al. 2022. Assessing the impacts of Grain-for-Green Programme on ecosystem services in Jinghe River basin, China. Ecological Indicators, 137: 108757, doi: 10.1016/j.ecolind.2022.108757.
doi: 10.1016/j.ecolind.2022.108757
[31]   Yang C, Wei T X, Li Y R, 2022. Simulation and spatio-temporal variation characteristics of LULC in the context of urbanization construction and ecological restoration in the Yellow River Basin. Sustainability, 14(2): 789, doi: 10.3390/su14020789.
doi: 10.3390/su14020789
[32]   Yang Y Y. 2021. Evolution of habitat quality and association with land-use changes in mountainous areas: A case study of the Taihang Mountains in Hebei Province, China. Ecological Indicators, 129: 107967, doi: 10.1016/j.ecolind.2021.107967.
doi: 10.1016/j.ecolind.2021.107967
[33]   Yuan Z F, Zhou L, Sun D Q, et al. 2022. Impacts of urban expansion on the loss and fragmentation of cropland in the major grain production areas of China. Land, 11(1): 130, doi: 10.3390/land11010130.
doi: 10.3390/land11010130
[34]   Zhan Q Q, Zhao W, Yang M J, et al. 2021. A long-term record (1995-2019) of the dynamics of land desertification in the middle reaches of Yarlung Zangbo River basin derived from Landsat data. Geography and Sustainability, 2(1): 12-21.
doi: 10.1016/j.geosus.2021.01.002
[35]   Zhang X, Liu L Y, Chen X D, et al. 2021. GLC_FCS30: Global land-cover product with fine classification system at 30 m using time-series Landsat imagery. Earth System Science Data, 13(6): 2753-2776.
doi: 10.5194/essd-13-2753-2021
[36]   Zhou J, Fu B J, Gao G Y, et al. 2016. Effects of precipitation and restoration vegetation on soil erosion in a semi-arid environment in the Loess Plateau, China. CATENA, 137: 1-11.
doi: 10.1016/j.catena.2015.08.015
[37]   Zhou L, Dang X W, Sun Q K, et al. 2020. Multi-scenario simulation of urban land change in Shanghai by random forest and CA-Markov model. Sustainable Cities and Society, 55: 102045, doi: 10.1016/j.scs.2020.102045.
doi: 10.1016/j.scs.2020.102045
[1] LIN Yanmin, HU Zhirui, LI Wenhui, CHEN Haonan, WANG Fang, NAN Xiongxiong, YANG Xuelong, ZHANG Wenjun. Response of ecosystem carbon storage to land use change from 1985 to 2050 in the Ningxia Section of Yellow River Basin, China[J]. Journal of Arid Land, 2024, 16(1): 110-130.
[2] WANG Yinping, JIANG Rengui, YANG Mingxiang, XIE Jiancang, ZHAO Yong, LI Fawen, LU Xixi. Spatiotemporal characteristics and driving mechanisms of land use/land cover (LULC) changes in the Jinghe River Basin, China[J]. Journal of Arid Land, 2024, 16(1): 91-109.
[3] QIN Guoqiang, WU Bin, DONG Xinguang, DU Mingliang, WANG Bo. Evolution of groundwater recharge-discharge balance in the Turpan Basin of China during 1959-2021[J]. Journal of Arid Land, 2023, 15(9): 1037-1051.
[4] YUAN Shuai, LIU Yongqiang, QIN Yan, ZHANG Kun. Spatiotemporal variation of surface albedo and its influencing factors in northern Xinjiang, China[J]. Journal of Arid Land, 2023, 15(11): 1315-1339.
[5] LIU Yifeng, GUO Bing, LU Miao, ZANG Wenqian, YU Tao, CHEN Donghua. Quantitative distinction of the relative actions of climate change and human activities on vegetation evolution in the Yellow River Basin of China during 1981-2019[J]. Journal of Arid Land, 2023, 15(1): 91-108.
[6] DONG Jianhong, ZHANG Zhibin, LIU Benteng, ZHANG Xinhong, ZHANG Wenbin, CHEN Long. Spatiotemporal variations and driving factors of habitat quality in the loess hilly area of the Yellow River Basin: A case study of Lanzhou City, China[J]. Journal of Arid Land, 2022, 14(6): 637-652.
[7] WU Changxue, QIU Dexun, GAO Peng, MU Xingmin, ZHAO Guangju. Application of the InVEST model for assessing water yield and its response to precipitation and land use in the Weihe River Basin, China[J]. Journal of Arid Land, 2022, 14(4): 426-440.
[8] ZHANG Zhen, GU Zhengnan, Hu Kehong, XU Yangyang, ZHAO Jinbiao. Spatial variability between glacier mass balance and environmental factors in the High Mountain Asia[J]. Journal of Arid Land, 2022, 14(4): 441-454.
[9] LI Feng, LI Yaoming, ZHOU Xuewen, YIN Zun, LIU Tie, XIN Qinchuan. Modeling and analyzing supply-demand relationships of water resources in Xinjiang from a perspective of ecosystem services[J]. Journal of Arid Land, 2022, 14(2): 115-138.
[10] HE Bing, CHANG Jianxia, GUO Aijun, WANG Yimin, WANG Yan, LI Zhehao. Assessment of river basin habitat quality and its relationship with disturbance factors: A case study of the Tarim River Basin in Northwest China[J]. Journal of Arid Land, 2022, 14(2): 167-185.
[11] WU Changxue, Xu Ruirui, QIU Dexun, DING Yingying, GAO Peng, MU Xingmin, ZHAO Guangju. Runoff characteristics and its sensitivity to climate factors in the Weihe River Basin from 2006 to 2018[J]. Journal of Arid Land, 2022, 14(12): 1344-1360.
[12] YU Xiang, LEI Jiaqiang, GAO Xin. An over review of desertification in Xinjiang, Northwest China[J]. Journal of Arid Land, 2022, 14(11): 1181-1195.
[13] WU Shupu, GAO Xin, LEI Jiaqiang, ZHOU Na, GUO Zengkun, SHANG Baijun. Ecological environment quality evaluation of the Sahel region in Africa based on remote sensing ecological index[J]. Journal of Arid Land, 2022, 14(1): 14-33.
[14] YU Yang, CHEN Xi, Ireneusz MALIK, Malgorzata WISTUBA, CAO Yiguo, HOU Dongde, TA Zhijie, HE Jing, ZHANG Lingyun, YU Ruide, ZHANG Haiyan, SUN Lingxiao. Spatiotemporal changes in water, land use, and ecosystem services in Central Asia considering climate changes and human activities[J]. Journal of Arid Land, 2021, 13(9): 881-890.
[15] BAI Jie, LI Junli, BAO Anmin, CHANG Cun. Spatial-temporal variations of ecological vulnerability in the Tarim River Basin, Northwest China[J]. Journal of Arid Land, 2021, 13(8): 814-834.