| Research article |
|


|
|
|
| Runoff characteristics and its sensitivity to climate factors in the Weihe River Basin from 2006 to 2018 |
WU Changxue1, Xu Ruirui2,3, QIU Dexun2,3, DING Yingying1, GAO Peng1,2,3,*( ), MU Xingmin1,2,3,*(), ZHAO Guangju1,2,3 ), MU Xingmin1,2,3,*(), ZHAO Guangju1,2,3 |
1State Key Laboratory of Soil Erosion and Dryland Farming on the Loess Plateau, Institute of Soil and Water Conservation, Northwest A&F University, Yangling 712100, China
2State Key Laboratory of Soil Erosion and Dryland Farming on the Loess Plateau, Institute of Soil and Water Conservation, Chinese Academy of Sciences and Ministry of Water Resources, Yangling 712100, China
3University of Chinese Academy of Sciences, Beijing 100000, China |
|
|
|
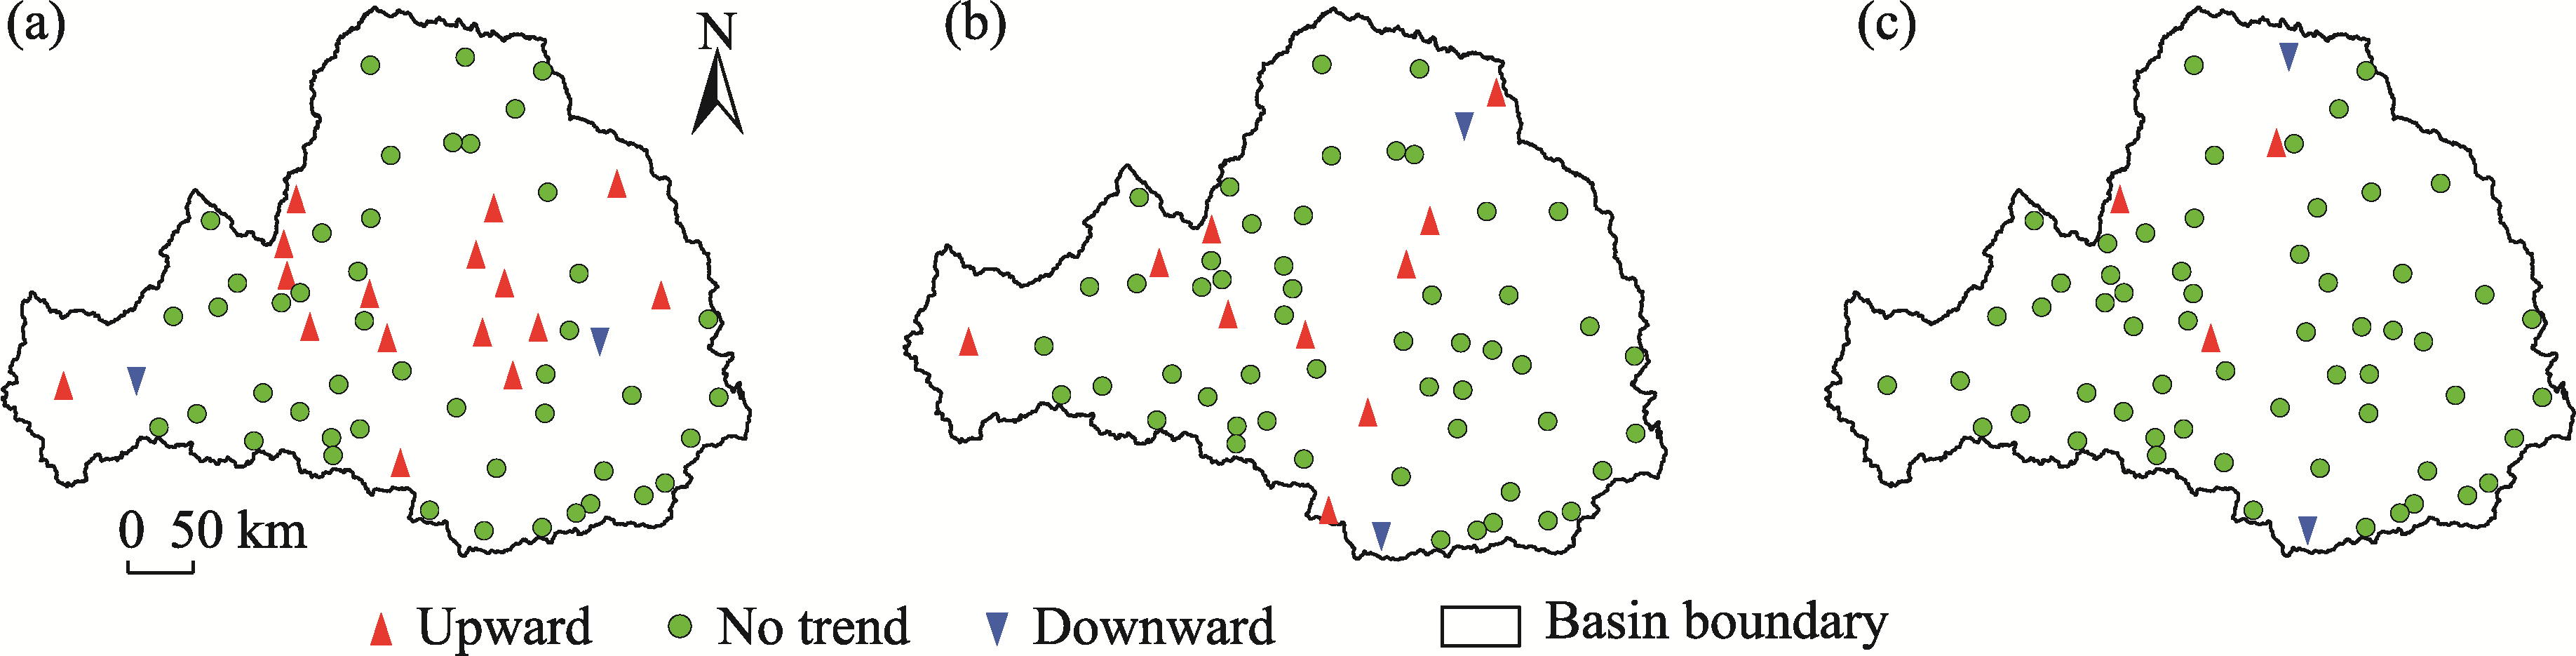
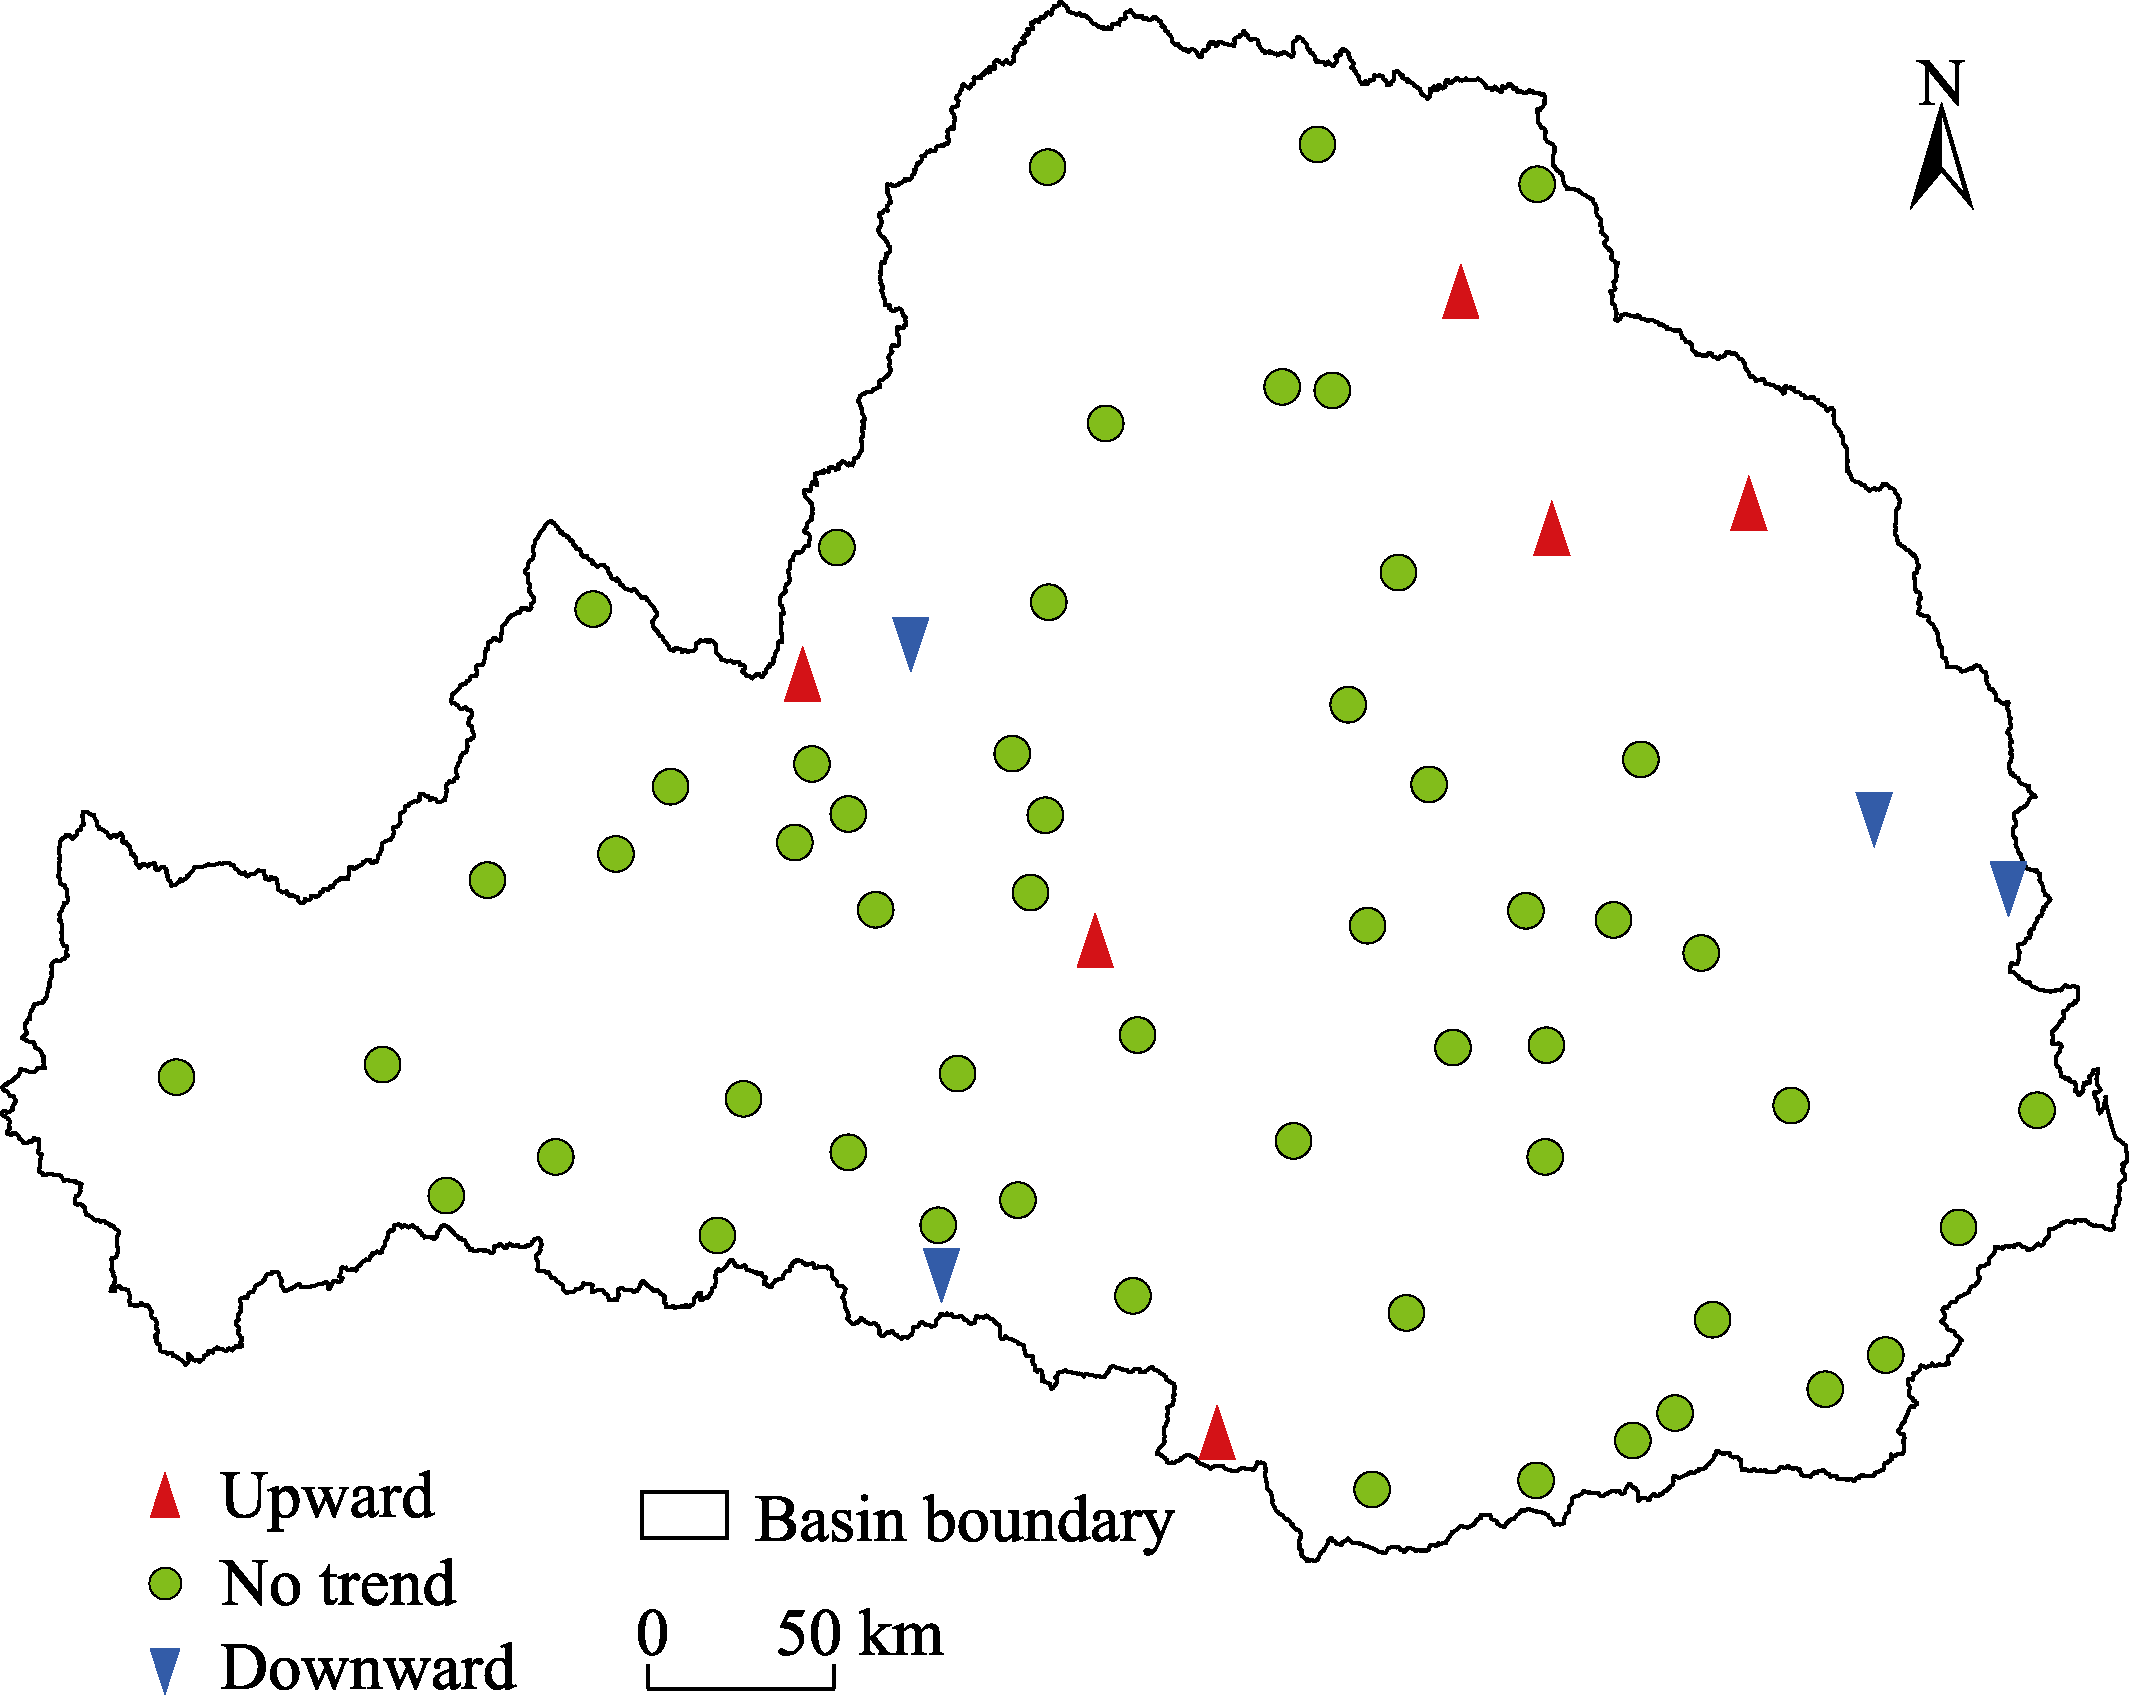
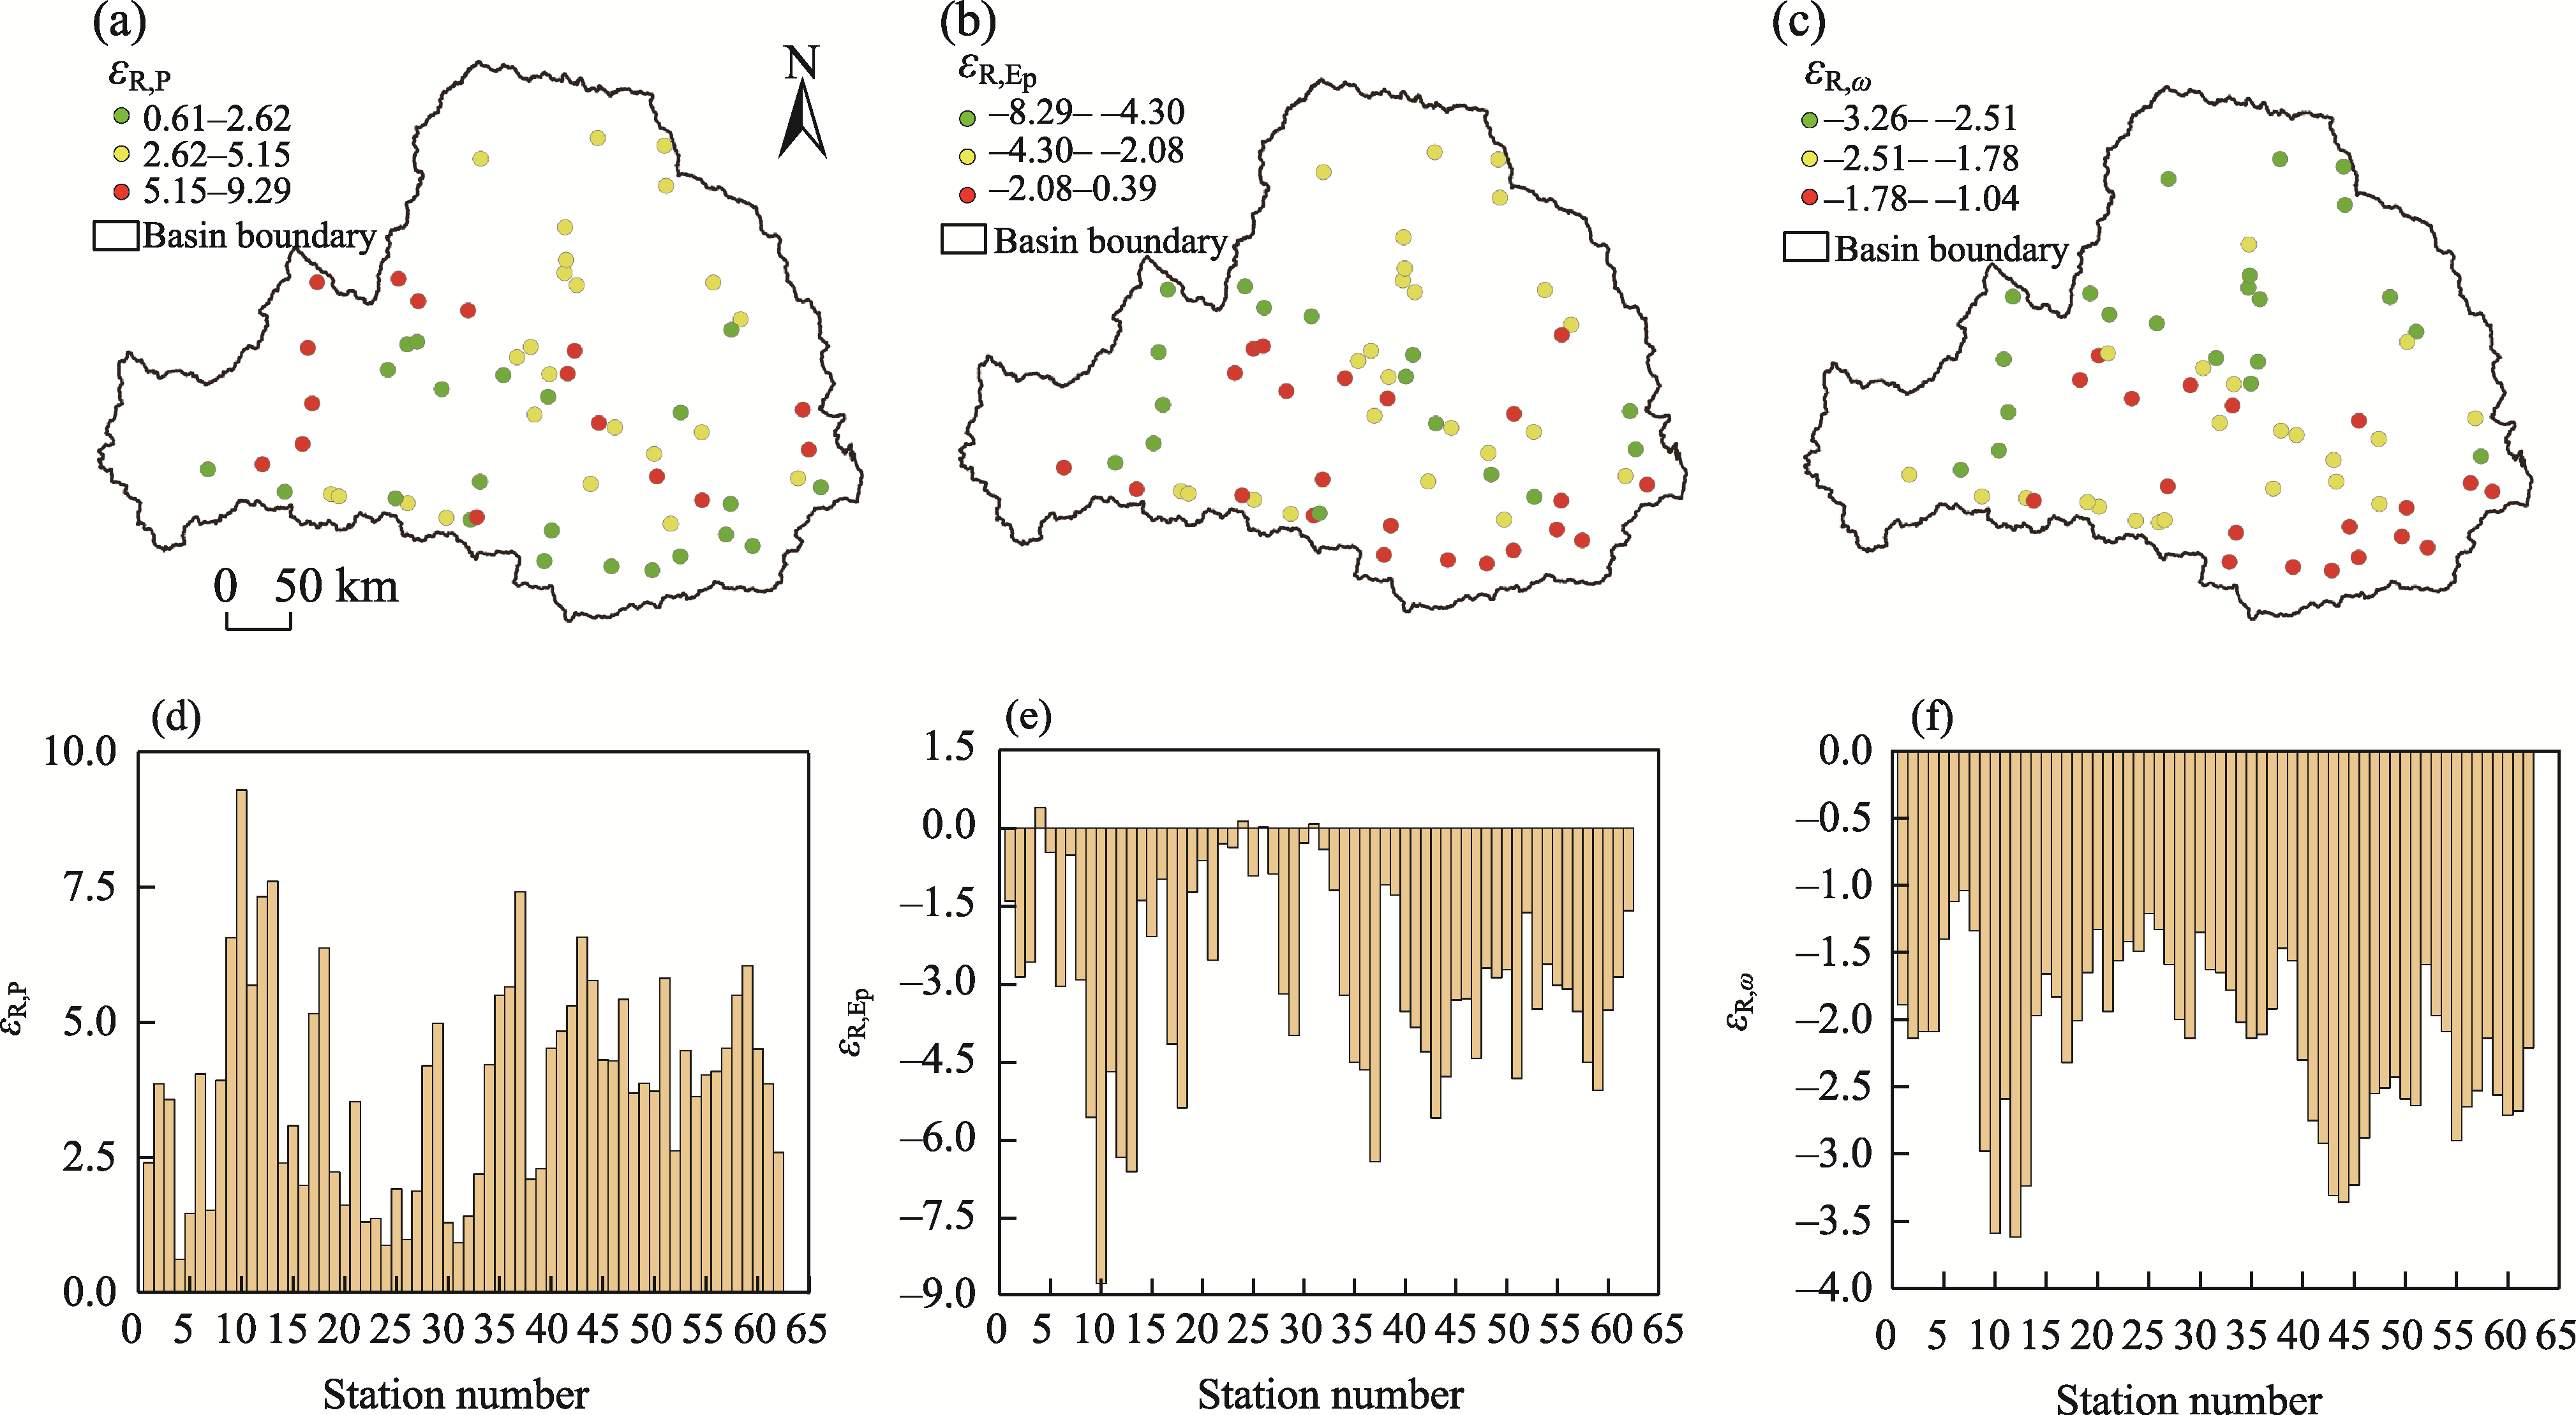
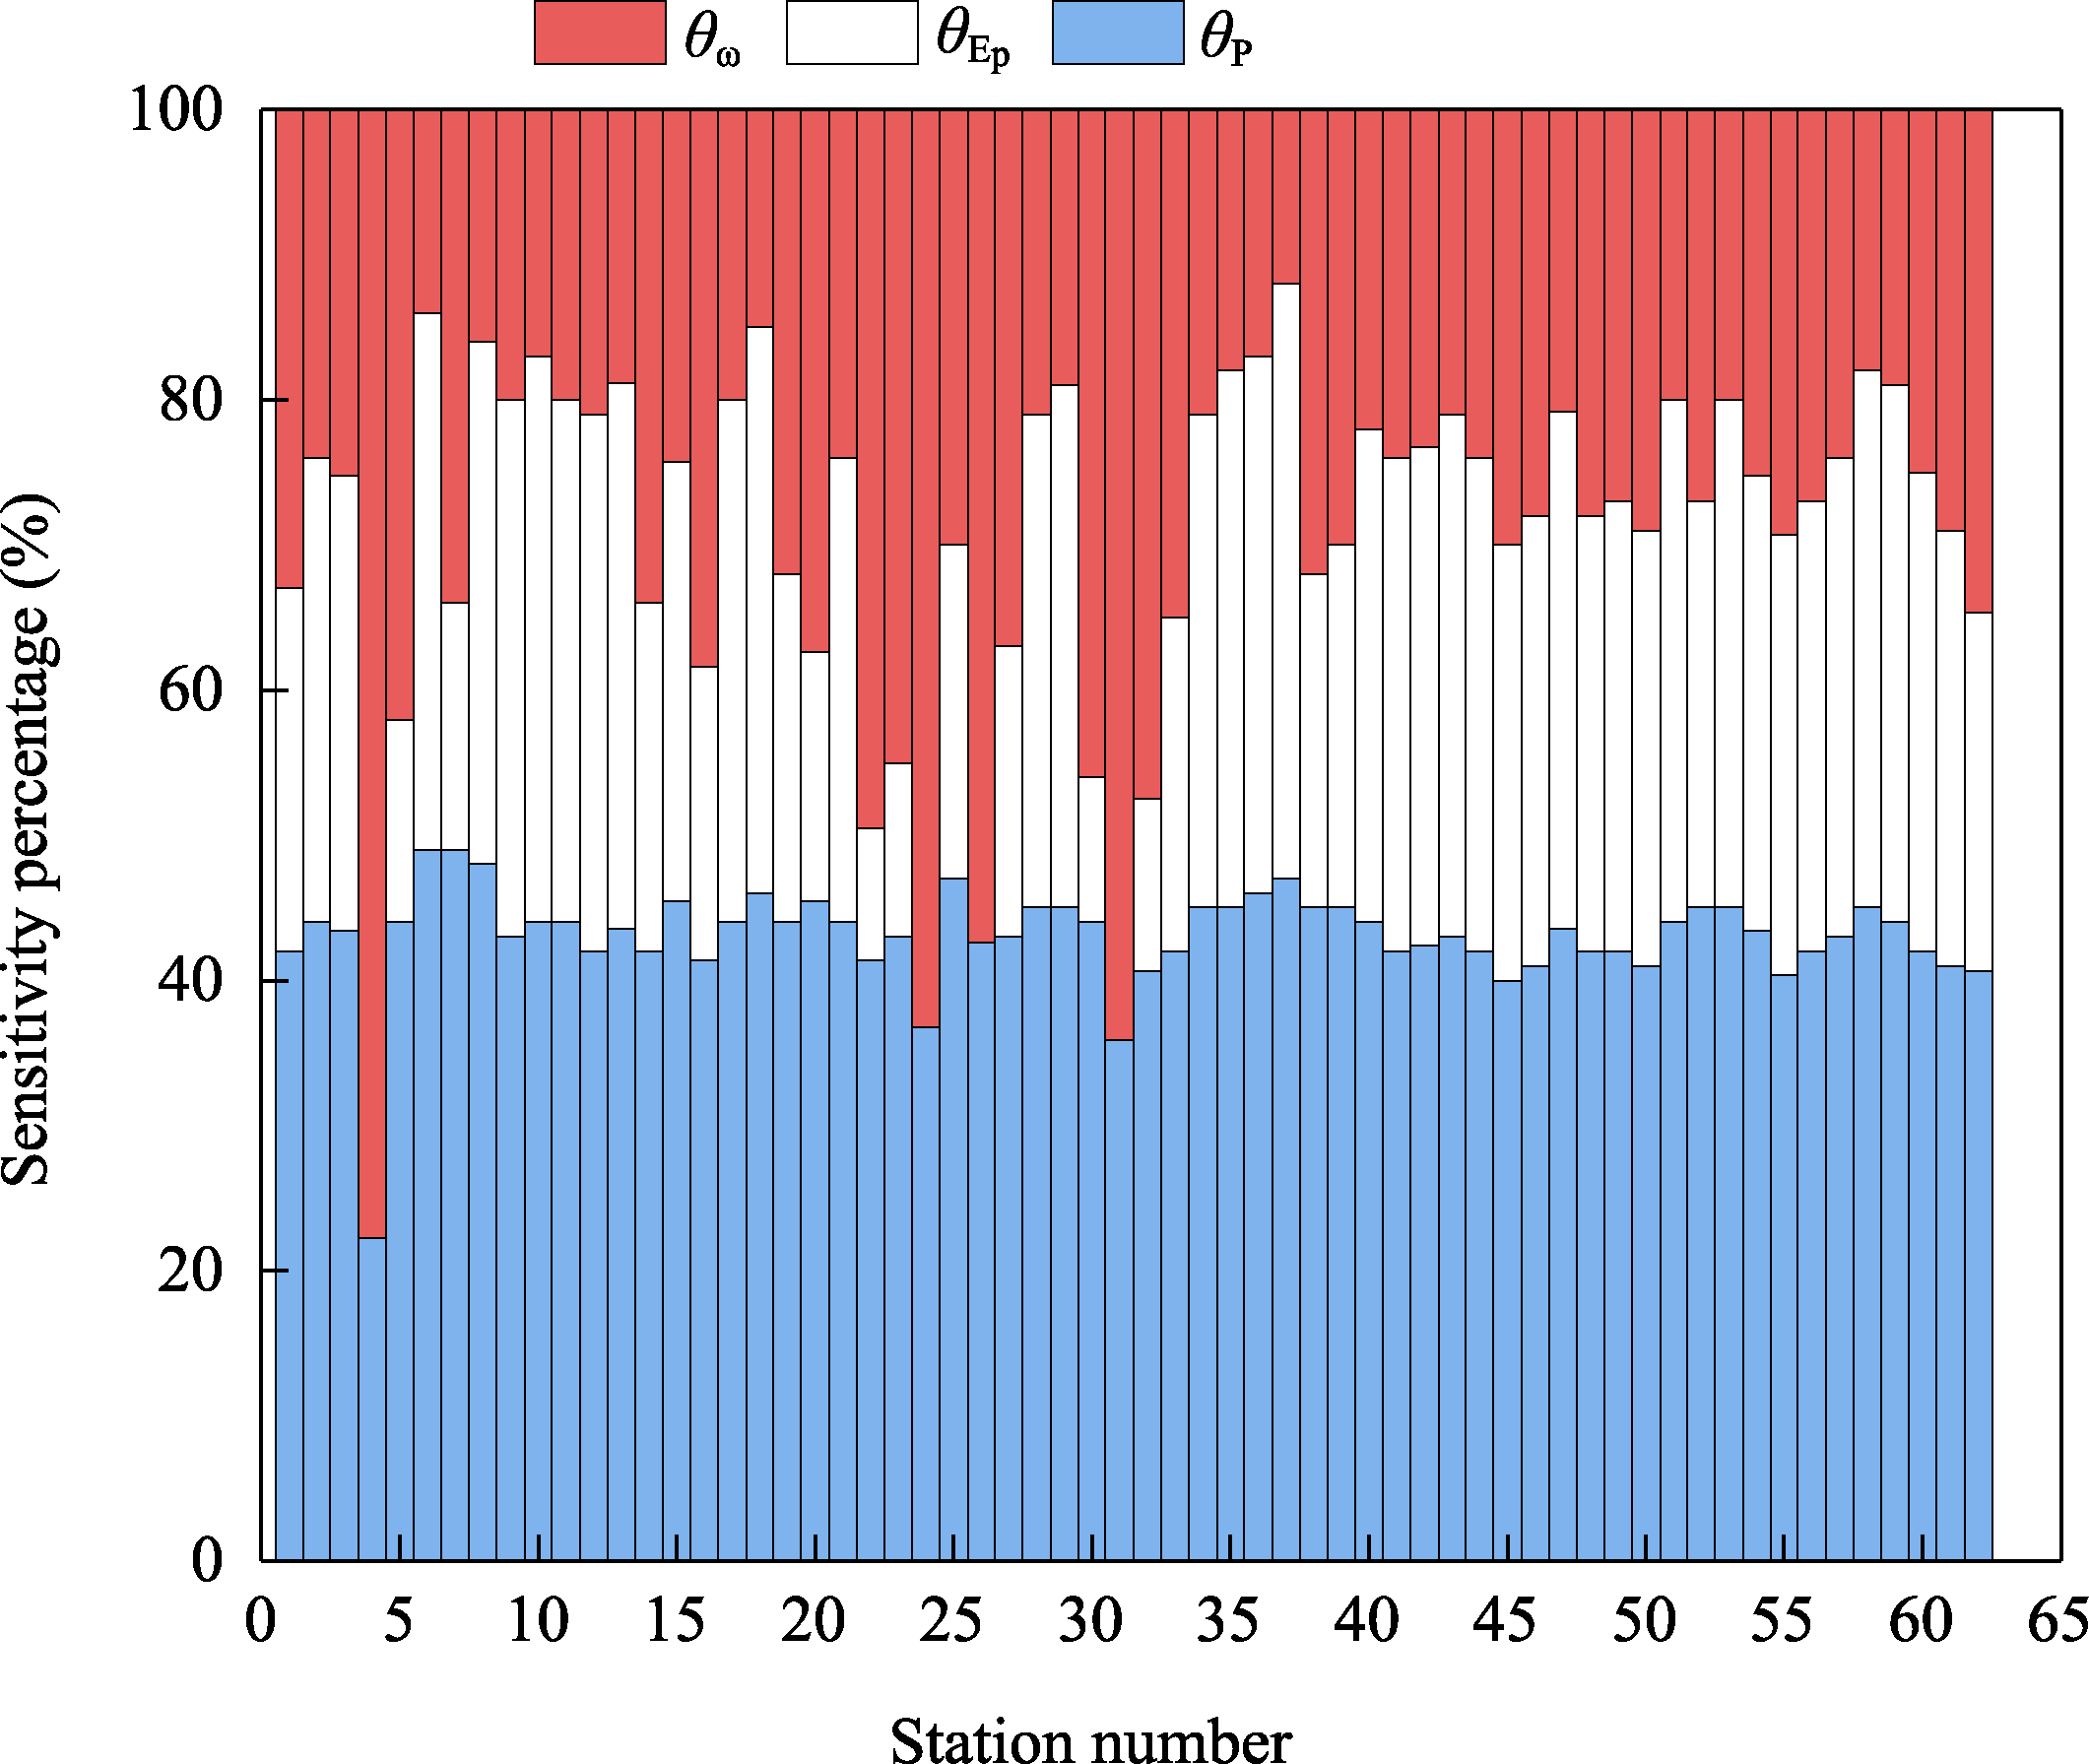
Abstract Exploring the current runoff characteristics after the large-scale implementation of the Grain for Green (GFG) project and investigating its sensitivities to potential drivers are crucial for water resource prediction and management. Based on the measured runoff data of 62 hydrological stations in the Weihe River Basin (WRB) from 2006 to 2018, we analyzed the temporal and spatial runoff characteristics in this study. Correlation analysis was used to investigate the relationships between different runoff indicators and climate-related factors. Additionally, an improved Budyko framework was applied to assess the sensitivities of annual runoff to precipitation, potential evaporation, and other factors. The results showed that the daily runoff flow duration curves (FDCs) of all selected hydrological stations fall in three narrow ranges, with the corresponding mean annual runoff spanning approximately 1.50 orders of magnitude, indicating that the runoff of different hydrological stations in the WRB varied greatly. The trend analysis of runoff under different exceedance frequencies showed that the runoff from the south bank of the Weihe River was more affluent and stable than that from the north bank. The runoff was unevenly distributed throughout the year, mainly in the flood season, accounting for more than 50.00% of the annual runoff. However, the trend of annual runoff change was not obvious in most areas. Correlation analysis showed that rare-frequency runoff events were more susceptible to climate factors. In this study, daily runoff under 10%-20% exceeding frequencies, consecutive maximum daily runoff, and low-runoff variability rate had strong correlations with precipitation, aridity index, and average runoff depth on rainy days. In comparison, daily runoff under 50%-99% exceeding frequencies, consecutive minimum daily runoff, and high-runoff variability rate had weak correlations with all selected impact factors. The sensitivity analysis results suggested that the sensitivity of annual runoff to precipitation was always higher than that to potential evaporation. The runoff about 87.10% of the selected hydrological stations were most sensitive to precipitation changes, and 12.90% were most sensitive to other factors. The spatial pattern of the sensitivity analysis indicated that in relatively humid southern areas, runoff was more sensitive to potential evaporation and other factors, and less sensitive to precipitation.
|
|
Received: 19 July 2022
Published: 31 December 2022
|
|
Corresponding Authors:
*GAO Peng (E-mail: gaopeng@ms.iswc.ac.cn);MU Xingmin (E-mail: xmmu@ms.iswc.ac.cn)
|
|
|
| [1] |
Bai Y P, Zhao G J, Zhang L M, et al. 2020. Spatiotemporal variation of sediment load in the Weihe River Basin in recent 55 years and the driving factors. Journal of Soil and Water Conservation, 34(4): 91-97. (in Chinese)
|
|
|
| [2] |
Bassiouni M, Oki D S. 2013. Trends and shifts in streamflow in Hawai'i, 1913-2008. Hydrological Processes, 27(10): 1484-1500.
doi: 10.1002/hyp.9298
|
|
|
| [3] |
Beck H E, De Roo A, Van Dijk A. 2015. Global maps of streamflow characteristics based on observations from several thousand catchments. Journal of Hydrometeorology, 16(4): 1478-1501.
doi: 10.1175/JHM-D-14-0155.1
|
|
|
| [4] |
Berghuijs W R, Larsen J R, Emmerik T H, et al. 2017. A global assessment of runoff sensitivity to changes in precipitation, potential evaporation, and other factors. Water Resources Research, 53(10): 8475-8486.
doi: 10.1002/2017WR021593
|
|
|
| [5] |
Budyko M I. 1974. Climate and Life. San Diego: Academic Press.
|
|
|
| [6] |
Chang J, Wang Y, Istanbulluoglu E, et al. 2015. Impact of climate change and human activities on runoff in the Weihe River Basin, China. Quaternary International, 380: 169-179.
|
|
|
| [7] |
Cigizoglu H K, Bayazit M. 2015. A generalized seasonal model for flow duration curve. Hydrological Processes, 14(6): 1053-1067.
doi: 10.1002/(SICI)1099-1085(20000430)14:6<1053::AID-HYP996>3.0.CO;2-B
|
|
|
| [8] |
Droogers P, Allen R G. 2002. Estimating reference evapotranspiration under inaccurate data conditions. Irrigation and Drainage Systems, 16(1): 33-45.
doi: 10.1023/A:1015508322413
|
|
|
| [9] |
Feng X M, Fu B J, Piao S L, et al. 2016. Revegetation in China's Loess Plateau is approaching sustainable water resource limits. Nature Climate Change, 6: 1019-1022.
doi: 10.1038/nclimate3092
|
|
|
| [10] |
Fu B P. 1981. On the calculation of the evaporation from land surface. Scientia Atmospherica Sinica, 5: 23-31. (in Chinese)
|
|
|
| [11] |
Gao P, Geissen V, Ritsema C J, et al. 2013. Impact of climate change and anthropogenic activities on stream flow and sediment discharge in the Wei River basin, China. Hydrology and Earth System Sciences, 17(3): 961-972.
doi: 10.5194/hess-17-961-2013
|
|
|
| [12] |
Gao P, Jiang G T, Wei Y P, et al. 2015. Streamflow regimes of the Yanhe River under climate and land use change, Loess Plateau, China. Hydrological Processes, 29(10): 2402-2413.
doi: 10.1002/hyp.10309
|
|
|
| [13] |
Gao P, Li P F, Zhao B L, et al. 2017. Use of double mass curves in hydrologic benefit evaluations. Hydrological Processes, 31(26): 4639-4646.
doi: 10.1002/hyp.11377
|
|
|
| [14] |
Gao X Y, Feng C L. 2019. An assumption for the plan on constructing water ecological corridor in the south bank of Weihe River (Shaanxi section). Water Resources Development and Management, 3: 6-11. (in Chinese)
|
|
|
| [15] |
Greve P, Orlowsky B, Mueller B, et al. 2014. Global assessment of trends in wetting and drying over land. Nature Geoscience, 7(10): 716-721.
doi: 10.1038/ngeo2247
|
|
|
| [16] |
Hevesi J A, Istok J D, Flint A L. 1992. Precipitation estimation in mountainous terrain using multivariate geostatistics. Part I: Structural Analysis. Journal of Applied Meteorology, 31(7): 661-676.
doi: 10.1175/1520-0450(1992)031<0661:PEIMTU>2.0.CO;2
|
|
|
| [17] |
Huang Z W, Yang H B, Yang D W. 2016. Dominant climatic factors driving annual runoff changes at the catchment scale across China. Hydrology and Earth System Sciences, 20(7): 2573-2587.
doi: 10.5194/hess-20-2573-2016
|
|
|
| [18] |
Huntington J, Mcgwire K, Morton C, et al. 2016. Assessing the role of climate and resource management on groundwater dependent ecosystem changes in arid environments with the Landsat archive. Remote Sensing of Environment, 185: 186-197.
doi: 10.1016/j.rse.2016.07.004
|
|
|
| [19] |
Jia Y Y, Yang J P. 2017. The prediction on housing demand caused by population change in Guanzhong urban agglomeration. Land Development and Engineering Research, 2(8): 27-32.
|
|
|
| [20] |
Jiang C, Zhang H Y, Wang X C, et al. 2019. Challenging the land degradation in China's Loess Plateau: Benefits, limitations, sustainability, and adaptive strategies of soil and water conservation. Ecological Engineering, 127: 135-150.
doi: 10.1016/j.ecoleng.2018.11.018
|
|
|
| [21] |
Jiang C, Yang Z Y, Li M T, et al. 2021. Exploring soil erosion trajectories and their divergent responses to driving factors: a model-based contrasting study in highly eroded mountain areas. Environmental Science and Pollution Research, 28(12): 14720-14738.
doi: 10.1007/s11356-020-11703-1
|
|
|
| [22] |
Kendall M G. 1990. Rank correlation methods. British Journal of Psychology, 25(1): 86-91.
|
|
|
| [23] |
Li F P, Zhang G X, Dong L Q. 2013. Studies for impact of climate change on hydrology and water resources. Scientia Geographica Sinica, 33(4): 457-464. (in Chinese)
doi: 10.13249/j.cnki.sgs.2013.04.457
|
|
|
| [24] |
Li H J, Shi C X, Sun P C, et al. 2021. Attribution of runoff changes in the main tributaries of the middle Yellow River, China, based on the Budyko model with a time-varying parameter. CATENA, 206: 105557, doi: 10.1016/j.catena.2021.105557.
doi: 10.1016/j.catena.2021.105557
|
|
|
| [25] |
Li J J, Peng S Z, Li Z. 2017. Detecting and attributing vegetation changes on China's Loess Plateau. Agricultural and Forest Meteorology, 247: 260-270.
doi: 10.1016/j.agrformet.2017.08.005
|
|
|
| [26] |
Li L, Ni J R, Chang F, et al. 2020. Global trends in water and sediment fluxes of the world's large rivers. Science Bulletin, 65(1): 62-69.
doi: 10.1016/j.scib.2019.09.012
|
|
|
| [27] |
Li S Y, Yang G Y, Wang H. 2019. The runoff evolution and the differences analysis of the causes of runoff change in different regions: A case of the Weihe River Basin, Northern China. Sustainability, 11(19): 5295, doi: 10.3390/su11195295.
doi: 10.3390/su11195295
|
|
|
| [28] |
Li Y Y, Chang J X, Wang Y M, et al. 2016. Spatiotemporal impacts of climate, land cover change and direct human activities on runoff variations in the Wei River Basin, China. Water, 8(6): 220, doi: 10.3390/w8060220.
doi: 10.3390/w8060220
|
|
|
| [29] |
Li Z W, Xu X L, Yu B F, et al. 2016. Quantifying the impacts of climate and human activities on water and sediment discharge in a karst region of Southwest China. Journal of Hydrology, 542(11): 836-849.
doi: 10.1016/j.jhydrol.2016.09.049
|
|
|
| [30] |
Liu J K, Zhang Z M, Yan G X, et al. 2016. Multi-scale analysis on precipitation-runoff relationship in Chaobaihe basin. Science of Soil and Water Conservation in China, 14(4): 50-59. (in Chinese)
|
|
|
| [31] |
Mann H B. 1945. Nonparametric test against trend. Econometrica, 13(3): 245-259.
doi: 10.2307/1907187
|
|
|
| [32] |
Miao C Y, Sun Q H, Borthwick A G L, et al. 2016. Linkage between hourly precipitation events and atmospheric temperature changes over China during the Warm Season. Scientific Reports, 6: 22543, doi: 10.1038/srep22543.
doi: 10.1038/srep22543
pmid: 26931350
|
|
|
| [33] |
Nilawar A P, Waikar M L. 2018. Impacts of climate change on streamflow and sediment concentration under RCP 4.5 and 8.5: A case study in Purna river basin, India. Science of the Total Environment, 650: 2685-2696.
doi: 10.1016/j.scitotenv.2018.09.334
|
|
|
| [34] |
Ouyang Z Y, Zheng H, Yue P. 2013. Establishment of ecological compensation mechanisms in China: Perspectives and strategies. Acta Ecologica Sinica, 33(3): 686-692. (in Chinese)
doi: 10.5846/stxb201212071759
|
|
|
| [35] |
Petersen T, Devineni N, Sankarasubramanian A. 2012. Seasonality of monthly runoff over the continental United States: Causality and relations to mean annual and mean monthly distributions of moisture and energy. Journal of Hydrology, 468: 139-150.
|
|
|
| [36] |
Qiu D X, Wu C X, Mu X M, et al. 2022. Spatial-temporal analysis and prediction of precipitation extremes: A case study in the Weihe River Basin, China. Chinese Geographical Science, 32(2): 358-372.
doi: 10.1007/s11769-022-1271-7
|
|
|
| [37] |
Rodriguez-Iturbe I. 2000. Ecohydrology: A hydrologic perspective of climate-soil-vegetation dynamics. Water Resources Research, 36(1): 3-9.
doi: 10.1029/1999WR900210
|
|
|
| [38] |
Rossi M W, Whipple K X, Vivoni E R. 2016. Precipitation and evapotranspiration controls on daily runoff variability in the contiguous United States and Puerto Rico. Journal of Geophysical Research: Earth Surface, 121(1): 128-145.
doi: 10.1002/2015JF003446
|
|
|
| [39] |
Samain B, Pauwels V R N. 2013. Impact of potential and (scintillometer-based) actual evapotranspiration estimates on the performance of a lumped rainfall-runoff model. Hydrology and Earth System Sciences, 17(11): 4525-4540.
doi: 10.5194/hess-17-4525-2013
|
|
|
| [40] |
Shaanxi Province Department of Water Resources, 2019. Shaanxi Water Resources Bulletin. Xi'an: Shaanxi Province Department of Water Resources. (in Chinese)
|
|
|
| [41] |
Song J X, Xu Z X, Liu C M, et al. 2007. Ecological and environmental instream flow requirements for the Wei River—the largest tributary of the Yellow River. Hydrological Processes, 21(8): 1066-1073.
doi: 10.1002/hyp.6287
|
|
|
| [42] |
Sun S L, Chen H S, Ju W M, et al. 2013. Effects of climate change on annual streamflow using climate elasticity in Poyang Lake Basin, China. Theoretical and Applied Climatology, 112(1-2): 169-183.
doi: 10.1007/s00704-012-0714-y
|
|
|
| [43] |
Sun Y X, Tang D S, Ding Y F, et al. 2016. A real-time operation of the Three Gorges Reservoir with flood risk analysis. Water Science and Technology Water Supply, 16(2): 551-562.
doi: 10.2166/ws.2015.172
|
|
|
| [44] |
Vogel R M, Fennessey N M. 1994. Flow-duration curves. 2. New interpretation and confidence-intervals. Journal of Water Resources Planning and Management, 120(4): 485-504.
doi: 10.1061/(ASCE)0733-9496(1994)120:4(485)
|
|
|
| [45] |
Walsh R P D, Lawler D M. 1981. Rainfall seasonality: Description, spatial patterns and change through time. Weather, 36: 201-208.
doi: 10.1002/j.1477-8696.1981.tb05400.x
|
|
|
| [46] |
Wang X X, Su P, Lin Q D, et al. 2019. Distribution, assessment and coupling relationship of heavy metals and macroinvertebrates in sediments of the Weihe River Basin. Sustainable Cities and Society, 50: 101665, doi: 10.1016/j.scs. 2019.101665.
doi: 10.1016/j.scs. 2019.101665
|
|
|
| [47] |
Wen T F, Xiong L H, Jiang C, et al. 2019. Effects of climate variability and human activities on suspended sediment load in the Ganjiang River Basin, China. Journal of Hydrologic Engineering, 24(11): 05019029, doi: 10.1061/(ASCE)HE.1943-5584.000 1859.
doi: 10.1061/(ASCE)HE.1943-5584
|
|
|
| [48] |
Wu C X, Qiu D X, Gao P, et al. 2022. Application of the InVEST model for assessing water yield and its response to precipitation and land use in the Weihe River Basin, China. Journal of Arid Land, 14(4): 426-440.
doi: 10.1007/s40333-022-0013-0
|
|
|
| [49] |
Xie X H, Liang S L, Yao Y J, et al. 2015. Detection and attribution of changes in hydrological cycle over the Three-North region of China: climate change versus afforestation effect. Agricultural and Forest Meteorology, 203: 74-87.
doi: 10.1016/j.agrformet.2015.01.003
|
|
|
| [50] |
Xie Z B, Mu X M, Gao P, et al. 2022. Variation characteristics of runoff in the upper reaches of Beiluo River based on R/S and Morlet wavelet analysis. Research of Soil and Water Conservation, 29(2): 139-144. (in Chinese)
|
|
|
| [51] |
Yang H B, Qi J, Xu X Y, et al. 2014. The regional variation in climate elasticity and climate contribution to runoff across China. Journal of Hydrology, 517: 607-616.
doi: 10.1016/j.jhydrol.2014.05.062
|
|
|
| [52] |
Yang J, Jin J M, Shao J, et al. 2021. Vegetation restoration and its impact on runoff in typical areas of middle Loess Plateau. Transactions of the Chinese Society for Agricultural Machinery, 52(5): 258-266, 257. (in Chinese)
|
|
|
| [53] |
Yang L, Zhao G J, Tian P, et al. 2022. Runoff changes in the major river basins of China and their responses to potential driving forces. Journal of Hydrology, 607: 127536, doi: 10.1016/j.jhydrol.2022.127536.
doi: 10.1016/j.jhydrol.2022.127536
|
|
|
| [54] |
Zeng L, Li J, Zhou Z X, et al. 2020. Optimizing land use patterns for the grain for Green Project based on the efficiency of ecosystem services under different objectives. Ecological Indicators, 114: 106347, doi: 10.1016/j.ecolind.2020.106347.
doi: 10.1016/j.ecolind.2020.106347
|
|
|
| [55] |
Zhan C S, Jiang S S, Sun F B, et al. 2014. Quantitative contribution of climate change and human activities to runoff changes in the Wei River basin, China. Hydrology and Earth System Sciences, 18(8): 3069-3077.
doi: 10.5194/hess-18-3069-2014
|
|
|
| [56] |
Zhang B Q, He C S. 2016. A modified water demand estimation method for drought identification over arid and semiarid regions. Agricultural and Forest Meteorology, 230: 58-66.
|
|
|
| [57] |
Zhang K, Lu Y H, Fu B J, et al. 2018. The effects of restoration on vegetation trends: spatiotemporal variability and influencing factors. Earth and Environmental Science Transactions of the Royal Society of Edinburgh, 109(3-4): 473-481.
doi: 10.1017/S1755691018000518
|
|
|
| [58] |
Zhao G J, Mu X M, Tian P, et al. 2013. Climate changes and their impacts on water resources in semiarid regions: a case study of the Wei River basin, China. Hydrological Processes, 27(26): 3852-3863.
doi: 10.1002/hyp.9504
|
|
|
| [59] |
Zhou A K, Yan B W. 2014. Fractal characteristics of monthly runoff process in Wei River watershed. Journal of Hydroelectric Engineering, 33(4): 7-13. (in Chinese)
|
|
|
| [60] |
Zuo D P, Xu Z X, Zhao J, et al. 2015. Response of runoff to climate change in the Wei River basin, China. Hydrological Sciences Journal, 60(3): 508-522.
doi: 10.1080/02626667.2014.943668
|
|
|
|
Viewed |
|
|
|
Full text
|
|
|
|
|
Abstract
|
|
|
|
|
Cited |
|
|
|
|
| |
Shared |
|
|
|
|
| |
Discussed |
|
|
|
|