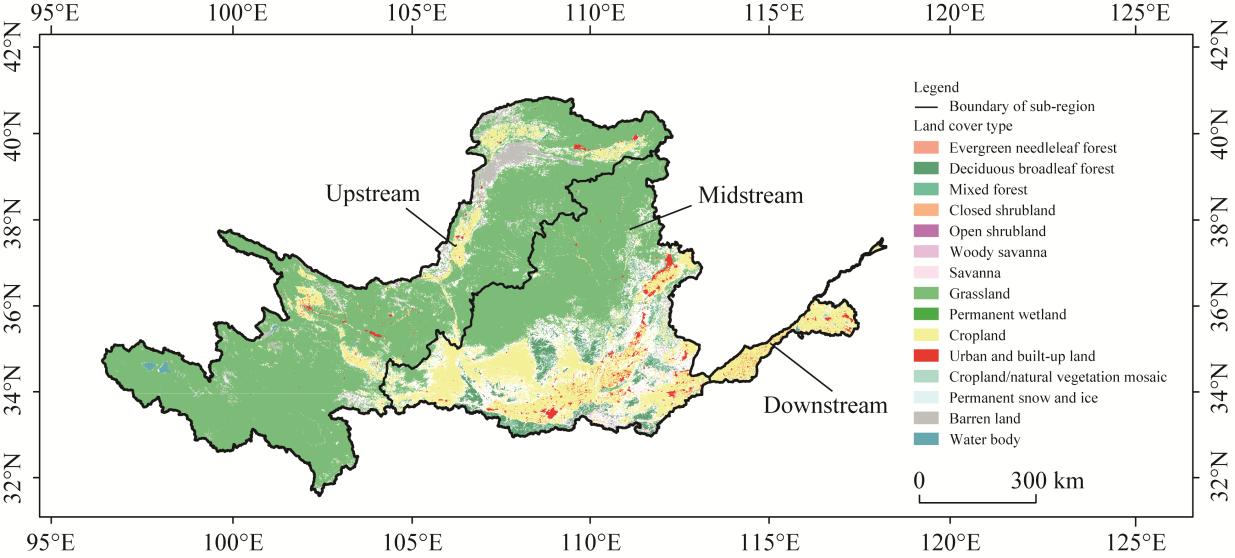
Lagged and cumulative vegetation responses to extreme climate and drought in arid and semi-arid ecosystems: Insights from the Yellow River Basin, China
WANG Meiying1, CHEN Yangbo1,*(), Shailesh Kumar SINGH2
1School of Geography and Planning, Sun Yat-sen University, Guangzhou 510275, China 2National Institute of Water and Atmospheric Research, Christchurch 8011, New Zealand
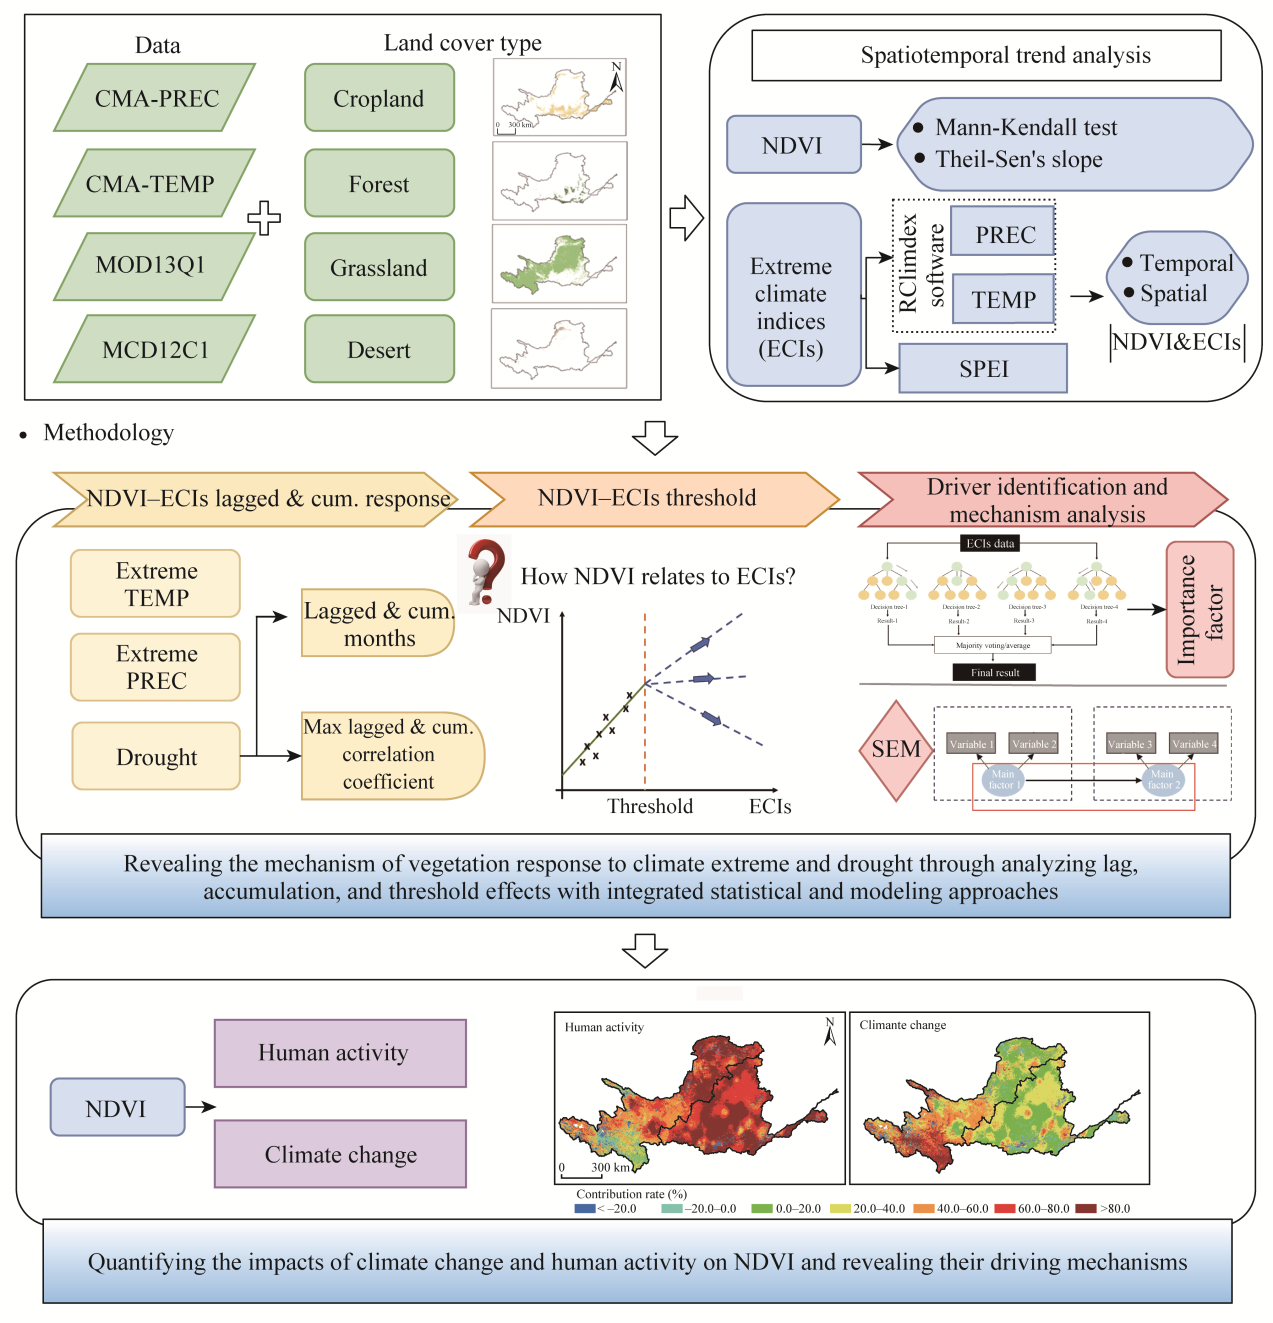
Climate extremes strongly influence vegetation dynamics in arid and semi-arid regions, but the mechanisms of vegetation responses remain unclear. Using the Yellow River Basin, China as a case study, we integrated 20 extreme climate indices (11 precipitation-related and 9 temperature-related) and a drought index to assess vegetation responses to climate extremes. An integrated framework combining random forest (RF) and structural equation modeling (SEM) was applied to quantify lagged and cumulative effects and separate the relative impacts of climate change and human activities. The results indicated that: (1) vegetation greenness in the basin increased by 0.004/a, with nearly three-quarters of the area showing a statistically significant upward trend; (2) the frequency of extreme precipitation events increased, while extreme high-temperature events became more frequent and intense, and extreme low-temperature events showed little change; (3) drought exhibited the strongest lagged effect on vegetation, lasting up to 6.7 months, whereas individual extreme event mainly induced cumulative effects on normalized difference vegetation index (NDVI); (4) drought and precipitation primarily affected the duration of vegetation growth, while temperature mainly controlled its disturbance intensity, with diurnal temperature range (DTR) and extreme temperature indices being the most important; and (5) climate change and human activities jointly dominated NDVI increases over 89.5% of the vegetated area, highlighting the high sensitivity and spatial heterogeneity of vegetation responses. These findings improve our understanding of vegetation-climate thresholds in dryland ecosystems and provide a transferable framework for environmental impact assessment and adaptive ecosystem management in arid regions.
Received: 03 February 2026
Published: 31 October 2026
Conceptualization: WANG Meiying; Methodology: WANG Meiying, CHEN Yangbo; Formal analysis: WANG Meiying; Writing - original draft preparation: WANG Meiying; Writing - review and editing: WANG Meiying, CHEN Yangbo, Shailesh Kumar SINGH; Funding acquisition: CHEN Yangbo; Resources: CHEN Yangbo; Supervision: WANG Meiying, CHEN Yangbo. All authors approved the manuscript.
WANG Meiying, CHEN Yangbo, Shailesh Kumar SINGH. Lagged and cumulative vegetation responses to extreme climate and drought in arid and semi-arid ecosystems: Insights from the Yellow River Basin, China. Journal of Arid Land, 2026, 18(10): 1774-1795.
Table 2 Criteria for identifying normalized difference vegetation index (NDVI) change drivers and calculation of their contributions
Item
Upstream
Midstream
Downstream
YRB
Mean
0.290
0.410
0.480
0.340
Magnitude of change
0.003
0.006
0.005
0.004
Table 3 Multi-year mean and variation amplitude of NDVI in different sub-regions of the Yellow River Basin (YRB) from 2001 to 2020
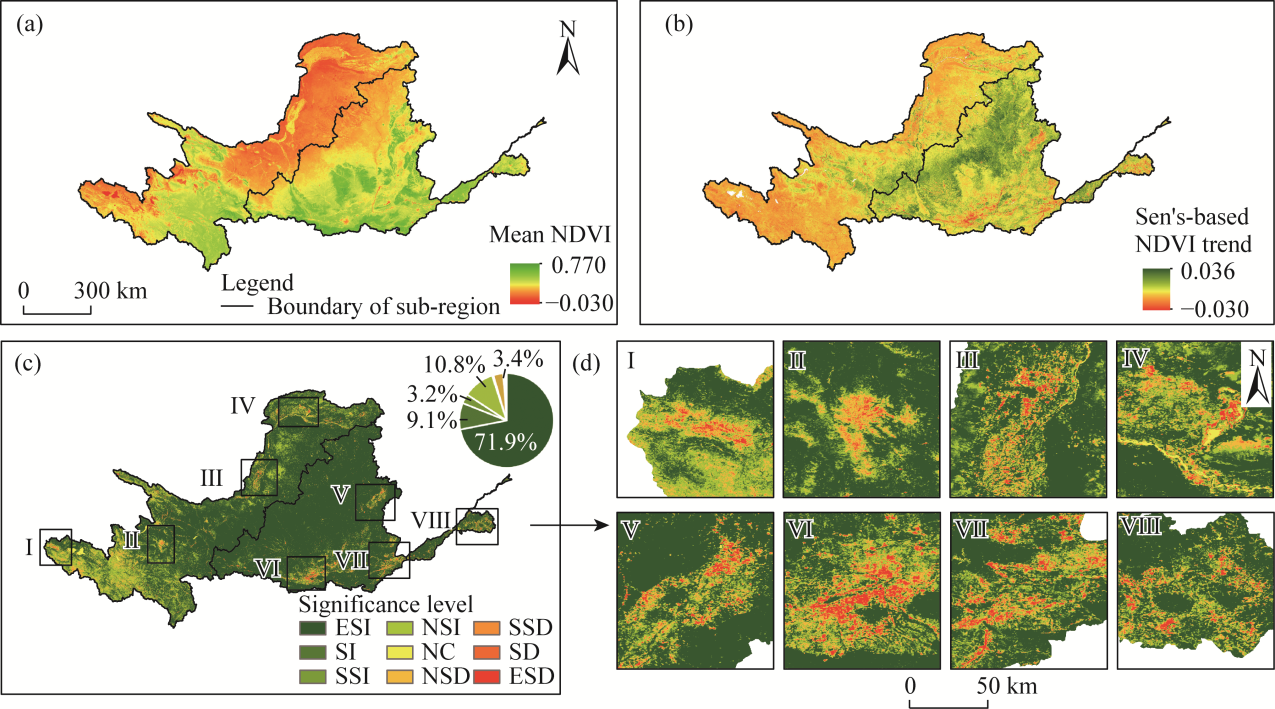
Fig. 3Spatial variation and significance analysis of NDVI in the YRB from 2001 to 2020. (a), mean NDVI; (b) Sen's-based NDVI trend; (c), significance levels and their percentages. ESI, SI, SSI, NSI, NC, NSD, SSD, SD, and ESD represent extremely significant increase, significant increase, slightly significant increase, non-significant increase, no change, non-significant decrease, slightly significant decrease, significant decrease, and extremely significant decrease, respectively; (d), sub-regions I-VIII indicate areas experiencing a highly significant decline in NDVI.
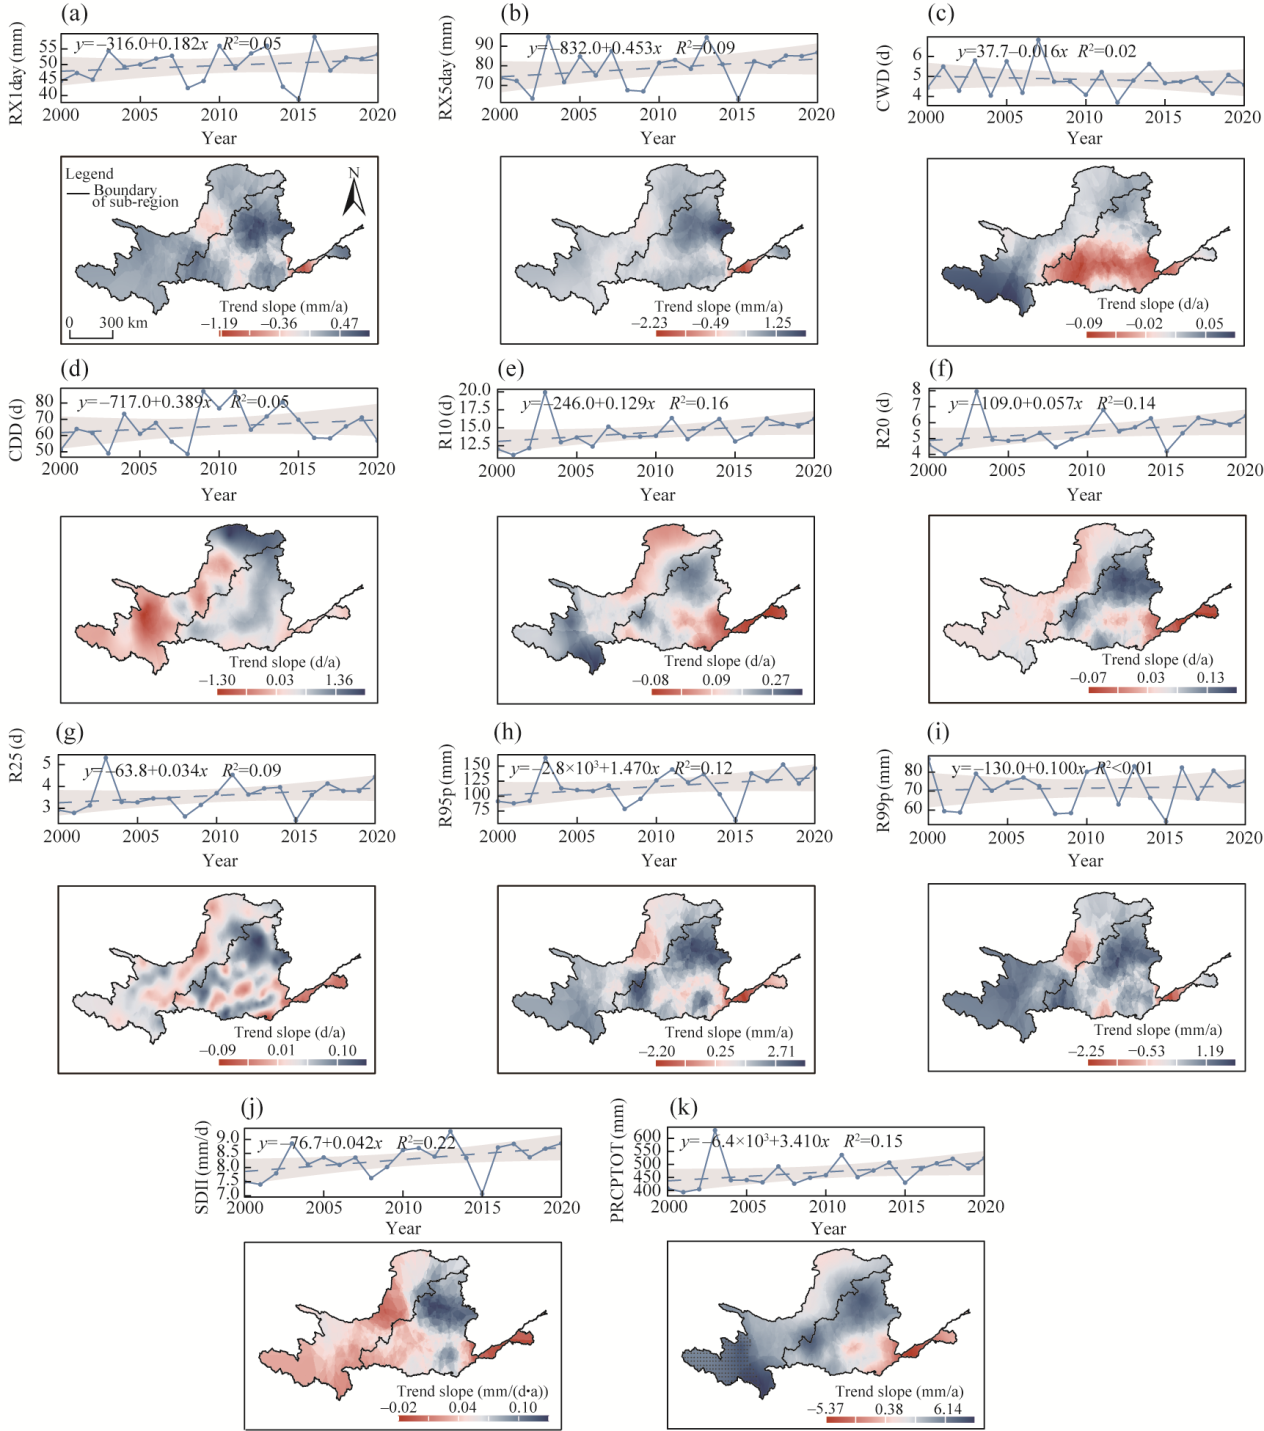
Fig. 4Spatial trend slopes and corresponding annual time series of 11 extreme precipitation indices in the YRB from 2001 to 2020. (a), maximum daily precipitation per year (RX1day); (b), maximum 5-d consecutive precipitation per year (RX5day); (c), consecutive wet days (CWD); (d), consecutive dry days (CDD); (e), number of days per year with precipitation ≥10 mm (R10); (f), number of days per year with precipitation ≥20 mm (R20); (g), number of days per year with precipitation ≥25 mm (R25); (h), annual total precipitation on days exceeding the 95th percentile (R95p); (i), annual total precipitation on days exceeding the 99th percentile (R99p); (j), simple daily intensity index (SDII); and (k), annual total wet-day precipitation (PRCPTOT). The upper sub-panels show the annual time series and linear trends, with shaded areas representing 95.0% confidence intervals, whereas the lower subpanels show the spatial distribution of trend slopes for each index.
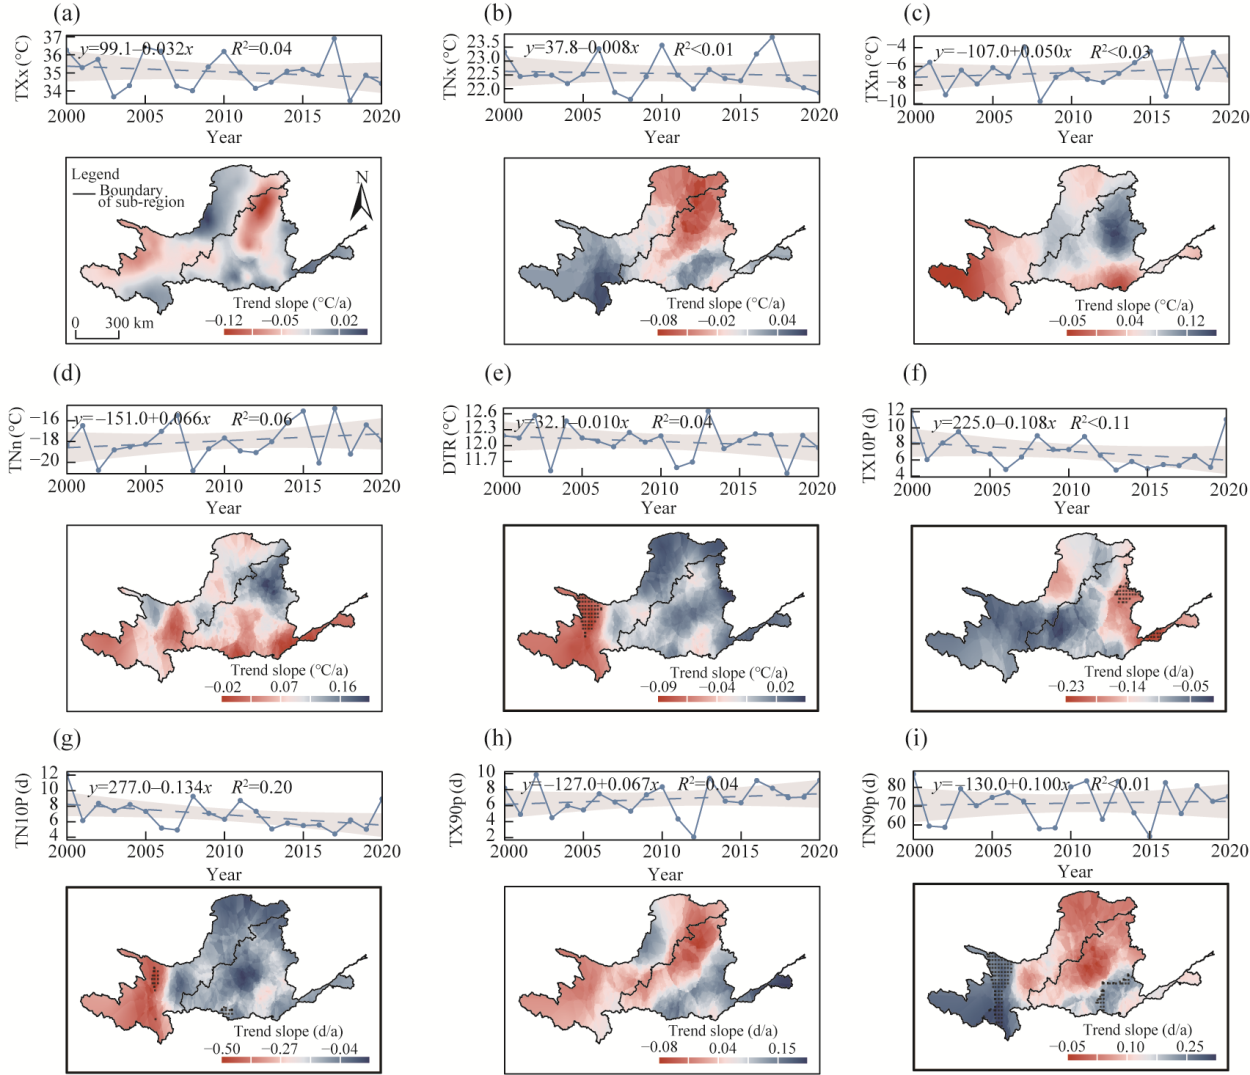
Fig. 5Spatial trend slopes and annual time series of 9 extreme temperature indices in the YRB from 2001 to 2020. (a), annual maximum of daily maximum temperature (TXx); (b), annual maximum of daily minimum temperature (TNx); (c), annual minimum of daily maximum temperature (TXn); (d), annual minimum of daily minimum temperature (TNn); (e), diurnal temperature range (DTR); (f), cold days (TX10p); (g), cold nights (TN10p); (h), warm days (TX90p); and (i), warm nights (TN90p). The upper subpanels show the annual time series and linear trends, with shaded areas representing 95.0% confidence intervals, whereas the lower subpanels show the spatial distribution of trend slopes for each index.
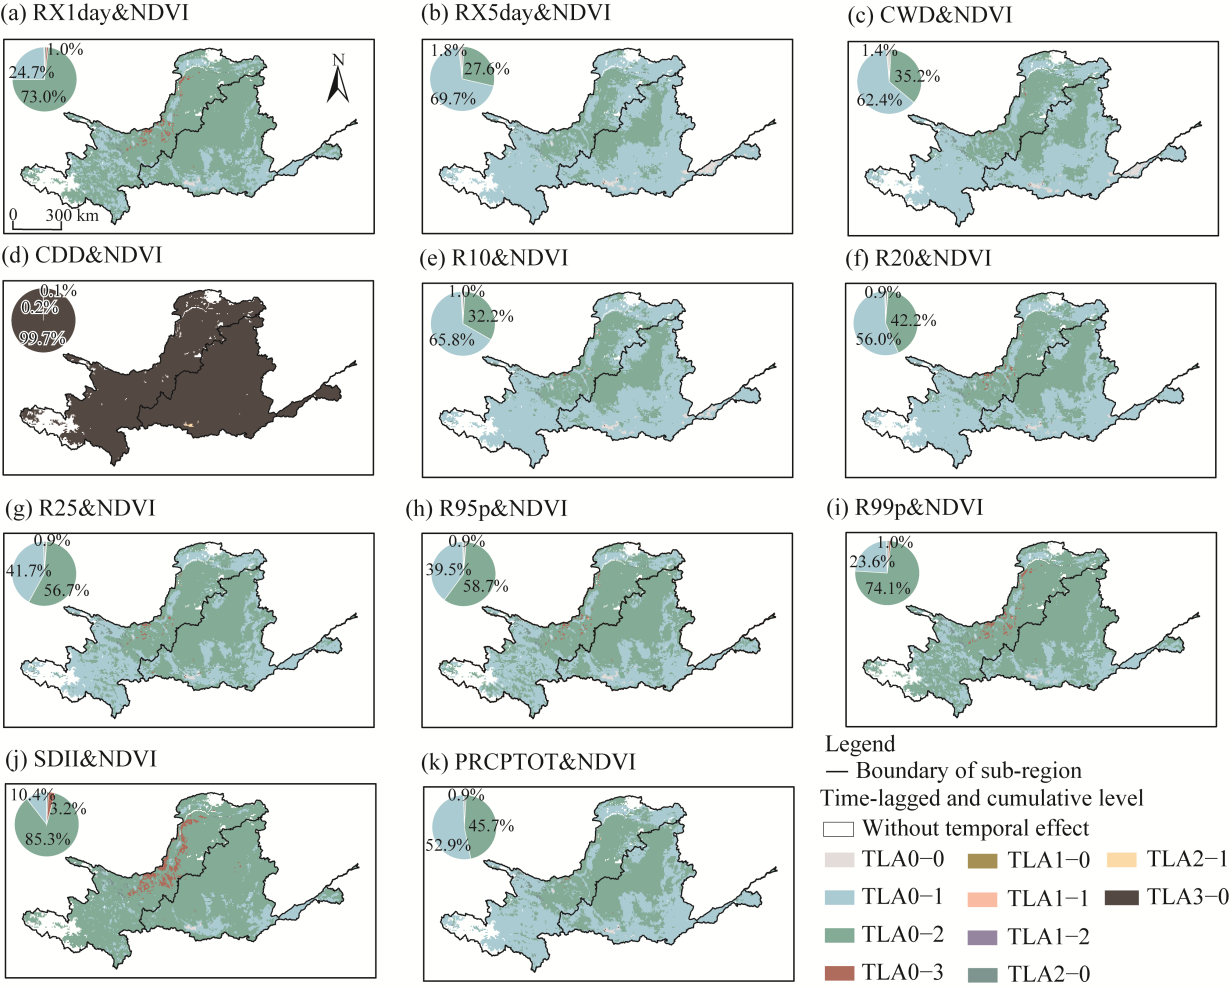
Fig. 6Time-lagged and cumulative effects of extreme precipitation indices on NDVI in the YRB from 2001 to 2020. (a), RX1day&NDVI; (b), RX5day&NDVI; (c), CWD&NDVI; (d), CDD&NDVI; (e), R10&NDVI; (f), R20&NDVI; (g), R25&NDVI; (h), R95p&NDVI; (i), R99p&NDVI; (j), SDII&NDVI; (k), PRCPTOT&NDVI. TLAi-j denotes an i-month lag and a j-month cumulative period. The pie charts show the area proportions of different temporal response types and the first three values are shown.
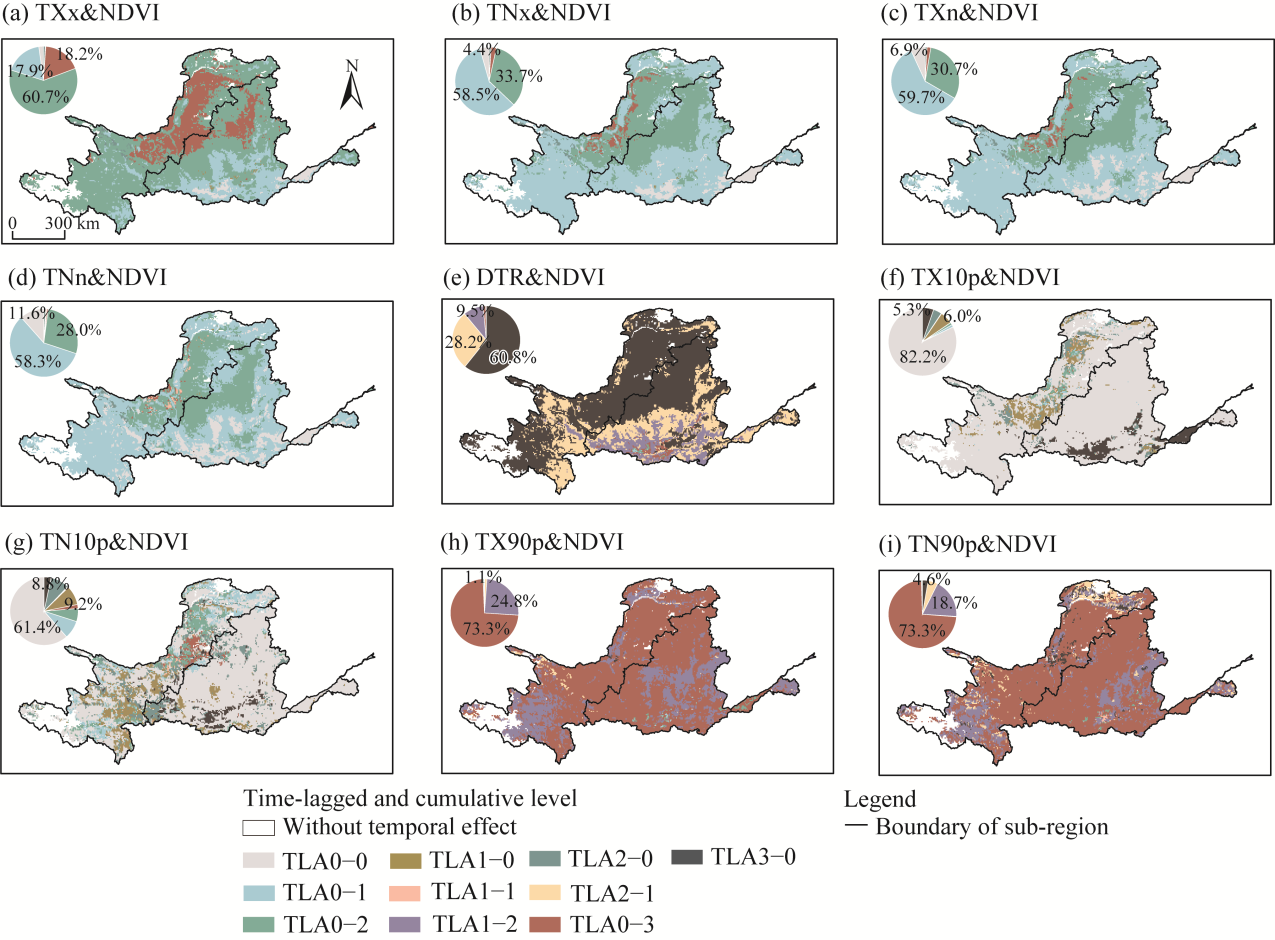
Fig. 7Time-lagged and cumulative effects of extreme temperature indices on NDVI in the YRB from 2001 to 2020. (a), TXx&NDVI; (b), TNx&NDVI; (c), TXn&NDVI; (d), TNn&NDVI; (e), DTR&NDVI; (f), TX10p&NDVI; (g), TN10p&NDVI; (h), TX90p&NDVI; (i), TN90p&NDVI. TLAi-j denotes an i-month lag and a j-month cumulative period. The pie charts show the area proportions of different temporal response types and the first three values are shown.
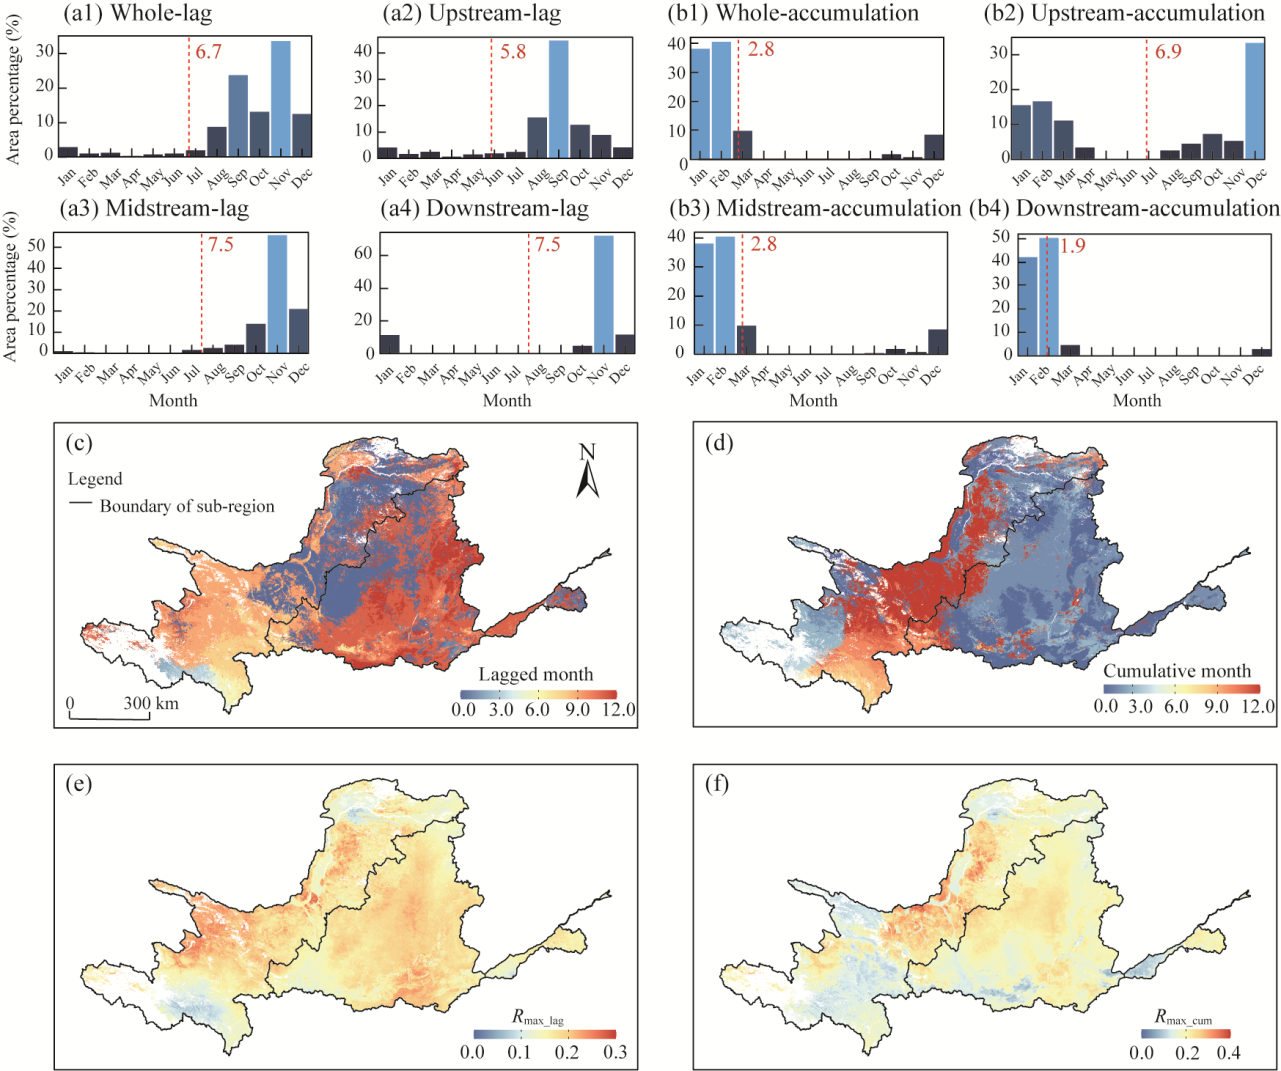
Fig. 8Area percentage and spatial distribution of lagged and cumulative effects of drought on vegetation in the YRB. (a1-a4), area percentages of optimal lagged months for the whole, upstream, midstream, and downstream regions, respectively; (b1-b4), area percentages of optimal cumulative months for the whole, upstream, midstream, and downstream regions, respectively; (c), spatial distribution of lagged month; (d), spatial distribution of cumulative month; (e), maximum lagged correlation coefficient (Rmax_lag); (f), maximum cumulative correlation coefficient (Rmax_cum). The red dashed lines in Figure a1-a4 and b1-b4 indicate the mean optimal lagged and cumulative months for the whole region and sub-regions, respectively.
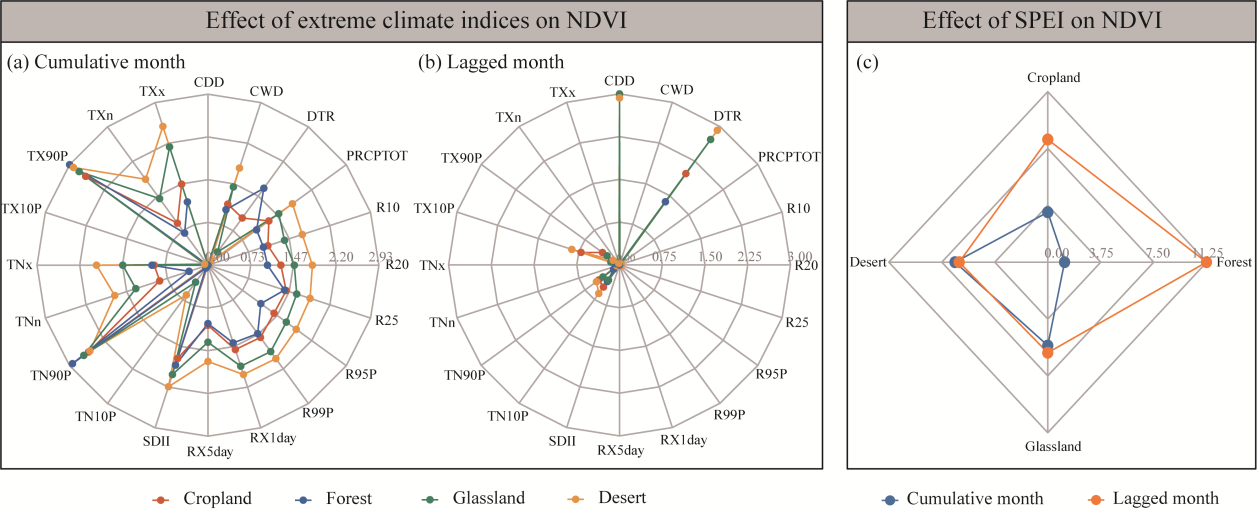
Fig. 9Radar plots showing the cumulative (a) and lagged (b) effects of extreme climate indices on NDVI and effects of Standardized Precipitation Evapotranspiration Index (SPEI) on NDVI across different land cover types (c)
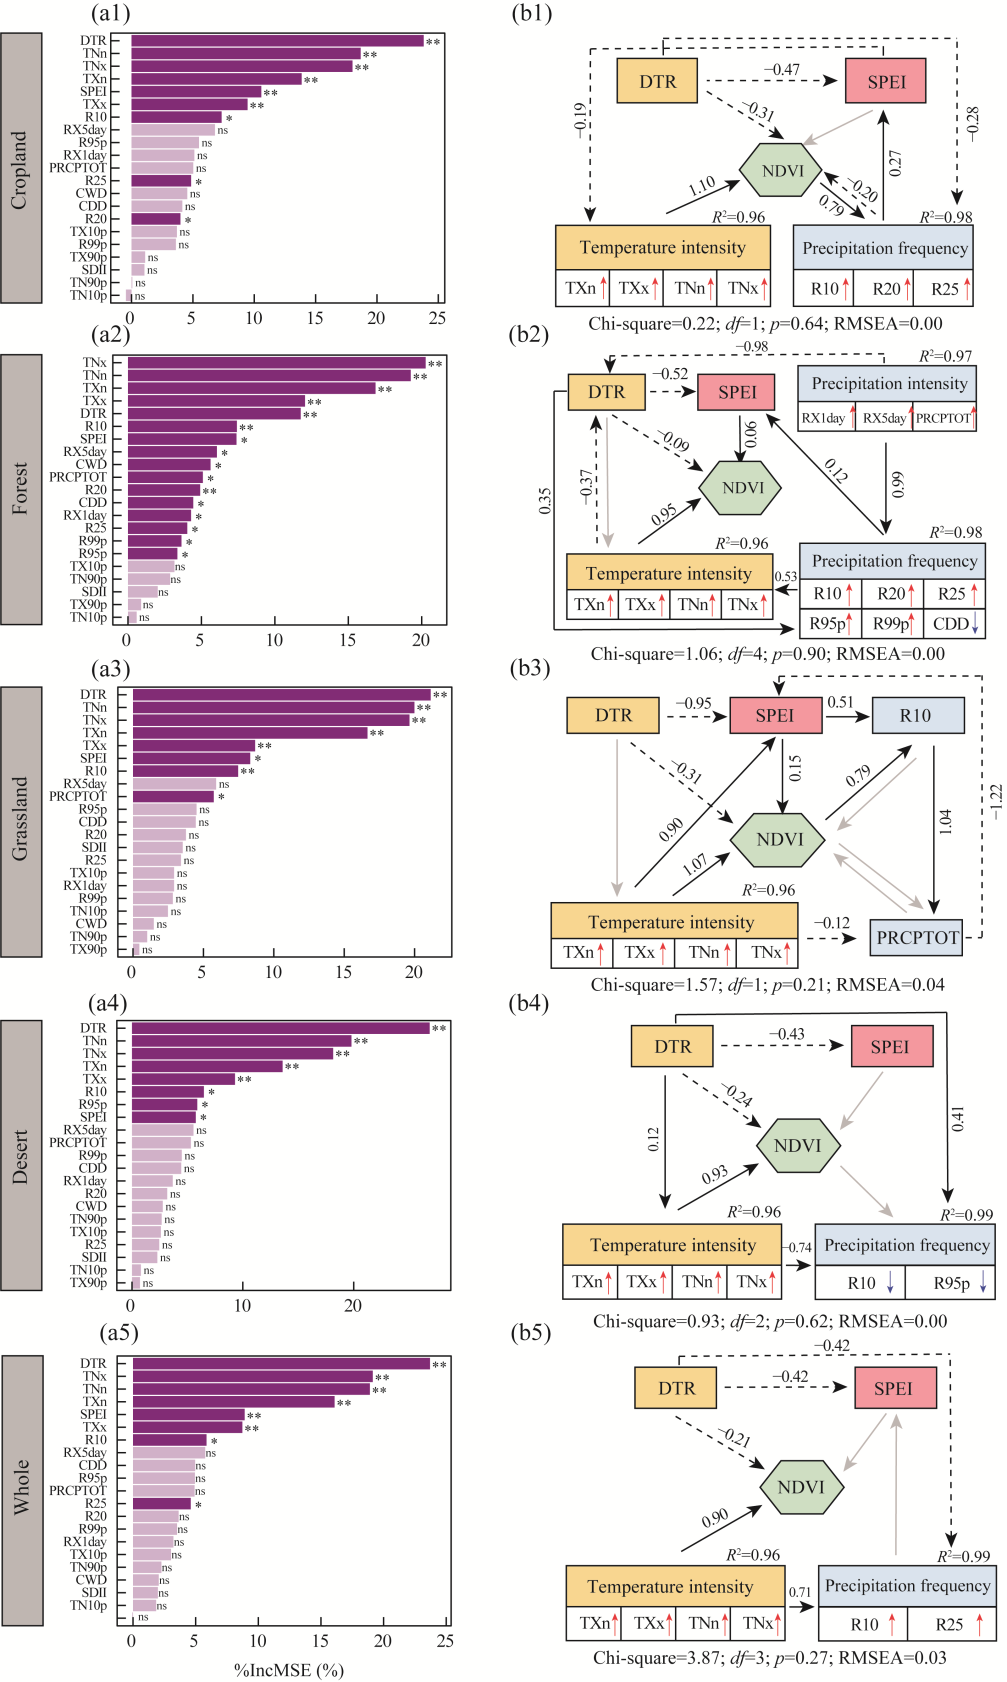
Fig. 10Impacts of extreme climate indices on vegetation across different land cover types based on random forest (RF) model and structural equation modelling (SEM). (a1-a5), RF-based feature importance rankings for cropland, forest, grassland, desert, and the whole region, respectively; (b1-b5), SEM results for cropland, forest, grassland, desert, and the whole region, respectively. %IncMSE, percentage increase in mean squared error. In SEM diagrams, numbers on arrows represent standardized path coefficients, and solid and dashed arrows indicate positive and negative effects, respectively. df, degrees of freedom; p, probability; RMSEA, root mean square error of approximation. * and ** indicate significance at P<0.05 and P<0.01 levels, respectively; ns, no significance.
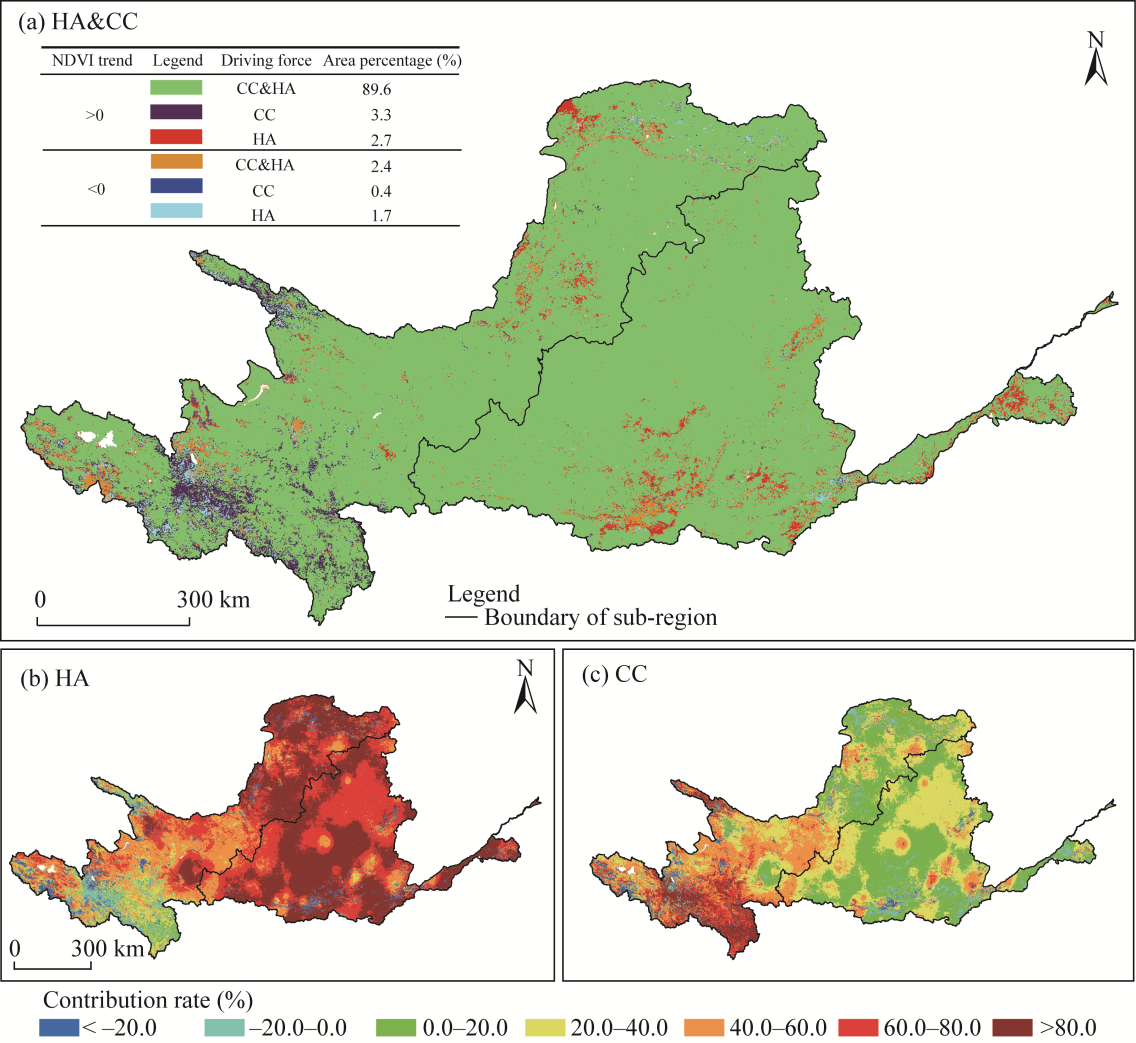
Fig. 11Spatial distribution and contribution rate of climate change (CC) and human activity (HA) to NDVI in the YRB from 2001 to 2020. (a), spatial distribution of driving factors to NDVI. Table in Figure 11a categorizes NDVI trends into increase and decrease, exploring the impacts of CC&HA, CC, and HA on NDVI changes and their area percentages; (b), contribution rate of HA to NDVI; (c), contribution rate of CC to NDVI.
[1]
Bai Y H, Chen J L, Zhang Y W, et al. 2025. Response modes of global vegetation to extreme drought. Global Change Biology, 31(9): e70488, doi: 10.1111/gcb.70488.
[2]
Benestad R E, Lussana C, Dobler A. 2024. Global record-breaking recurrence rates indicate more widespread and intense surface air temperature and precipitation extremes. Science Advances, 10(45): eado3712, doi: 10.1126/sciadv.ado3712.
[3]
Bernardino P N, Keersmaecker W D, Horion S, et al. 2025. Predictability of abrupt shifts in dryland ecosystem functioning. Nature Climate Change, 15: 86-91.
doi: 10.1038/s41558-024-02201-0
[4]
Campbell V, Murphy G, Romanuk T N. 2010. Experimental design and the outcome and interpretation of diversity-stability relations. Oikos, 120(3): 399-408.
doi: 10.1111/more.2010.120.issue-3
[5]
Choat B, Brodribb T J, Brodersen C R, et al. 2018. Triggers of tree mortality under drought. Nature, 558(7711): 531-539.
doi: 10.1038/s41586-018-0240-x
[6]
Ding Y J, Zhang L F, He Y, et al. 2024. Spatiotemporal evolution of agricultural drought and its attribution under different climate zones and vegetation types in the Yellow River Basin of China. Science of The Total Environment, 914: 169687, doi: 10.1016/j.scitotenv.2023.169687.
[7]
Fang L L, Wang L C, Chen W C, et al. 2021. Identifying the impacts of natural and human factors on ecosystem service in the Yangtze and Yellow River Basins. Journal of Cleaner Production, 314(10): 127995, doi: 10.1016/j.jclepro.2021.127995.
[8]
Gao H D, Wang M D, Hao X J. 2024a. Check dams in the Yellow River basin: sediment reduction efficiency and future development. Land Degradation & Development, 35(13): 4042-4054.
doi: 10.1002/ldr.v35.13
[9]
Gao S Q, Lu Y H, Jiang X H. 2025. Increased precipitation and vegetation cover synergistically enhanced the availability and effectiveness of water resources in a dryland region. Journal of Hydrology, 654: 132812, doi: 10.1016/j.jhydrol.2025.132812.
[10]
Gao X R, Zhuo W, Gonsamo A. 2024b. Humid, warm and treed ecosystems show longer time-lag of vegetation response to climate. Geophysical Research Letters, 51(18): e2024GL111737, doi: 10.1029/2024GL111737.
[11]
Gross K, Cardinale B J, Fox J W, et al. 2014. Species richness and the temporal stability of biomass production: a new analysis of recent biodiversity experiments. The American Naturalist, 183(1): 673915, doi: 10.1086/673915.
[12]
Guo W W, Huang S Z, Huang Q, et al. 2023. Drought trigger thresholds for different levels of vegetation loss in China and their dynamics. Agricultural and Forest Meteorology, 331: 109349, doi: 10.1016/j.agrformet.2023.109349.
[13]
He X, Lei X D, Xu Q, et al. 2024. Combining multiple feature selection methods and structural equation modelling for exploring factors affecting stand biomass of natural coniferous-broad leaved mixed forests. Science of The Total Environment, 954: 176669, doi: 10.1016/j.scitotenv.2024.176669.
[14]
Higgins S I, Conradi T, Muhoko E. 2023. Shifts in vegetation activity of terrestrial ecosystems attributable to climate trends. Nature Geoscience, 16(2): 147-153.
doi: 10.1038/s41561-022-01114-x
[15]
Huete A, Didan K, Miura T, et al. 2002. Overview of the radiometric and biophysical performance of the MODIS vegetation indices. Remote Sensing of Environment, 83(1-2): 195-213.
doi: 10.1016/S0034-4257(02)00096-2
[16]
Jia Q, Gao X T, Jiang Z L, et al. 2024. Sensitivity of temperate vegetation to precipitation is higher in steppes than in deserts and forests. Ecological Indicators, 166: 112317, doi: 10.1016/j.ecolind.2024.112317.
[17]
Jiang H L, Xu X. 2022. Impact of extreme climates on vegetation from multiple scales and perspectives in the agro-pastural transitional zone of northern China in the past three decades. Journal of Cleaner Production, 372: 133459, doi: 10.1016/j.jclepro.2022.133459.
[18]
Kaveh N, Ebrahimi A, Asadi E. 2023. Comparative analysis of random forest, exploratory regression, and structural equation modeling for screening key environmental variables in evaluating rangeland above-ground biomass. Ecological Informatics, 77: 102251, doi: 10.1016/j.ecoinf.2023.102251.
[19]
Lai X M, Liao K H, Zhu Q. 2025. Widespread vegetation regime shifts across China as indicated by critical soil moisture thresholds. Journal of Hydrology, 661: 133642, doi: 10.1016/j.jhydrol.2025.133642.
[20]
Li D, An L, Zhong S, et al. 2024a. Declining coupling between vegetation and drought over the past three decades. Global Change Biology, 30(1): e17141, doi: 10.1111/gcb.17141.
[21]
Li H, Hu Y F, Ao Z D. 2024b. Identification of critical drought thresholds affecting vegetation on the Mongolian Plateau. Ecological Indicators, 166: 112507, doi: 10.1016/j.ecolind.2024.112507.
[22]
Li H W, Wu Y P, Liu S G, et al. 2021. Regional contributions to interannual variability of net primary production and climatic attributions. Agricultural and Forest Meteorology, 303: 108384, doi: 10.1016/j.agrformet.2021.108384.
[23]
Li J, Zhang Y, Bevacqua E, et al. 2024c. Future increase in compound soil drought-heat extremes exacerbated by vegetation greening. Nature Communications, 15(1): 10875, doi: 10.1038/s41467-024-55175-0.
[24]
Li X Y, Piao S L, Huntingford C, et al. 2023. Global variations in critical drought thresholds that impact vegetation. National Science Review, 10(5): nwad049, doi: 10.1093/nsr/nwad049.
[25]
Liu J, Wei L H, Zheng Z P, et al. 2023. Vegetation cover change and its response to climate extremes in the Yellow River Basin. Science of The Total Environment, 905: 167366, doi: 10.1016/j.scitotenv.2023.167366.
[26]
Liu X Q, Feng Y H, Hu T Y, et al. 2024. Enhancing ecosystem productivity and stability with increasing canopy structural complexity in global forests. Science Advances, 10(20): eadl1947, doi: 10.1126/sciadv.adl1947.
[27]
Lu J T, Peng J, Li G Y, et al. 2023. Assessment of time-lag and cumulative effects of drought on gross primary productivity of grassland in Central Asia from 1982 to 2018. Acta Ecologica Sinica, 43(23): 9745-9757. (in Chinese)
[28]
Luo Q, Zhao C W, Luo G J, et al. 2025. Rural depopulation has reshaped the plant diversity distribution pattern in China. Resources, Conservation and Recycling, 215: 108054, doi: 10.1016/j.resconrec.2024.108054.
[29]
Ma M Y, Wang Q M, Liu R, et al. 2023. Effects of climate change and human activities on vegetation coverage change in northern China considering extreme climate and time-lag and -accumulation effects. Science of The Total Environment, 860: 160527, doi: 10.1016/j.scitotenv.2022.160527.
[30]
Ma Y R, Guan Q Y, Sun Y F, et al. 2022. Three-dimensional dynamic characteristics of vegetation and its response to climatic factors in the Qilian Mountains. CATENA, 208: 105694, doi: 10.1016/j.catena.2021.105694.
[31]
McCulloch M T, Winter A, Sherman C E, et al. 2024. 300 years of sclerosponge thermometry shows global warming has exceeded 1.5°C. Nature Climate Change, 14(2): FEB2024, doi: 10.1038/s41558-023-01919-7.
[32]
Neinavaz E, Schlerf M, Darvishzadeh R, et al. 2021. Thermal infrared remote sensing of vegetation: current status and perspectives. International Journal of Applied Earth Observation and Geoinformation, 102: 102415, doi: 10.1016/j.jag.2021.102415.
[33]
Peng J, Tian L, Liu Y X, et al. 2017. Ecosystem services response to urbanization in metropolitan areas: thresholds identification. Science of The Total Environment, 607-608: 706-714.
doi: 10.1016/j.scitotenv.2017.06.218
[34]
Pettorelli N, Vik J O, Mysterud A, et al. 2005. Using the satellite-derived NDVI to assess ecological responses to environmental change. Trends in Ecology & Evolution, 20(9): 503-510.
doi: 10.1016/j.tree.2005.05.011
[35]
Ren Z G, Tian Z H, Wei H T, et al. 2022. Spatiotemporal evolution and driving mechanisms of vegetation in the Yellow River Basin, China during 2000-2020. Ecological Indicators, 138: 108832, doi: 10.1016/j.ecolind.2022.108832.
[36]
Ren Z K, Zhao H R, Mu X Z, et al. 2024. Spatiotemporal variations of extreme weather events and climate drivers in the Three Gorges Reservoir Area and its surrounding regions from 1960 to 2020. Atmospheric Research, 304: 107379, doi: 10.1016/j.atmosres.2024.107379.
[37]
Sen P K. 1968. Estimates of the regression coefficient based on Kendall's Tau. Journal of the American Statistical Association, 63(324): 1379-1389.
doi: 10.1080/01621459.1968.10480934
[38]
Shi S Y, Wang P, Zhang Y C, et al. 2021. Cumulative and time-lag effects of the main climate factors on natural vegetation across Siberia. Ecological Indicators, 133: 108446, doi: 10.1016/j.ecolind.2021.108446.
[39]
Shrestha A B, Bajracharya S R, Sharma A R, et al. 2017. Observed trends and changes in daily temperature and precipitation extremes over the Koshi River Basin 1975-2010. International Journal of Climatology, 37(2): 1066-1083.
doi: 10.1002/joc.2017.37.issue-2
[40]
Sun M Z, Li X Y, Xu H, et al. 2024. Drought thresholds that impact vegetation reveal the divergent responses of vegetation growth to drought across China. Global Change Biology, 30(1): e16998, doi: 10.1111/gcb.16998.
[41]
Tang W X, Liu S G, Kang P, et al. 2021. Quantifying the lagged effects of climate factors on vegetation growth in 32 major cities of China. Ecological Indicators, 132: 108290, doi: 10.1016/j.ecolind.2021.108290.
[42]
Wang M Y, Chen Y B, Li J Y, et al. 2025. Spatiotemporal evolution and driving force analysis of drought characteristics in the Yellow River Basin. Ecological Indicators, 170: 113007, doi: 10.1016/j.ecolind.2024.113007.
[43]
Wang Y X, Peng L, Yue Y M, et al. 2024. Global vegetation-temperature sensitivity and its driving forces in the 21st century. Earth's Future, 12(2): e2022EF003395, doi: 10.1016/j.ecolind.2024.112893.
[44]
Wu D H, Zhao X, Liang S L, et al. 2015. Time-lag effects of global vegetation responses to climate change. Global Change Biology, 21(9): 3520-3531.
doi: 10.1111/gcb.12945
pmid: 25858027
[45]
Wu X T, Yan Z H, Yang H Y, et al. 2025. Ecological restoration in the Yellow River Basin enhances hydropower potential. Nature Communications, 16(1): 2566, doi: 10.1038/s41467-025-57891-7.
[46]
Wu Y J, Mu H L, Wu S Y, et al. 2023. Changes in mean and extreme homogeneous precipitation in China during 1960-2020. Atmospheric Research, 292: 106891, doi: 10.1016/j.atmosres.2023.106891.
[47]
Xu W F, Yuan W P, Wu D H, et al. 2024. Impacts of record-breaking compound heatwave and drought events in 2022 China on vegetation growth. Agricultural and Forest Meteorology, 344: 109799, doi: 10.1016/j.agrformet.2023.109799.
[48]
Yang H, Munson S M, Huntingford C, et al. 2023a. The detection and attribution of extreme reductions in vegetation growth across the global land surface. Global Change Biology, 29(8): 2351-2362.
doi: 10.1111/gcb.v29.8
[49]
Yang J T, Yang K, Zhang F M, et al. 2023b. Contributions of natural and anthropogenic factors to historical changes in vegetation cover and its future projections in the Yellow River Basin, China. International Journal of Climatology, 43(14): 6434-6449.
doi: 10.1002/joc.v43.14
[50]
Yao T D, Bolch T, Chen D, et al. 2022. The imbalance of the Asian water tower. Nature Reviews Earth & Environment, 3: 618-632.
[51]
Yi K X, Zhang J J, Lei H Y, et al. 2025. Response of ecological condition in ecologically fragile areas to disturbance from extreme precipitation event: an empirical analysis from the Loess Plateau. Journal of Cleaner Production, 512: 145701, doi: 10.1016/j.jclepro.2025.145701.
[52]
Yu Q, Xu C, Wu H H, et al. 2025. Contrasting drought sensitivity of Eurasian and North American grasslands. Nature, 639: 114-118.
doi: 10.1038/s41586-024-08478-7
[53]
Zhang L, Jia X, Zhao Y H, et al. 2025a. Lagged and cumulative effects of drought on global vegetation greenness, coverage, and productivity. Environmental Impact Assessment Review, 115: 108019, doi: 10.1016/j.eiar.2025.108019.
[54]
Zhang R, Zhao X Y, Li G, et al. 2025b. Review on responses of grassland plant-soil to precipitation and management measures in arid and semi-arid areas of China. Journal of Desert Research, 45(1): 131-140. (in Chinese)
[55]
Zhao A Z, Yu Q Y, Feng L L, et al. 2020. Evaluating the cumulative and time-lag effects of drought on grassland vegetation: a case study in the Chinese Loess Plateau. Journal of Environmental Management, 261: 110214, doi: 10.1016/j.jenvman.2020.110214.
[56]
Zhou S L, Wang F Y, Lü R T, et al. 2025. Response of vegetation to extreme climate in the Yellow River Basin: spatiotemporal patterns, lag effects, and scenario differences. Remote Sensing, 17(24): 3967, doi: 10.3390/rs17243967.