| Research article |
|


|
|
|
| Dynamic vegetation change response to topography based on Landsat observations in the Tianshan Mountains, China during 2000-2022 |
WEN Di1,2, LI Jun1,2,3,*( ), XU Weifeng1,2, CHEN Zhixiang1,2, PENG Dailiang4 ), XU Weifeng1,2, CHEN Zhixiang1,2, PENG Dailiang4 |
1College of Geography and Tourism, Chongqing Normal University, Chongqing 401331, China
2Key Laboratory of GIS Application of Chongqing, Chongqing 401331, China
3Chongqing Key Laboratory of Earth Surface Processes and Environmental Remote Sensing in Three Gorges Reservoir area, Chongqing 401331, China
4Key Laboratory of Digital Earth Science, Aerospace Information Research Institute, Chinese Academy of Sciences, Beijing 100094, China |
|
|
|
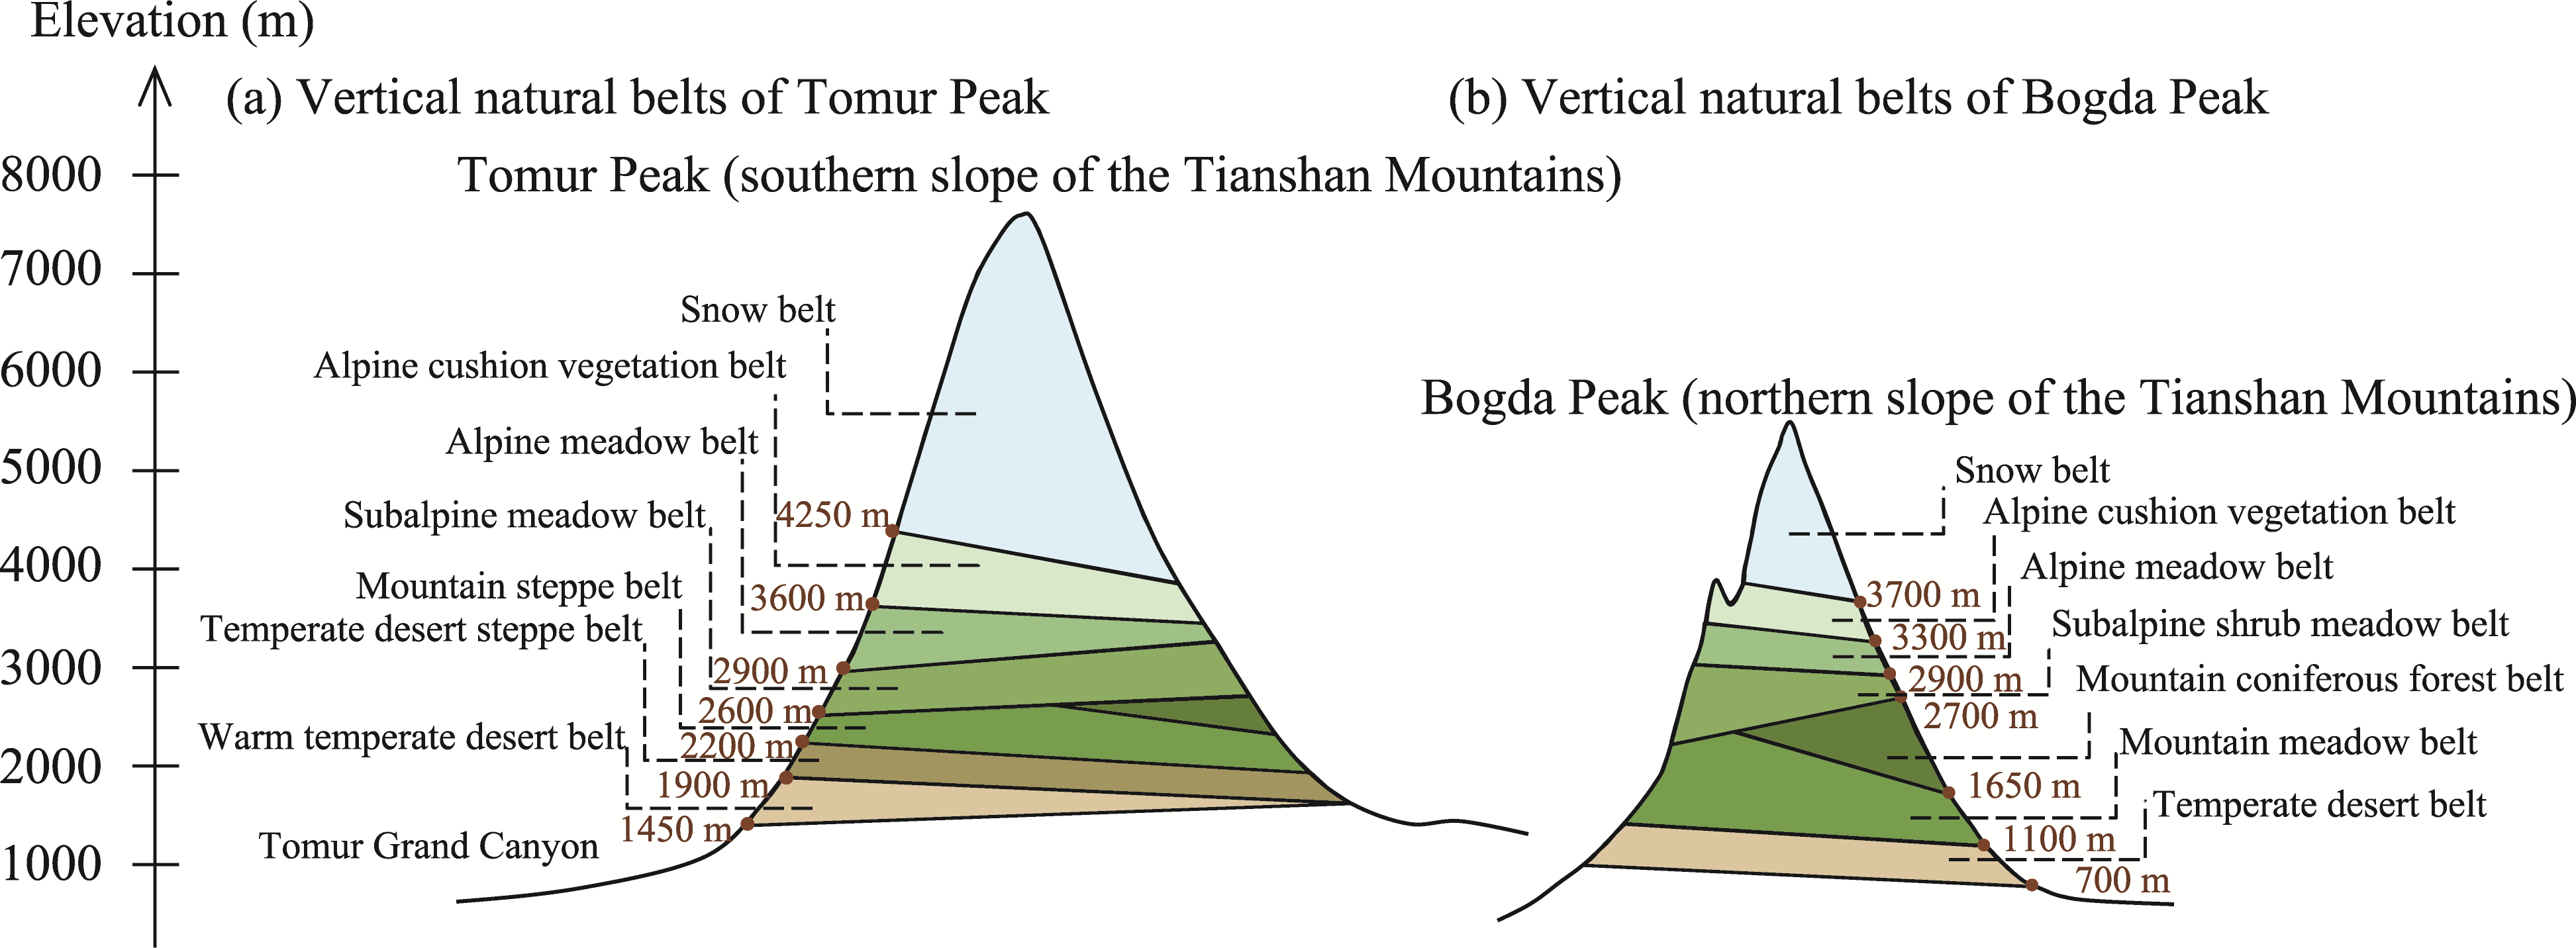
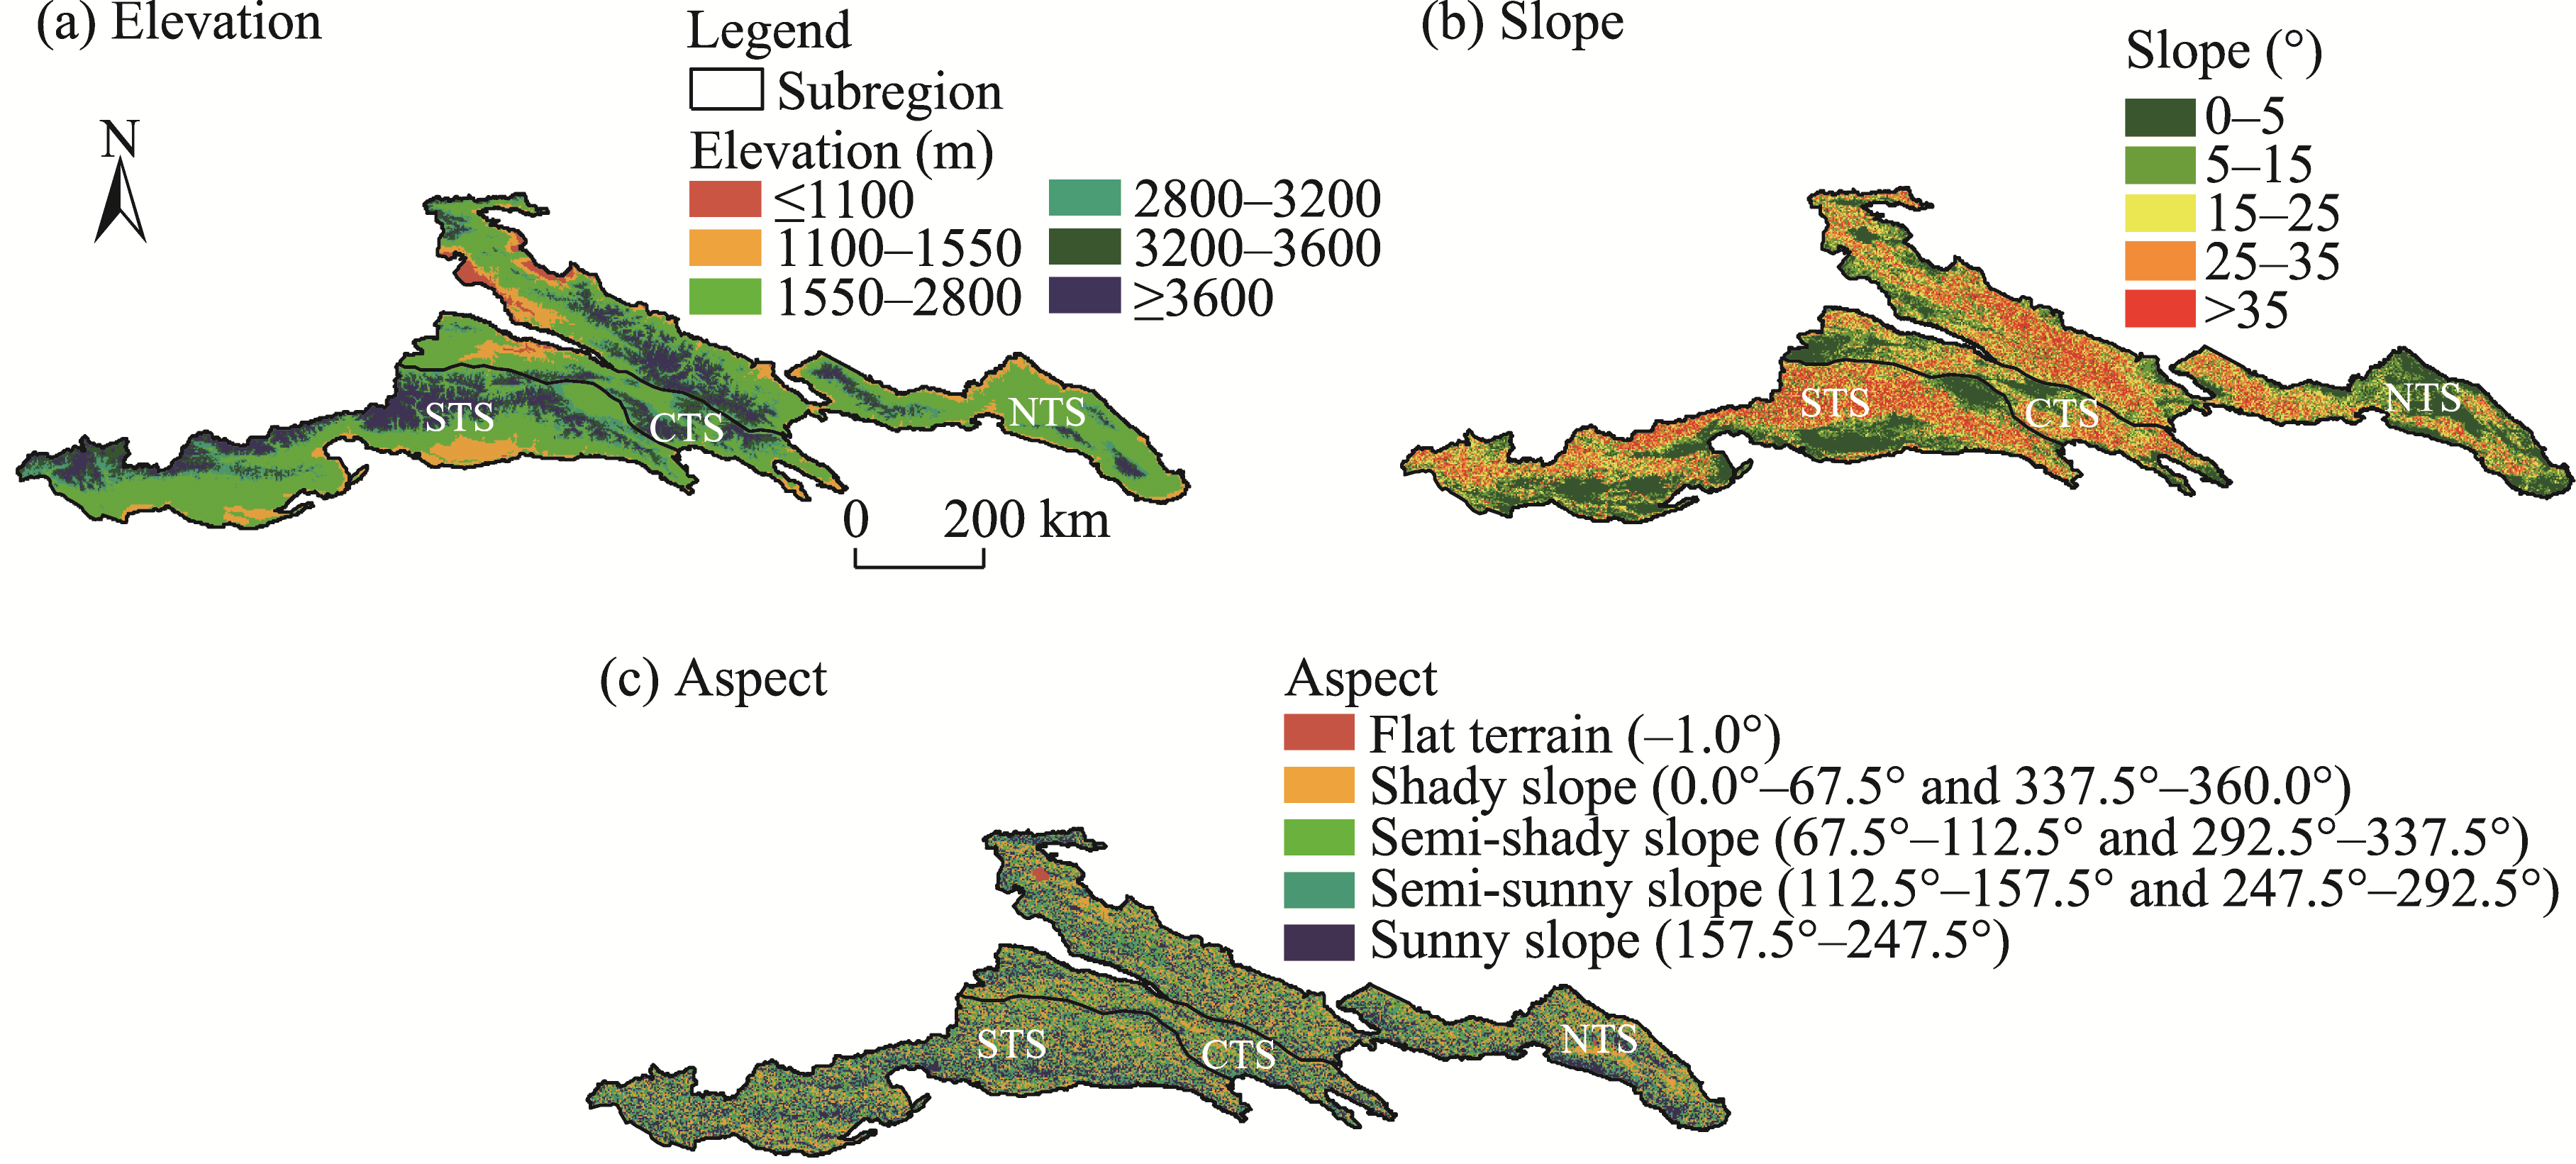
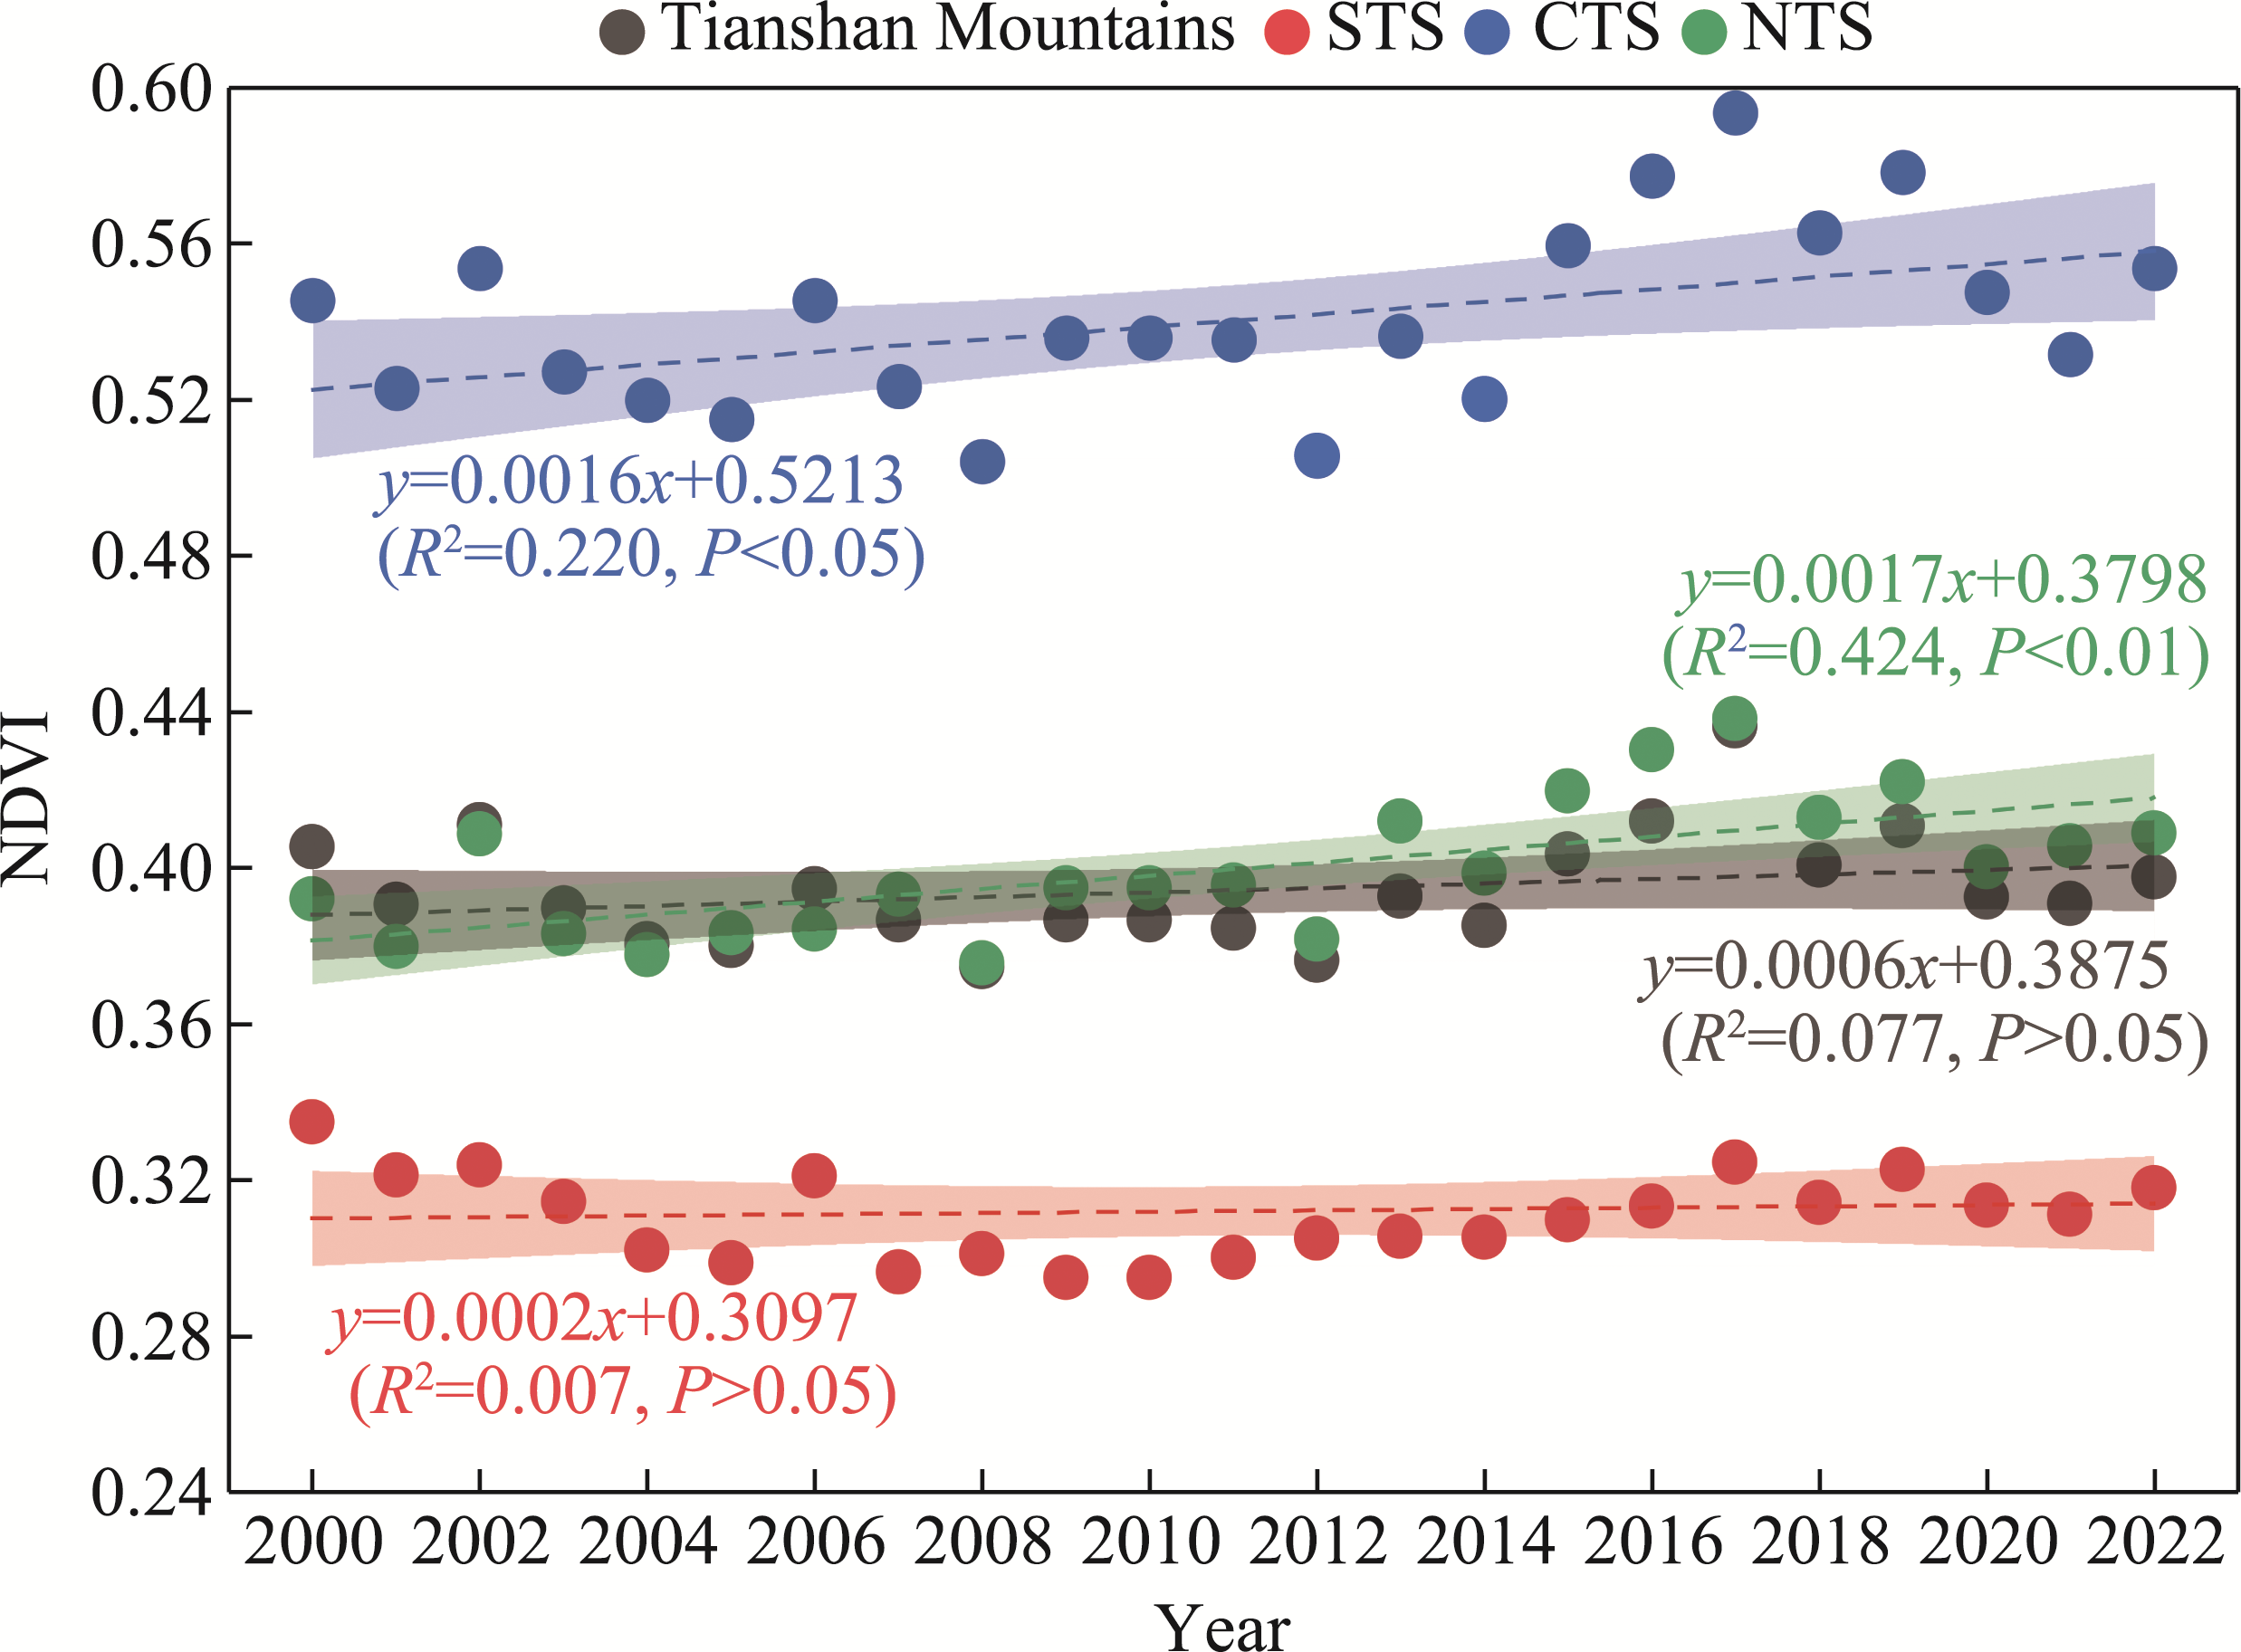
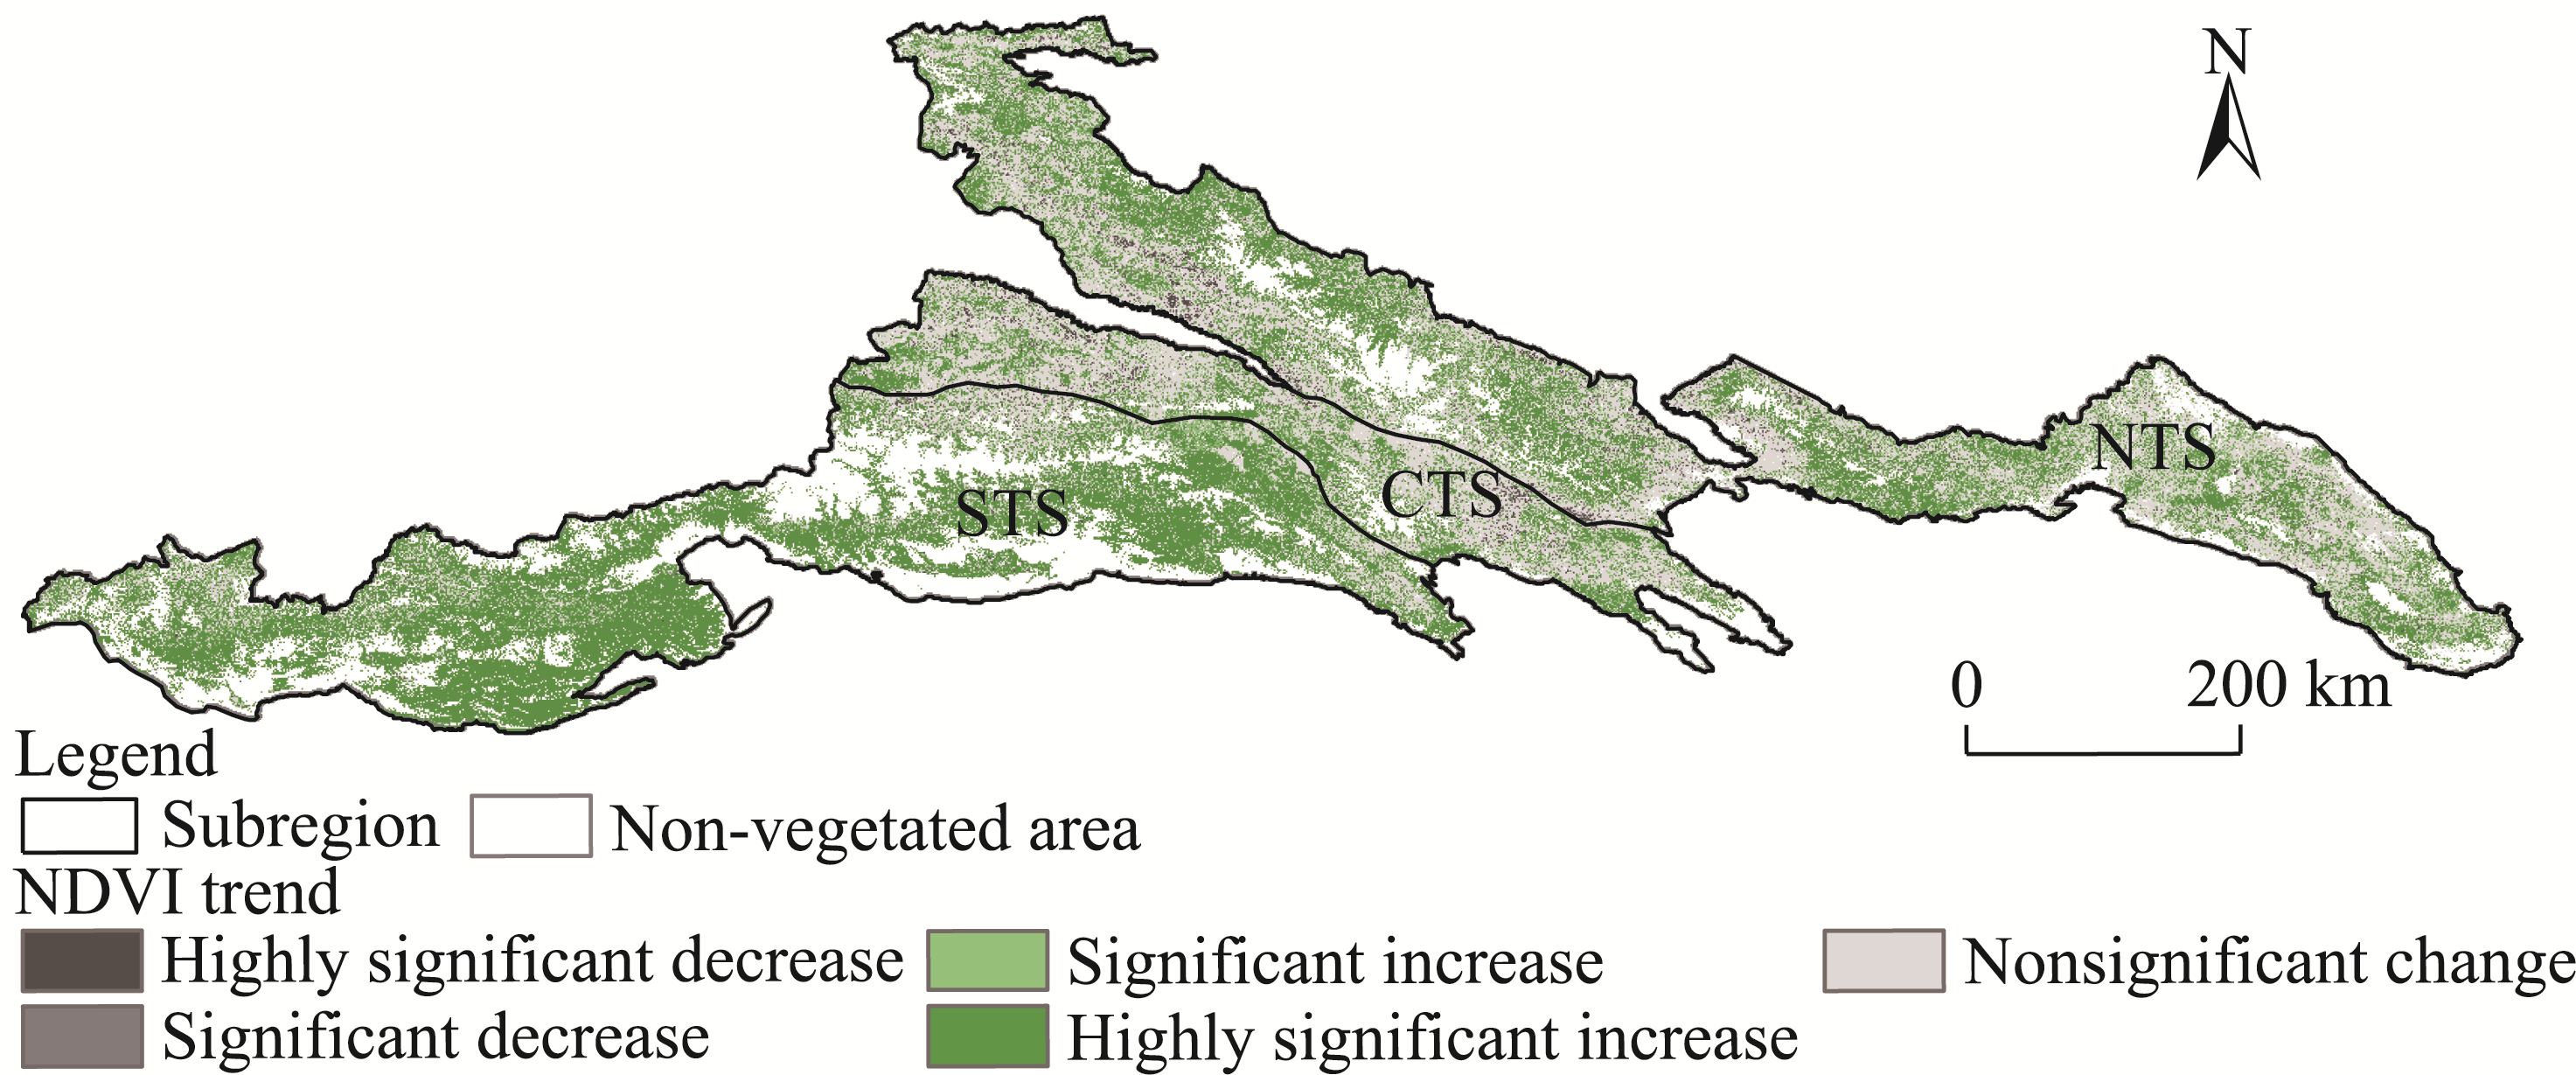
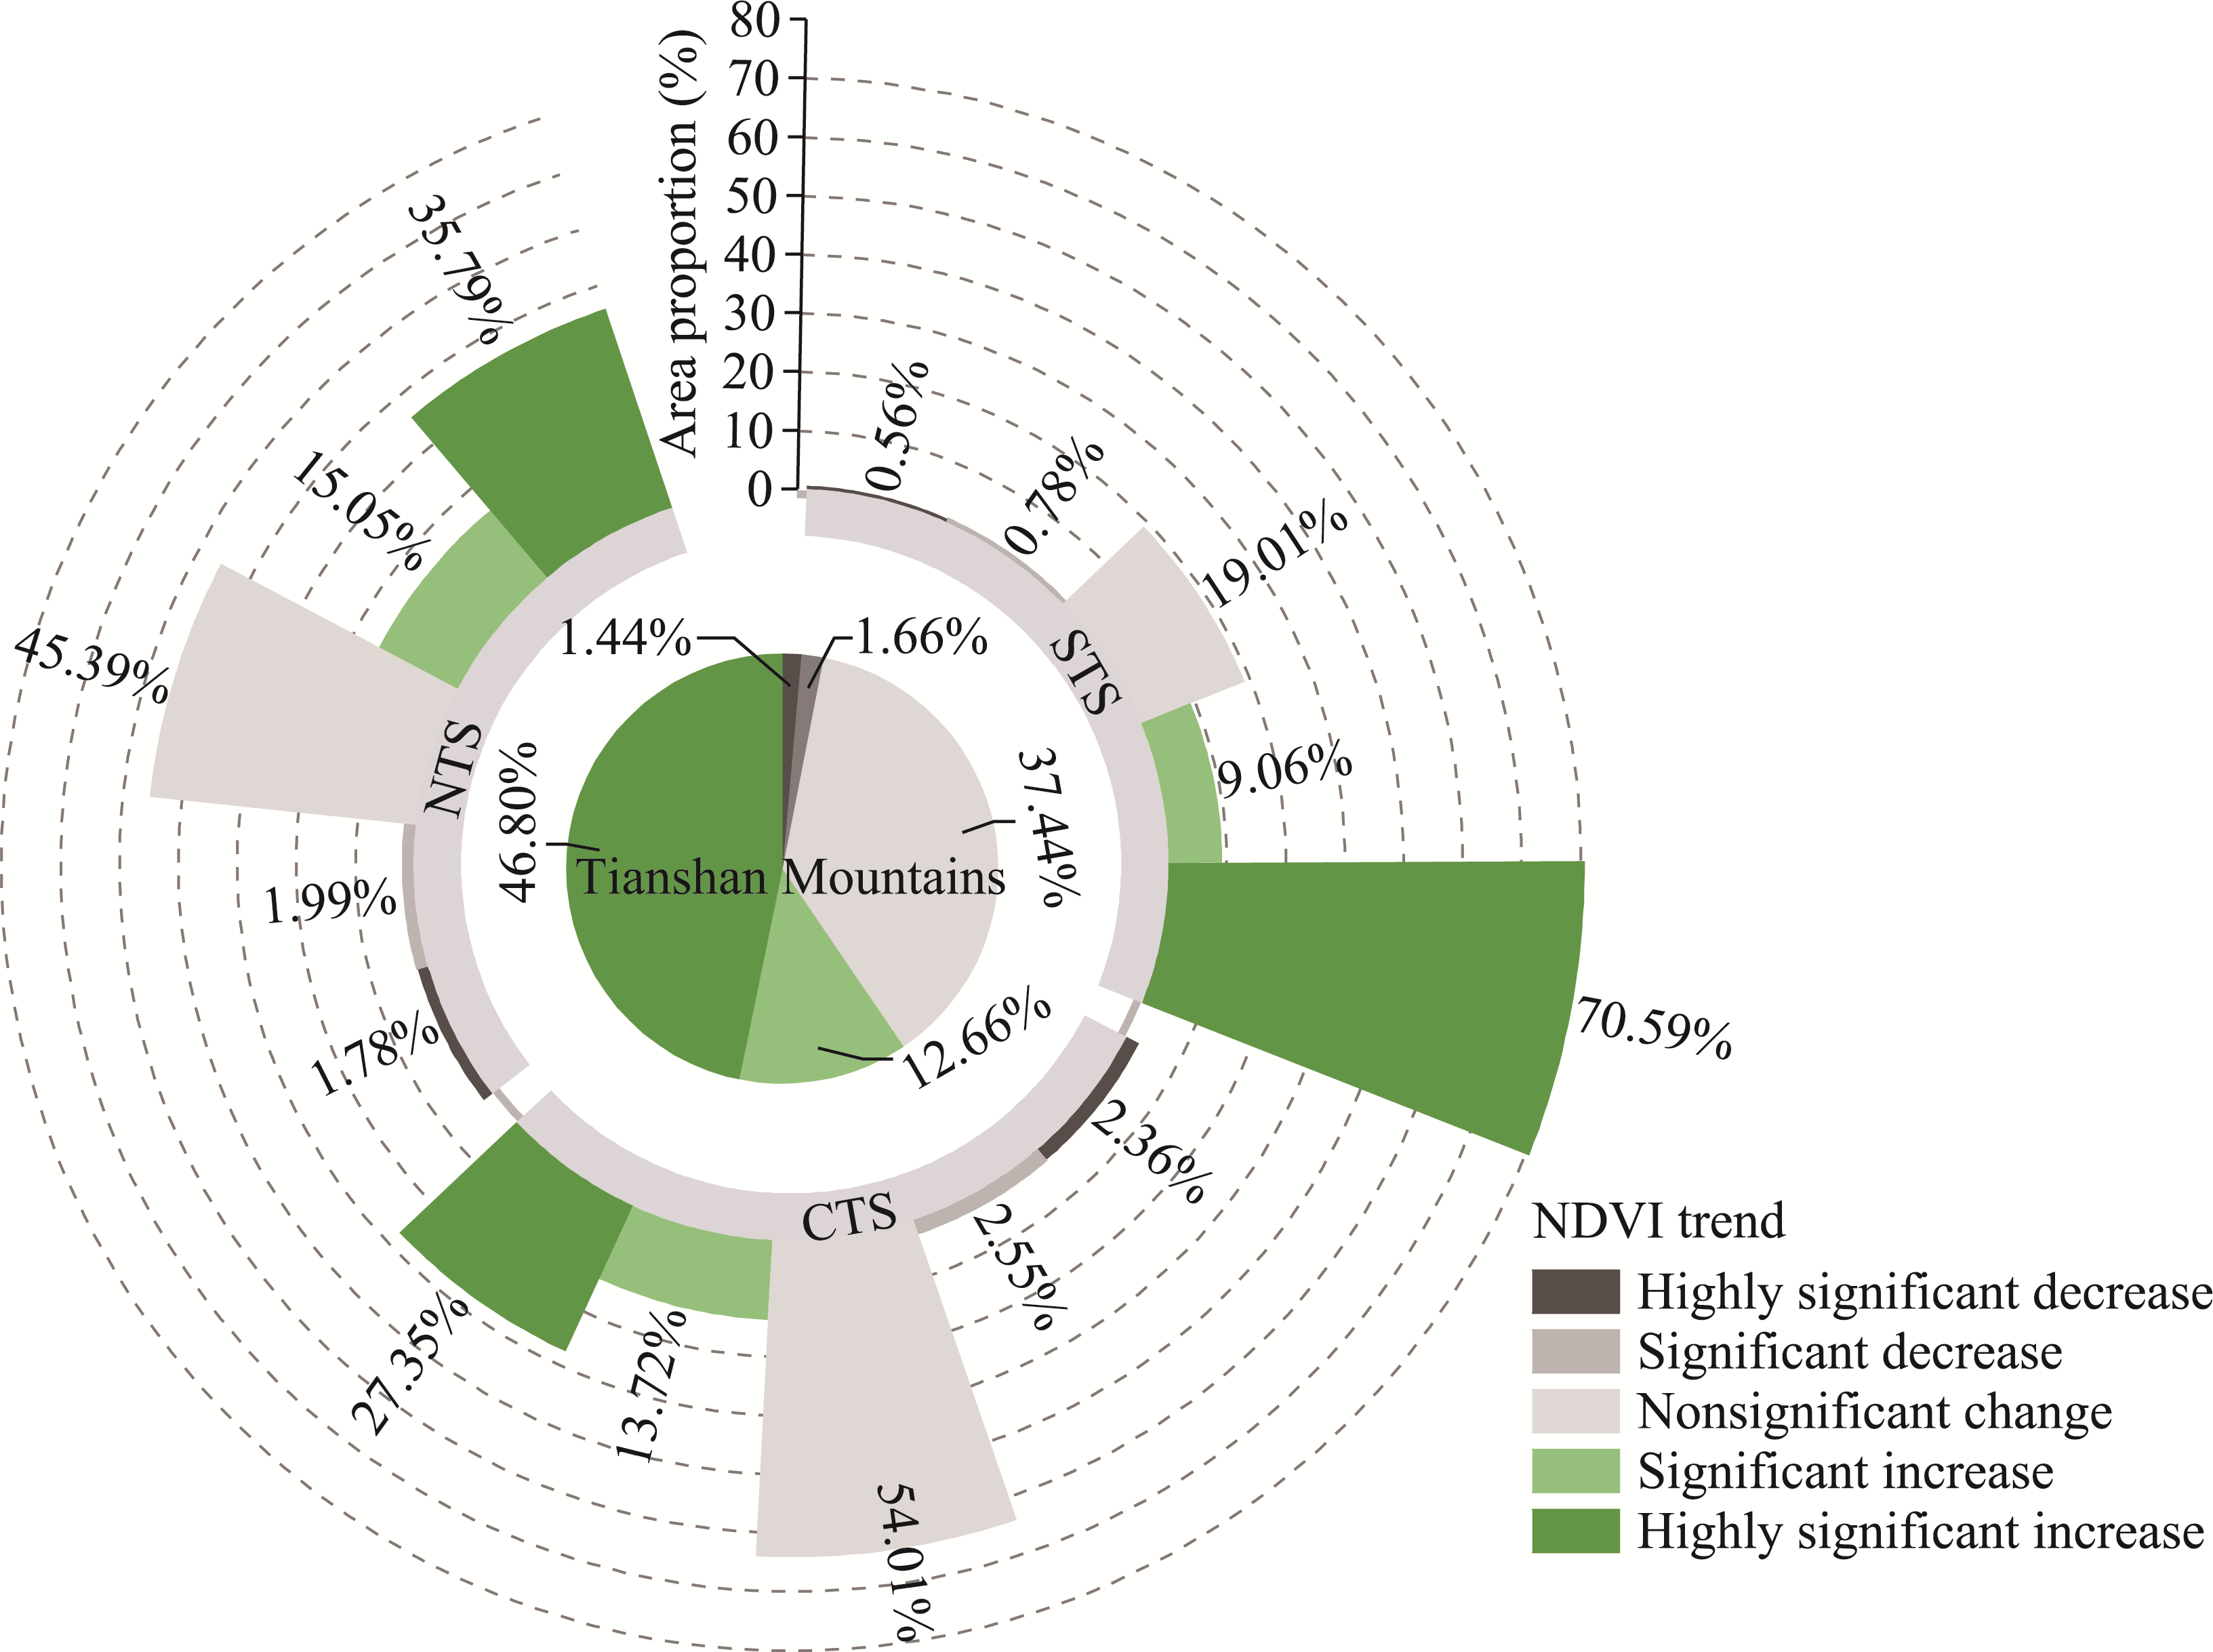
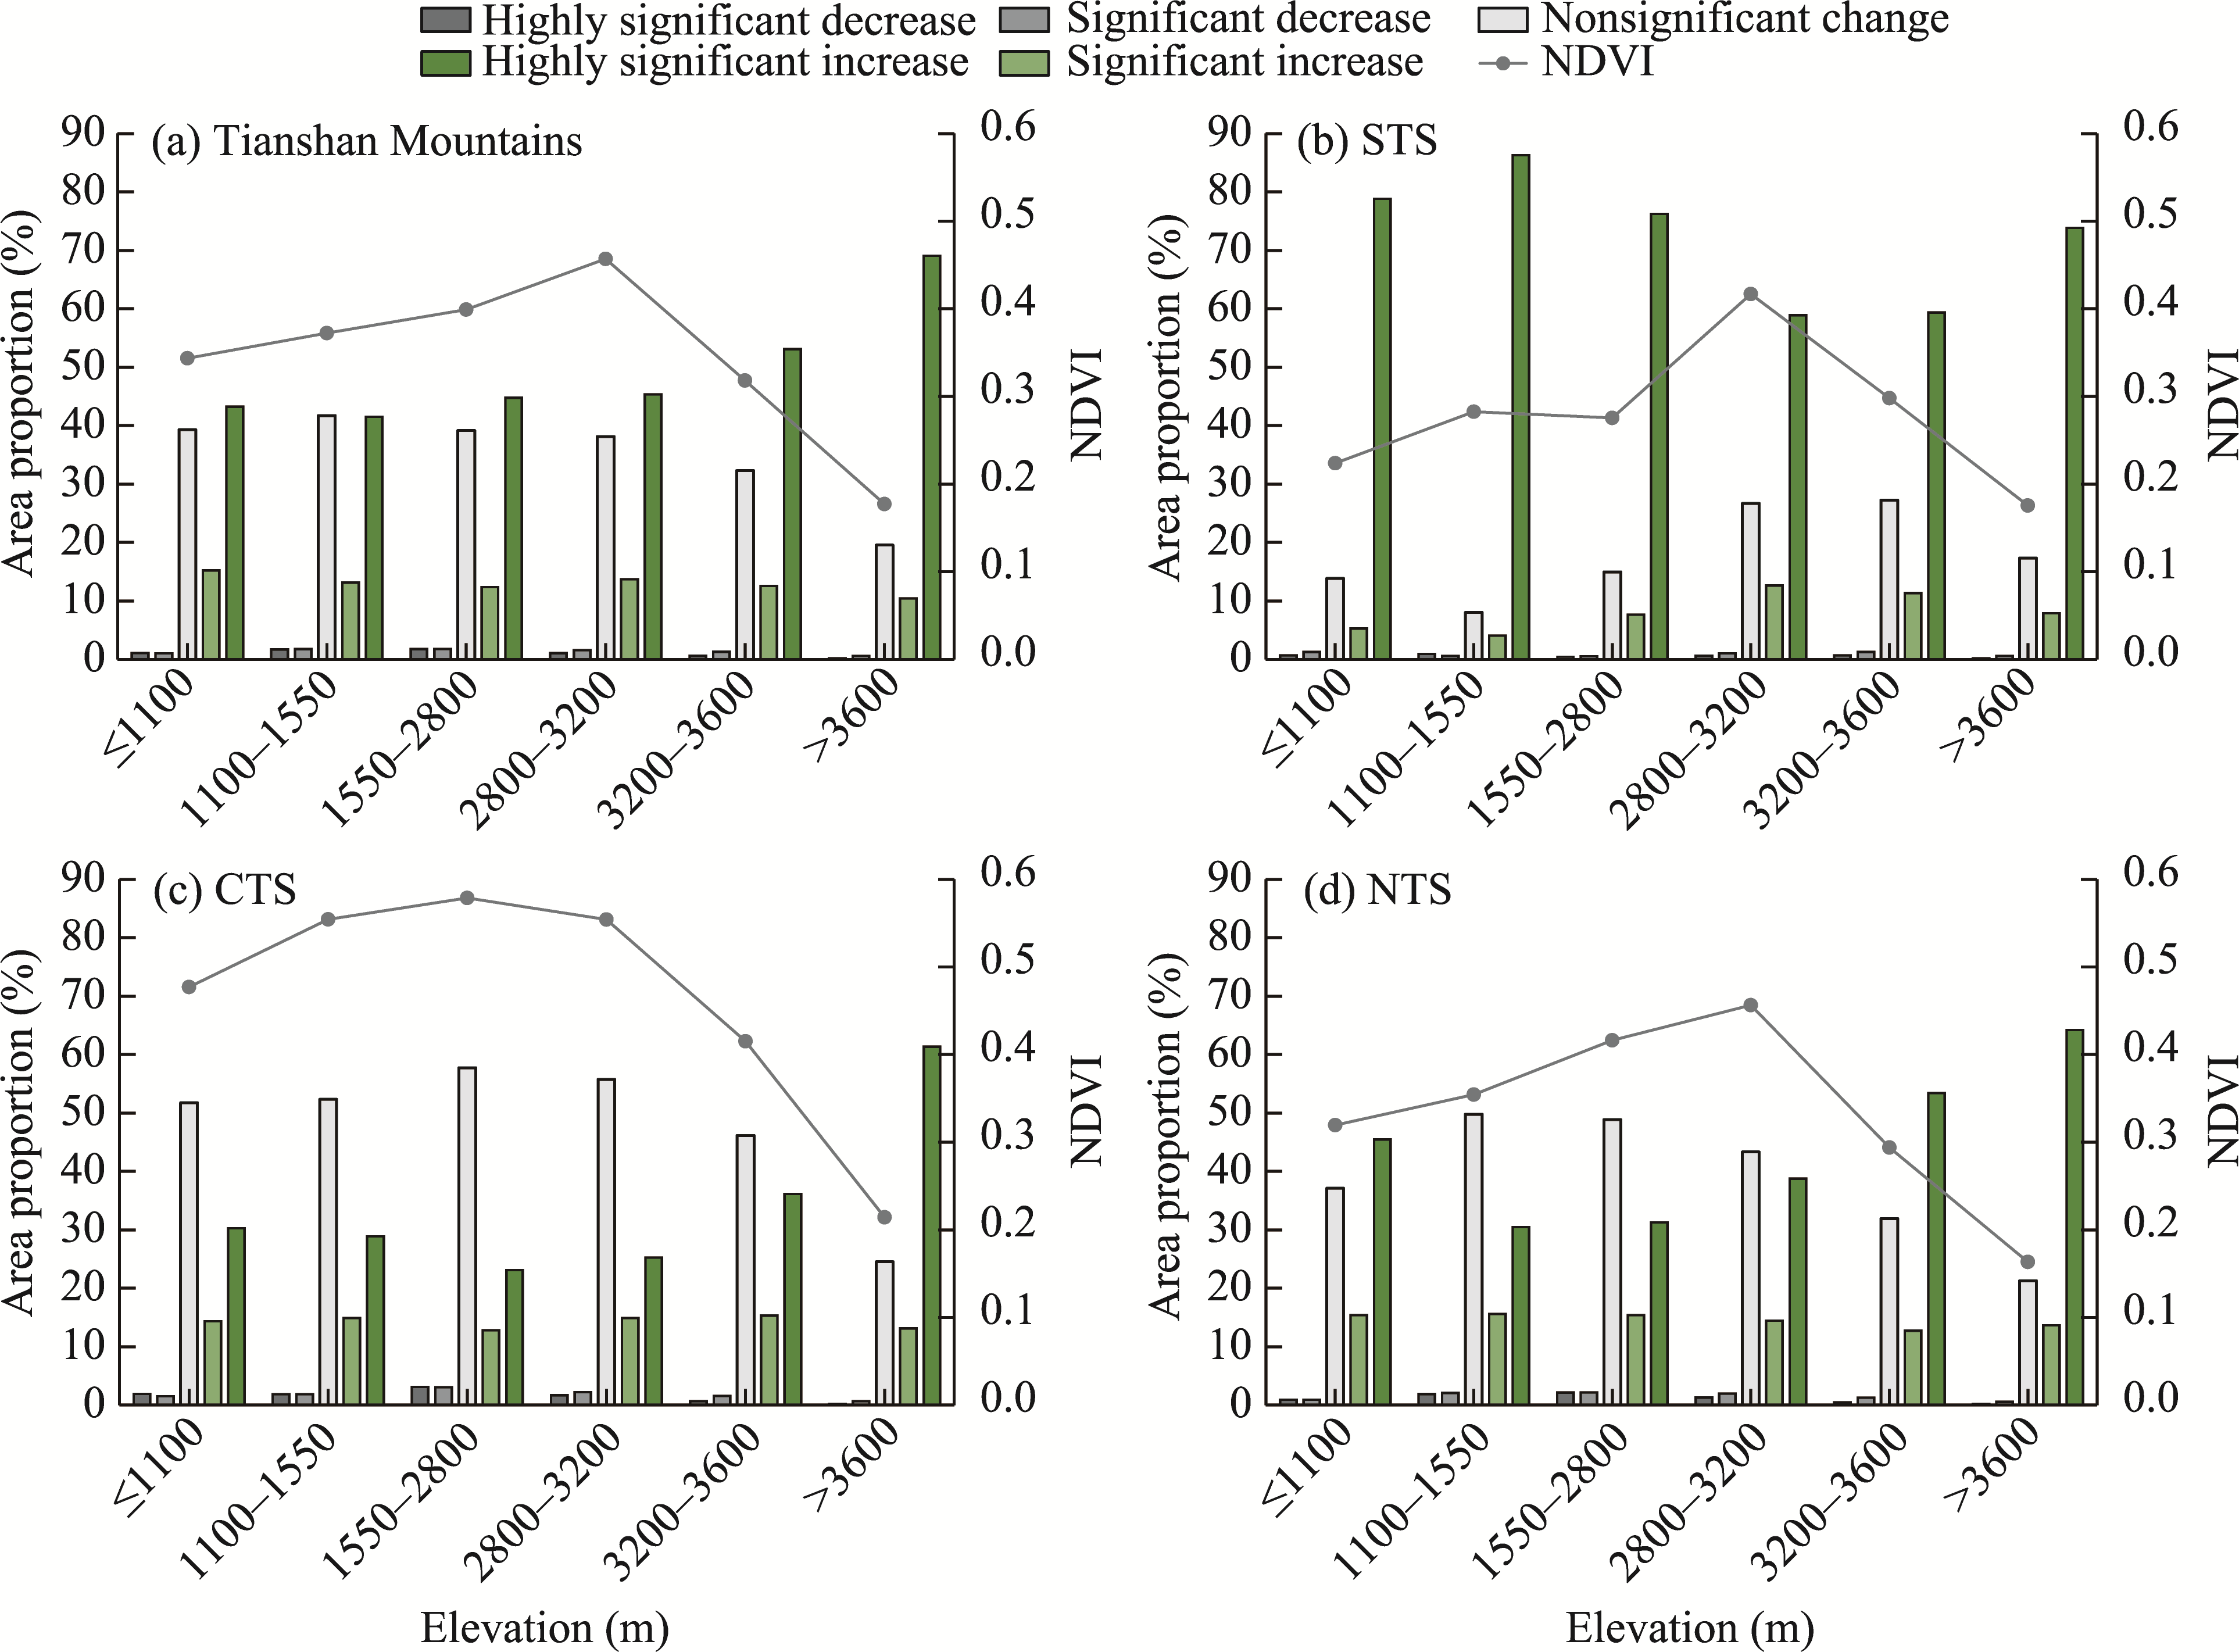
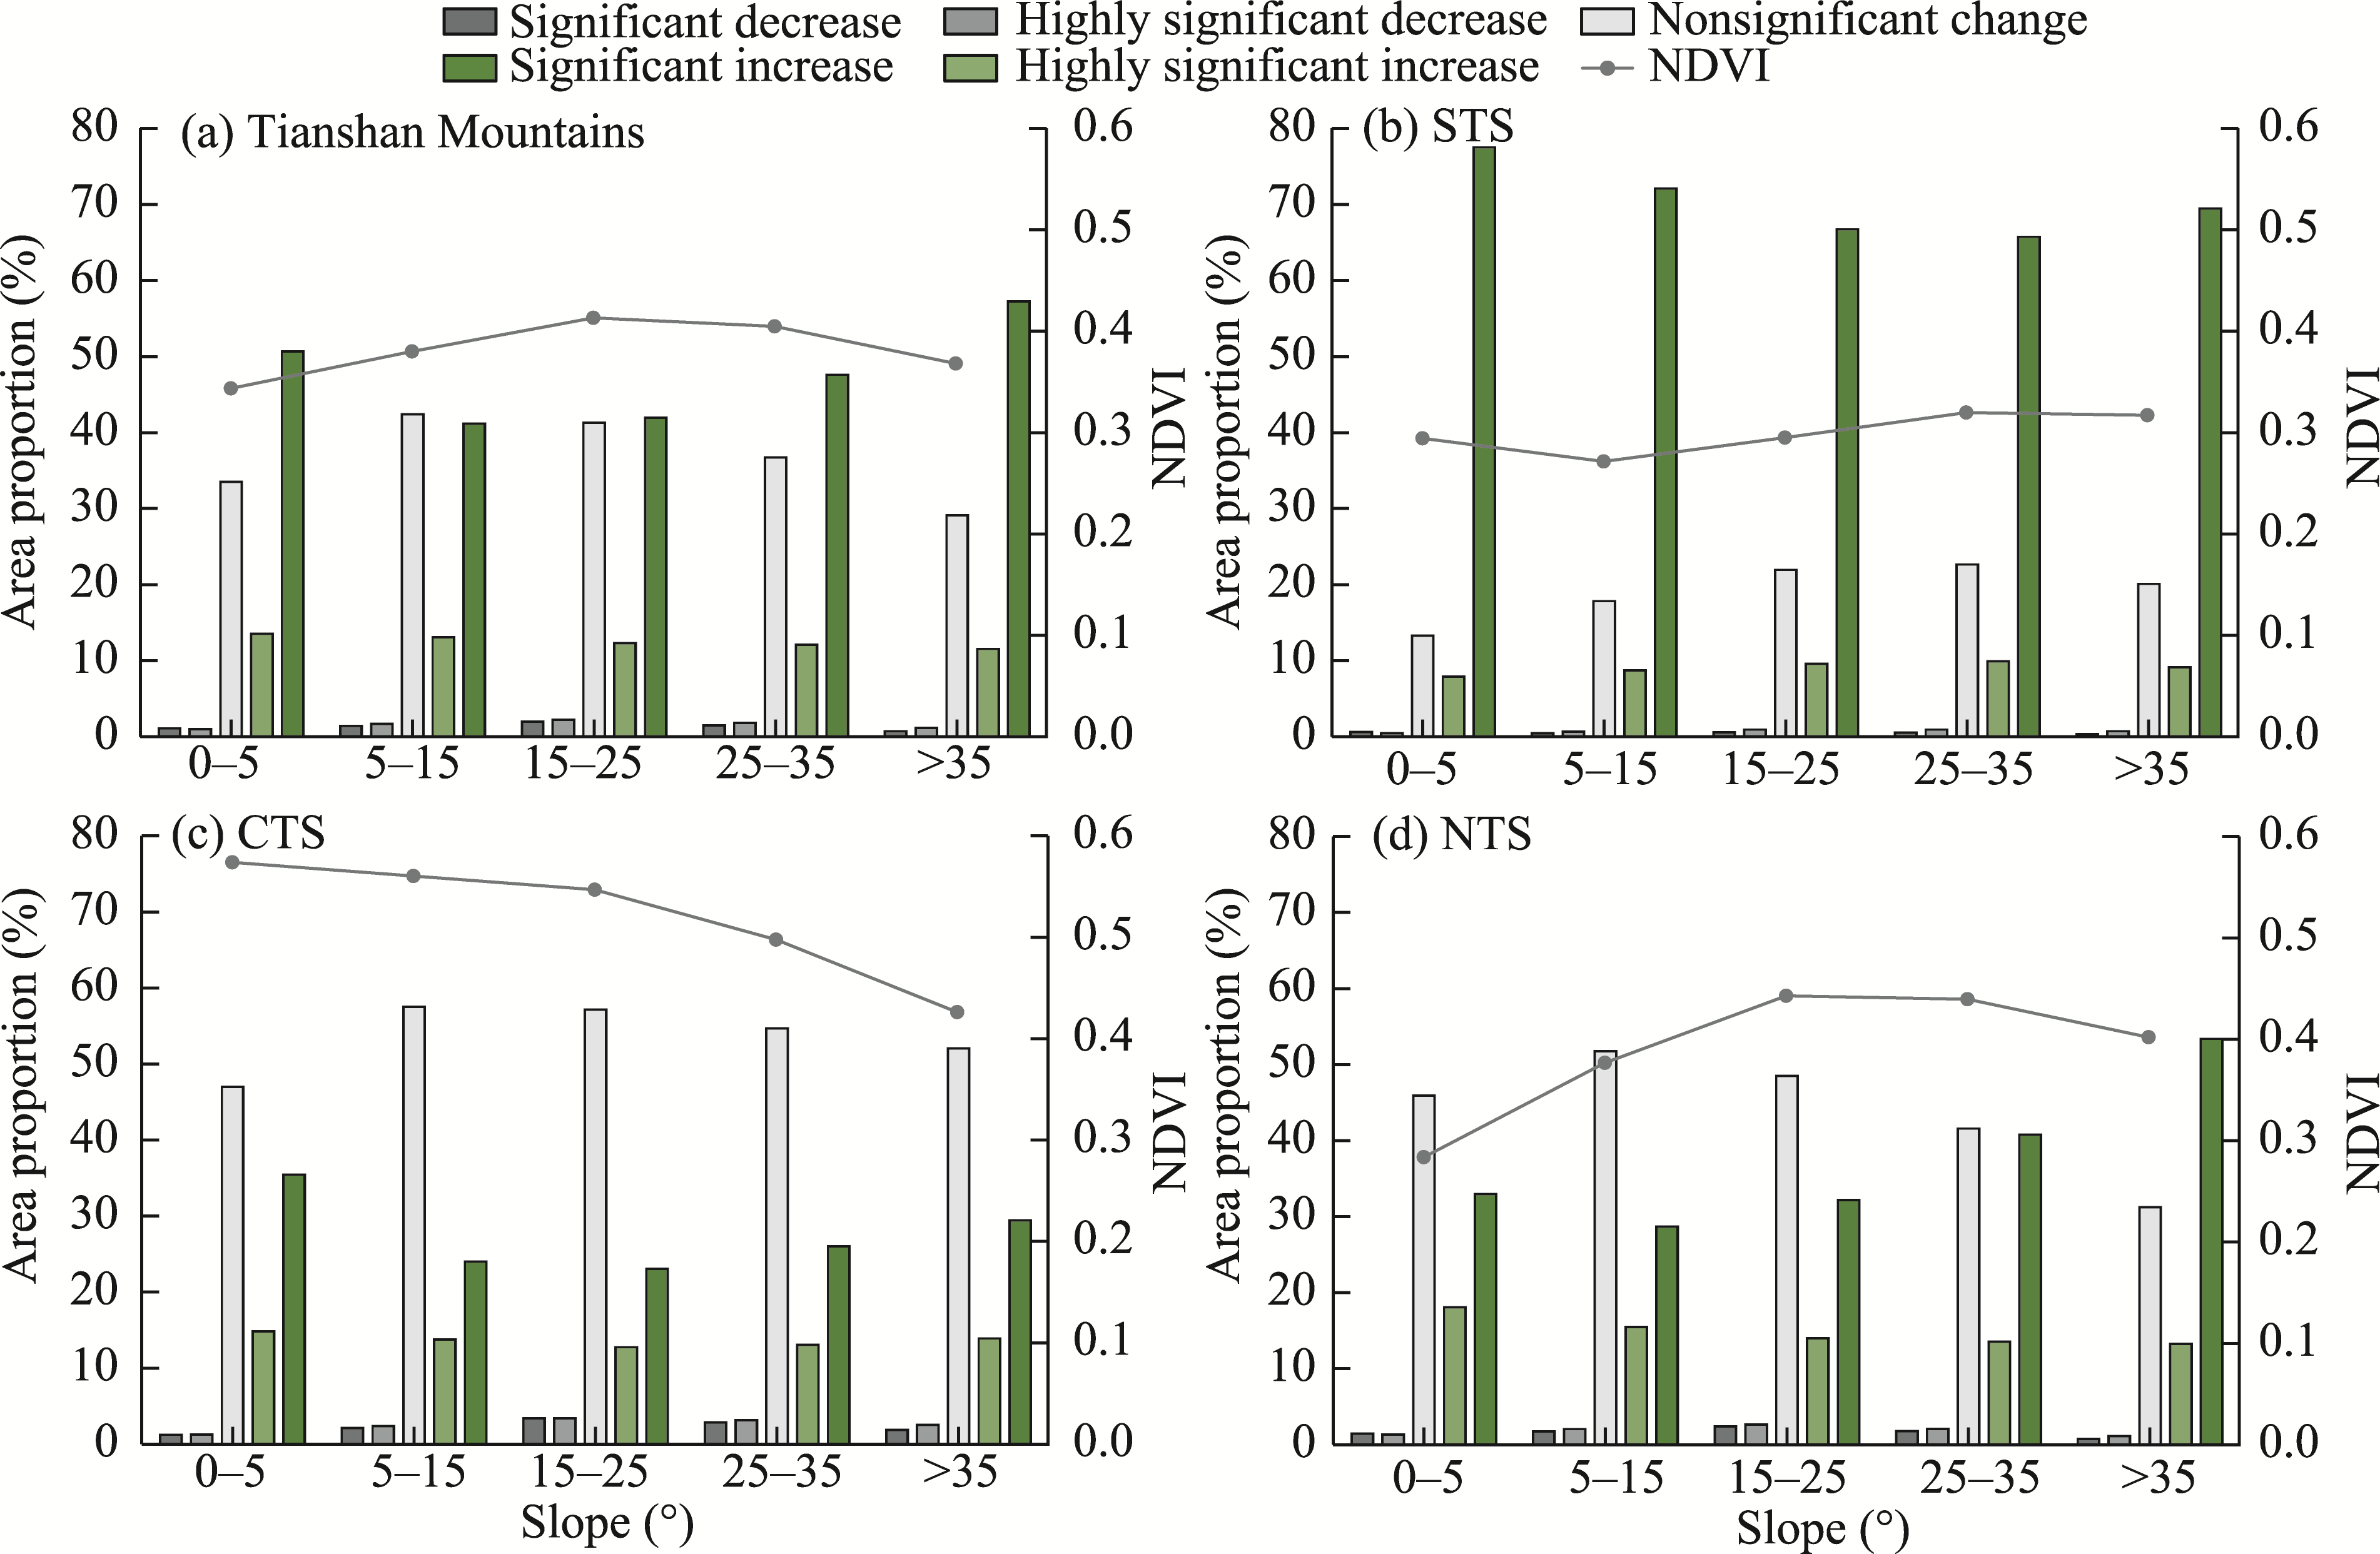
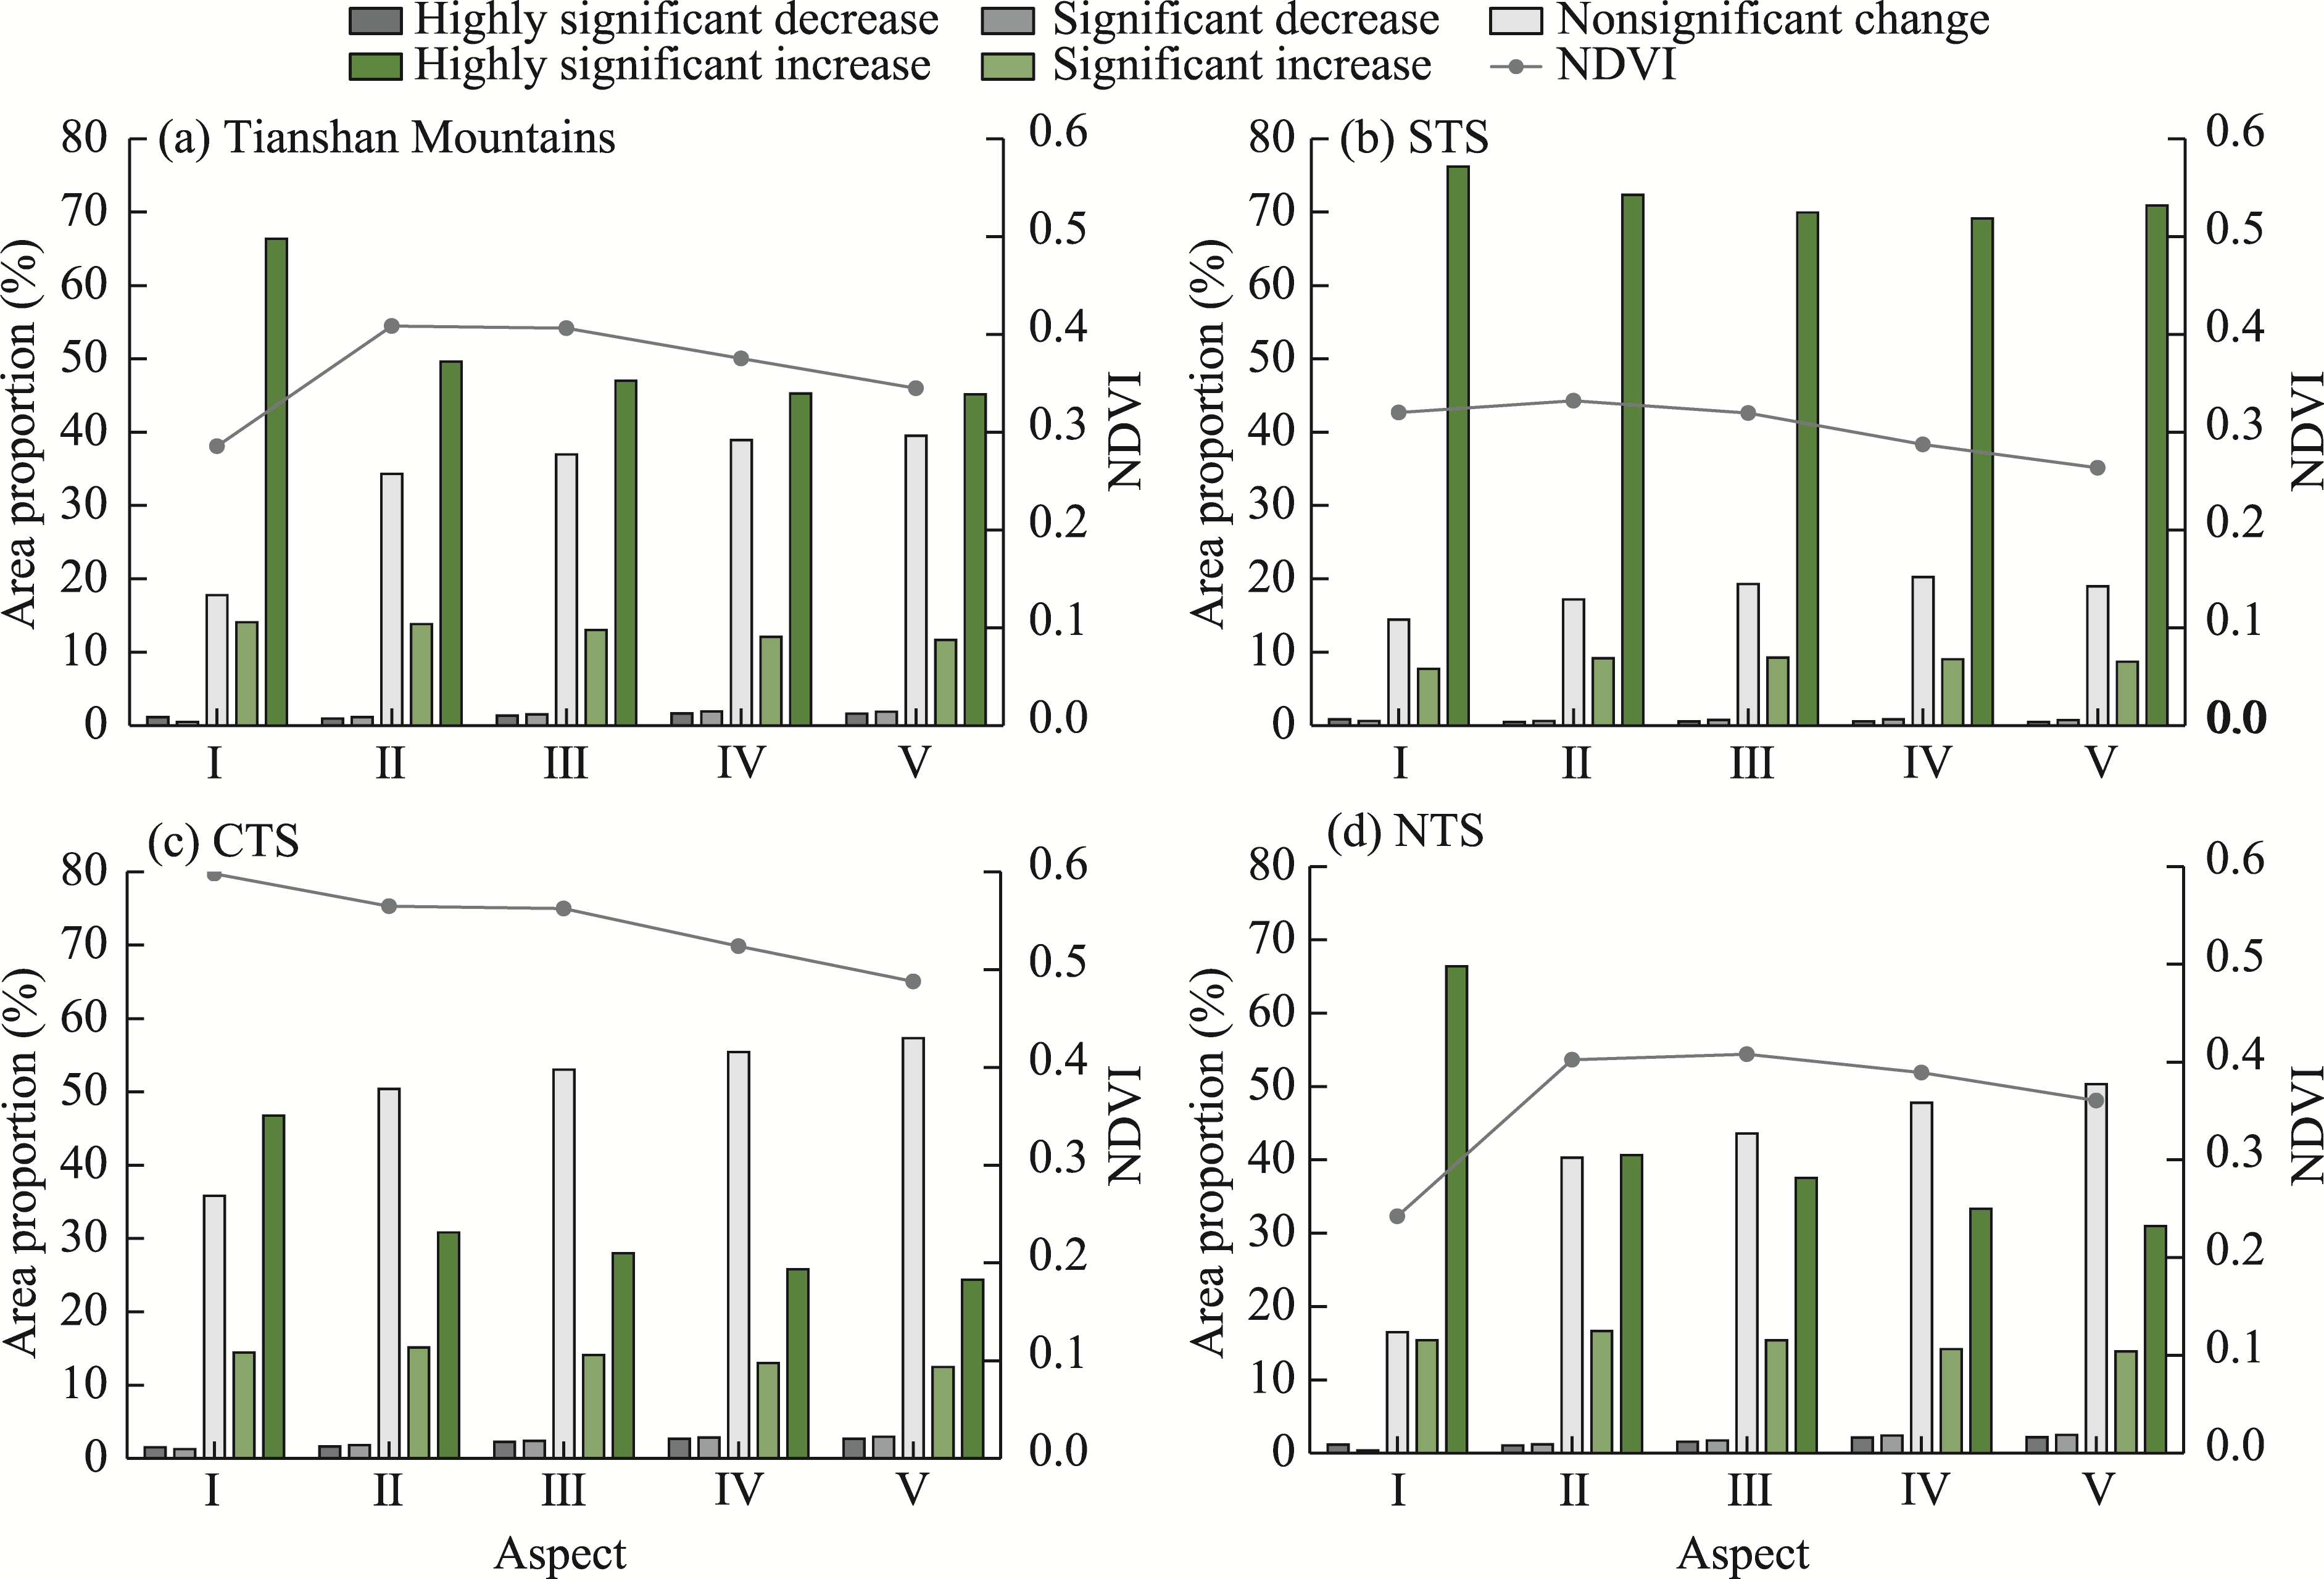
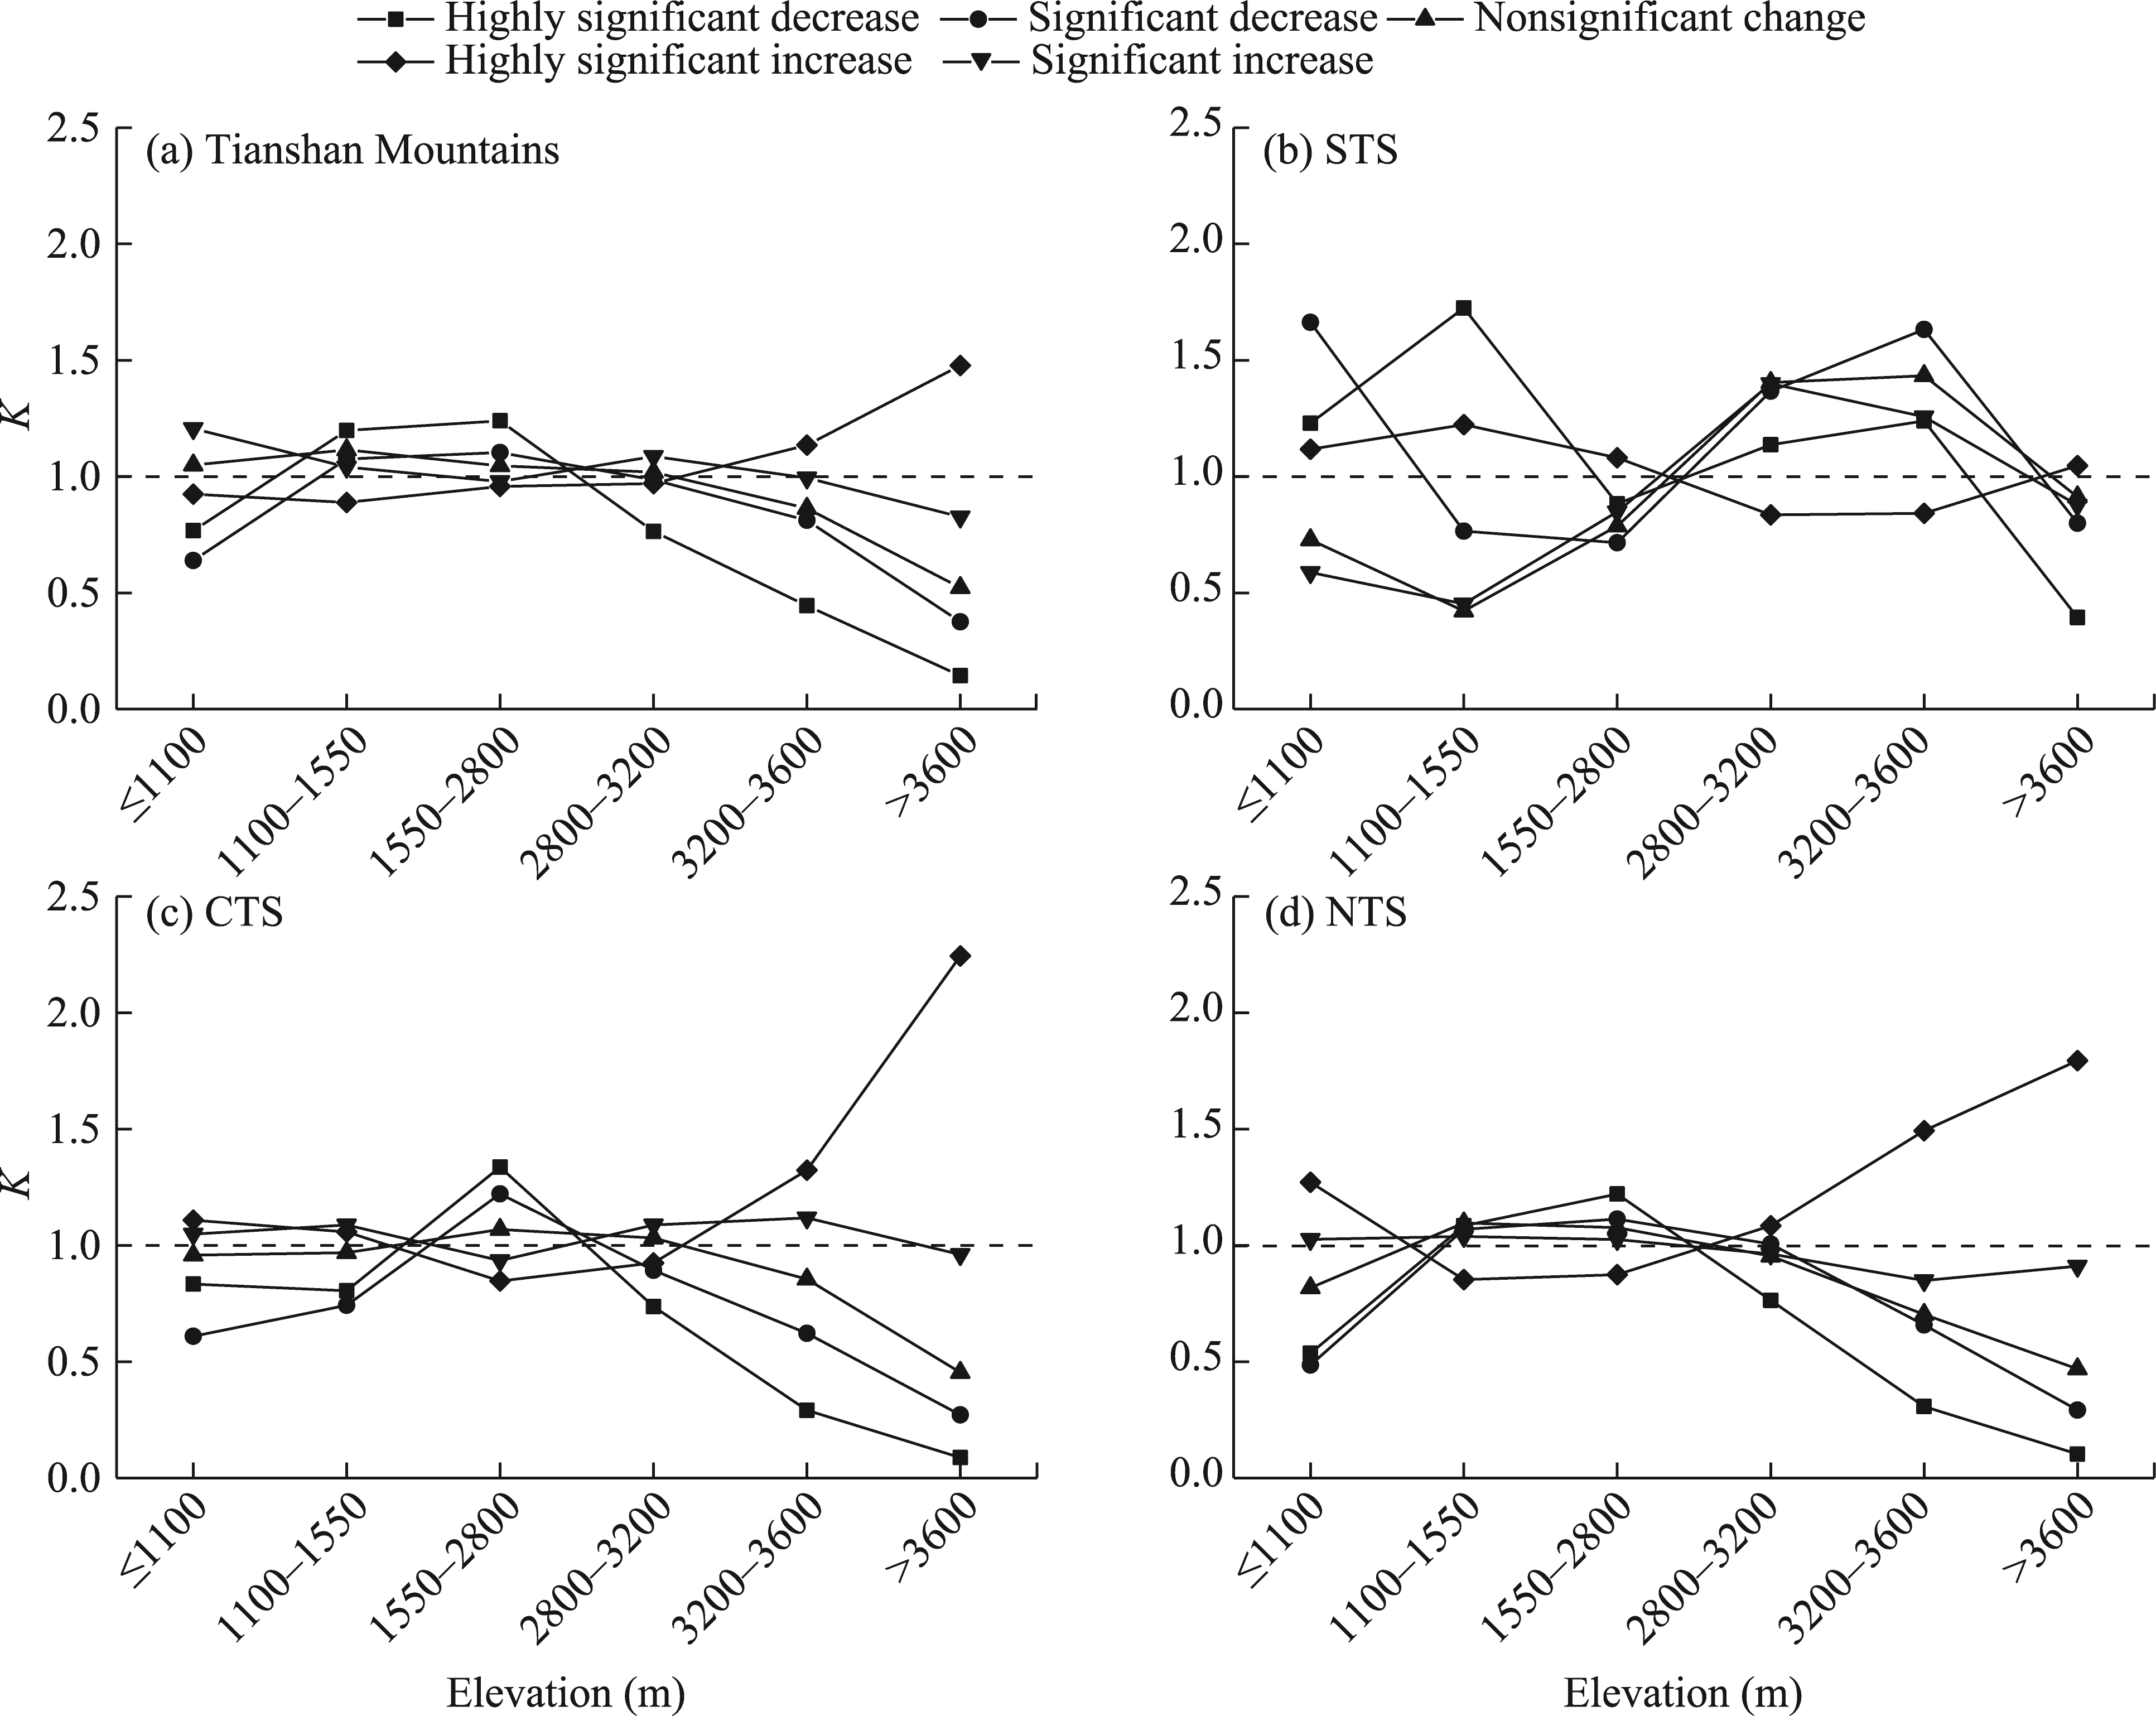
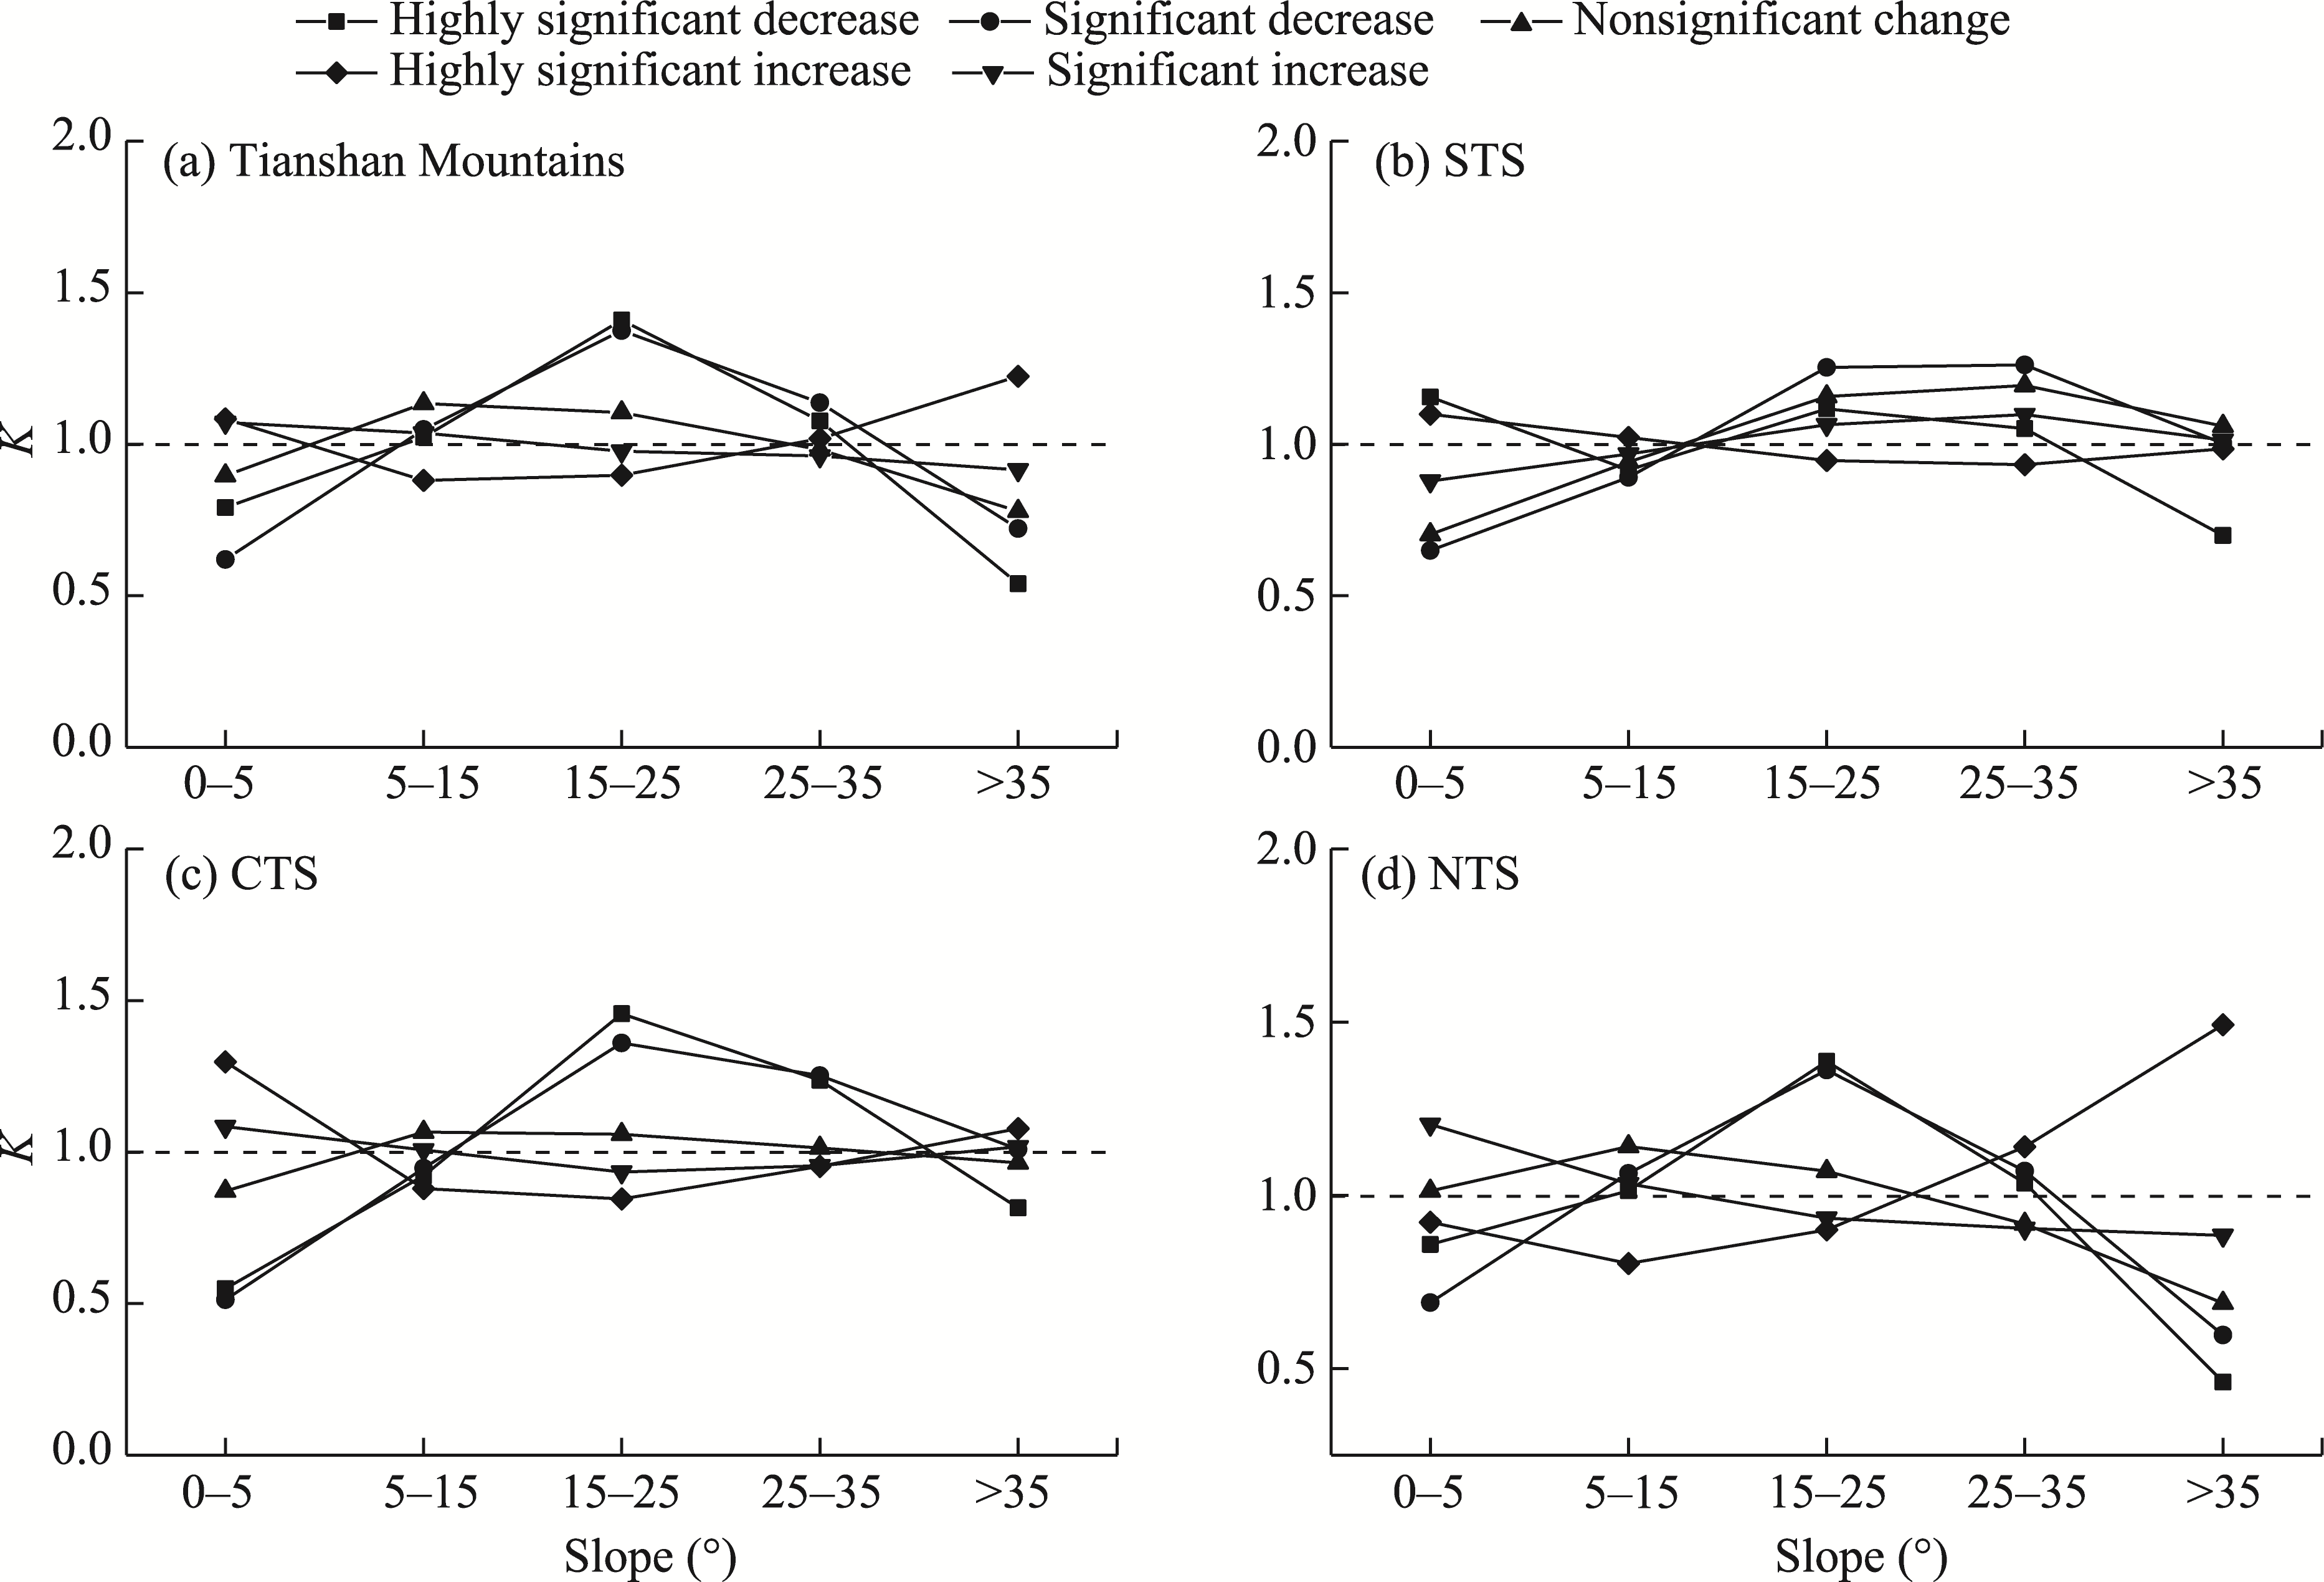
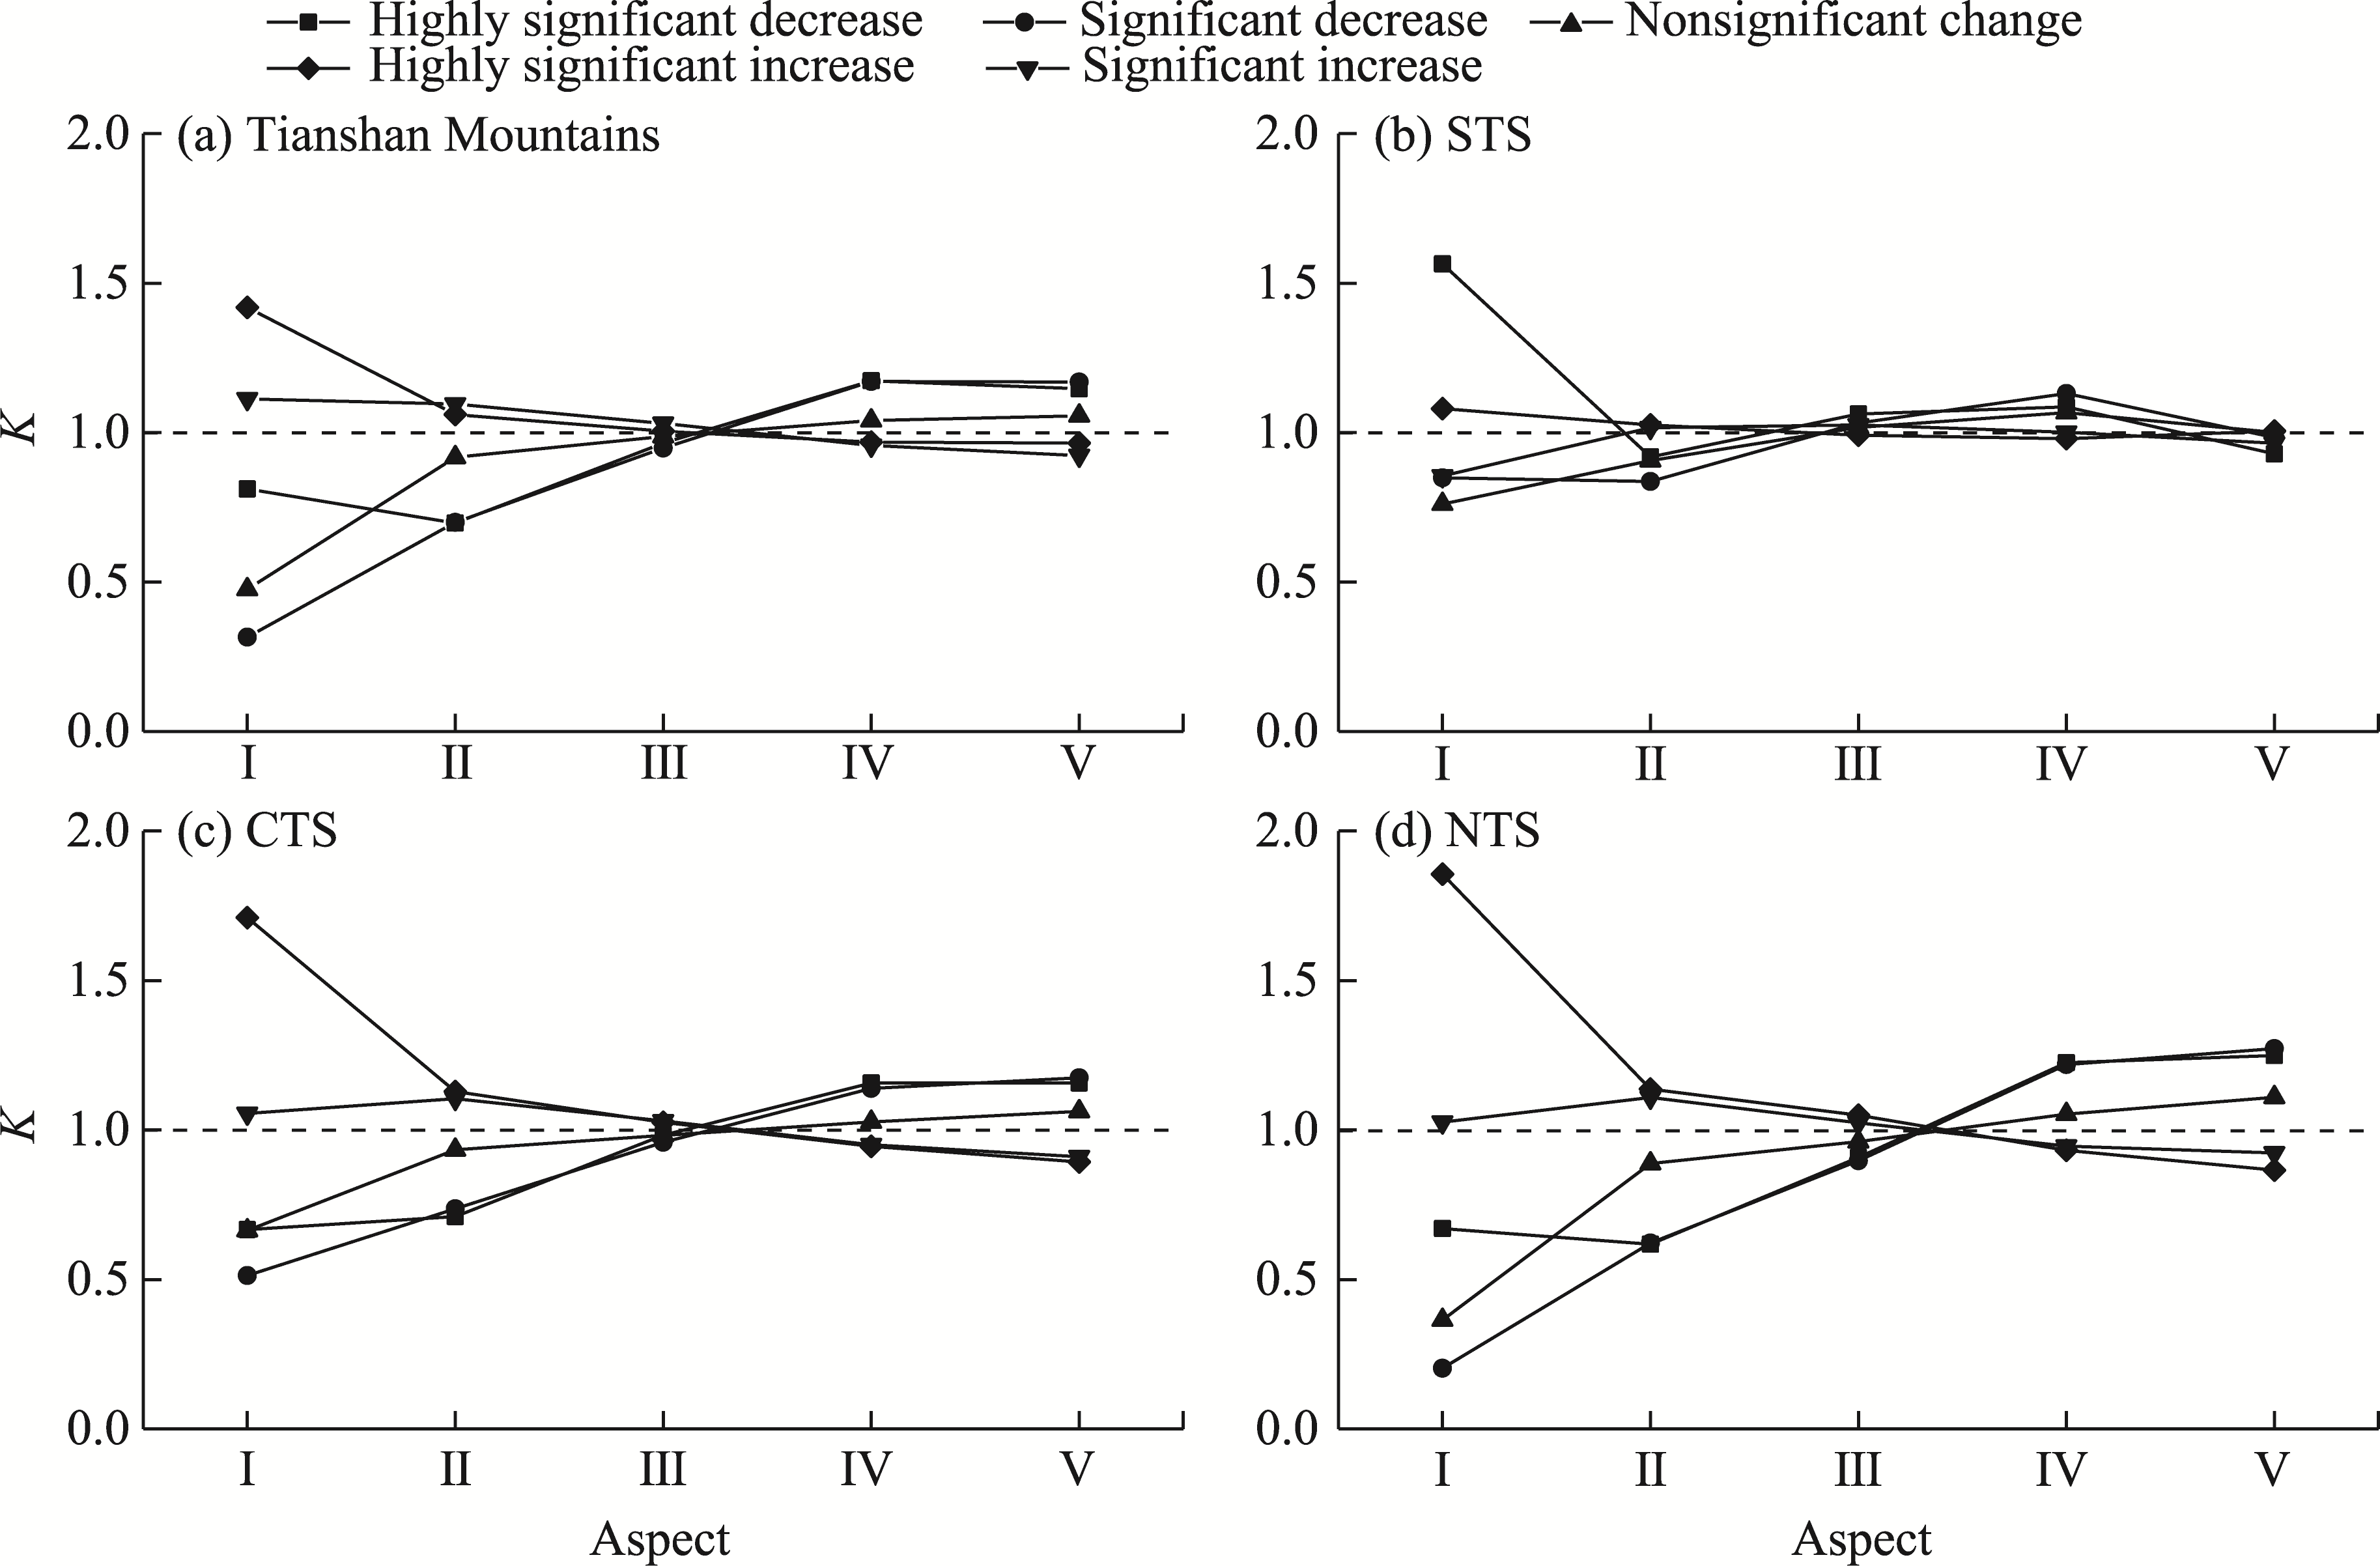
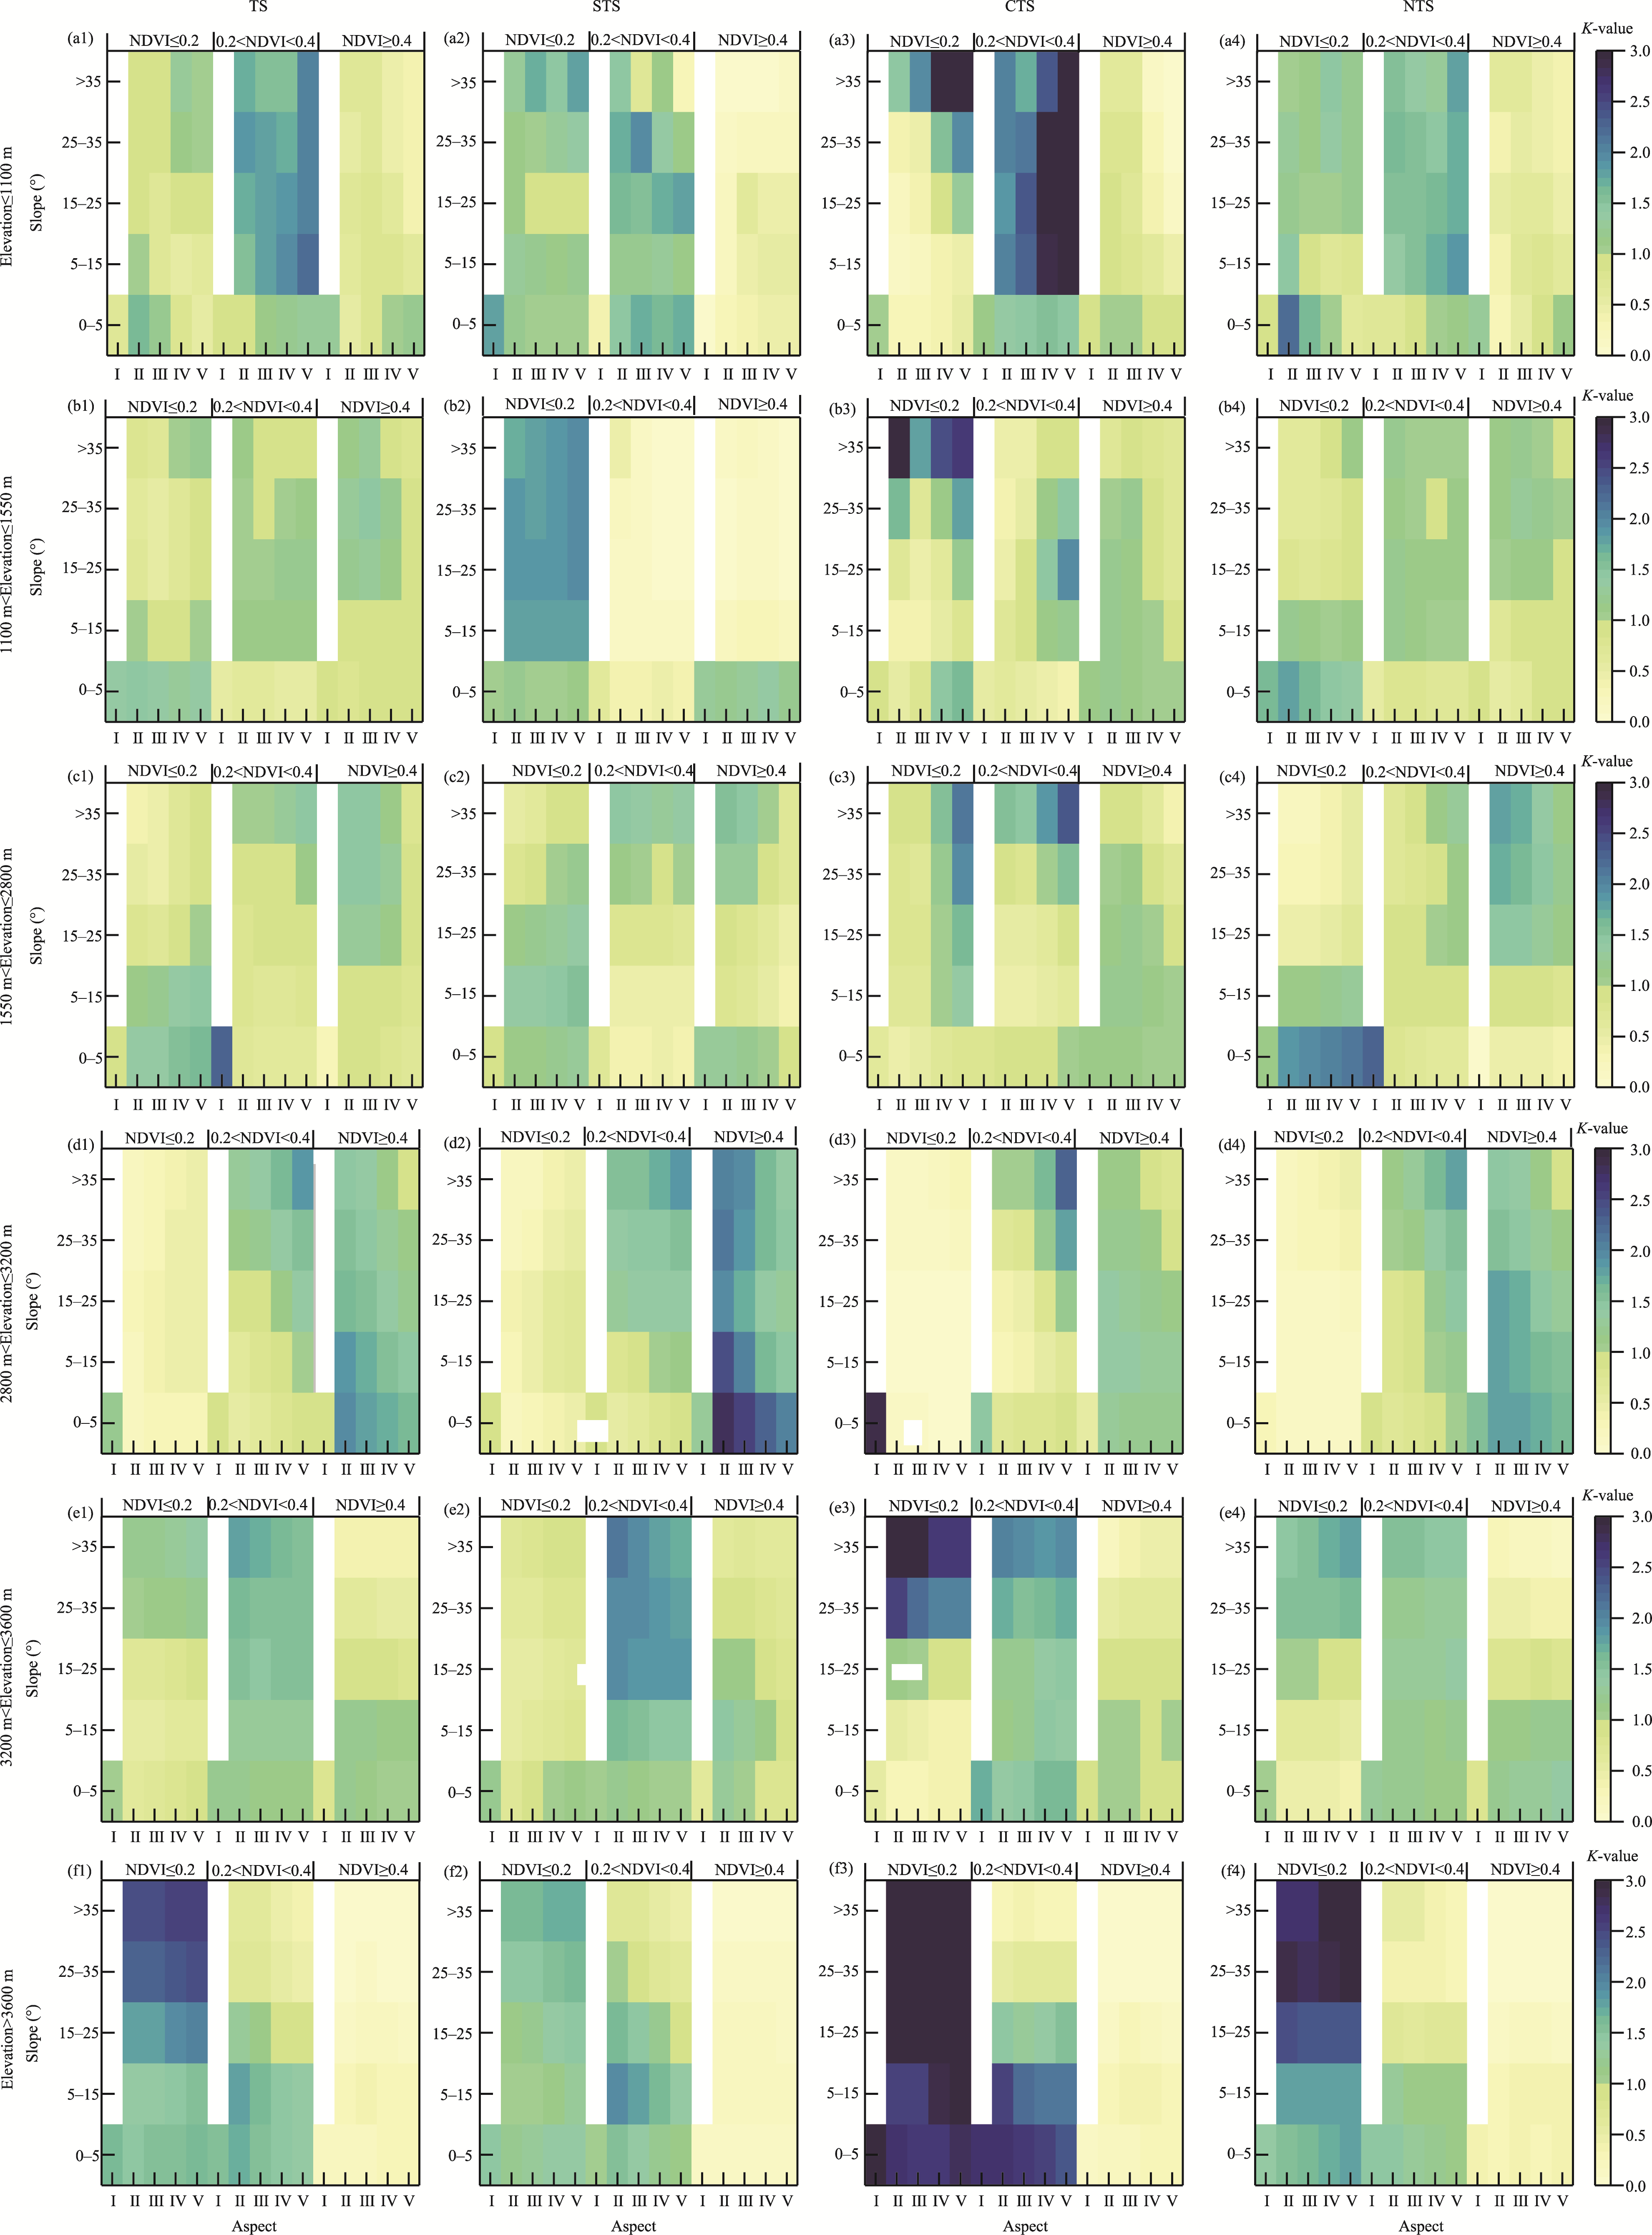
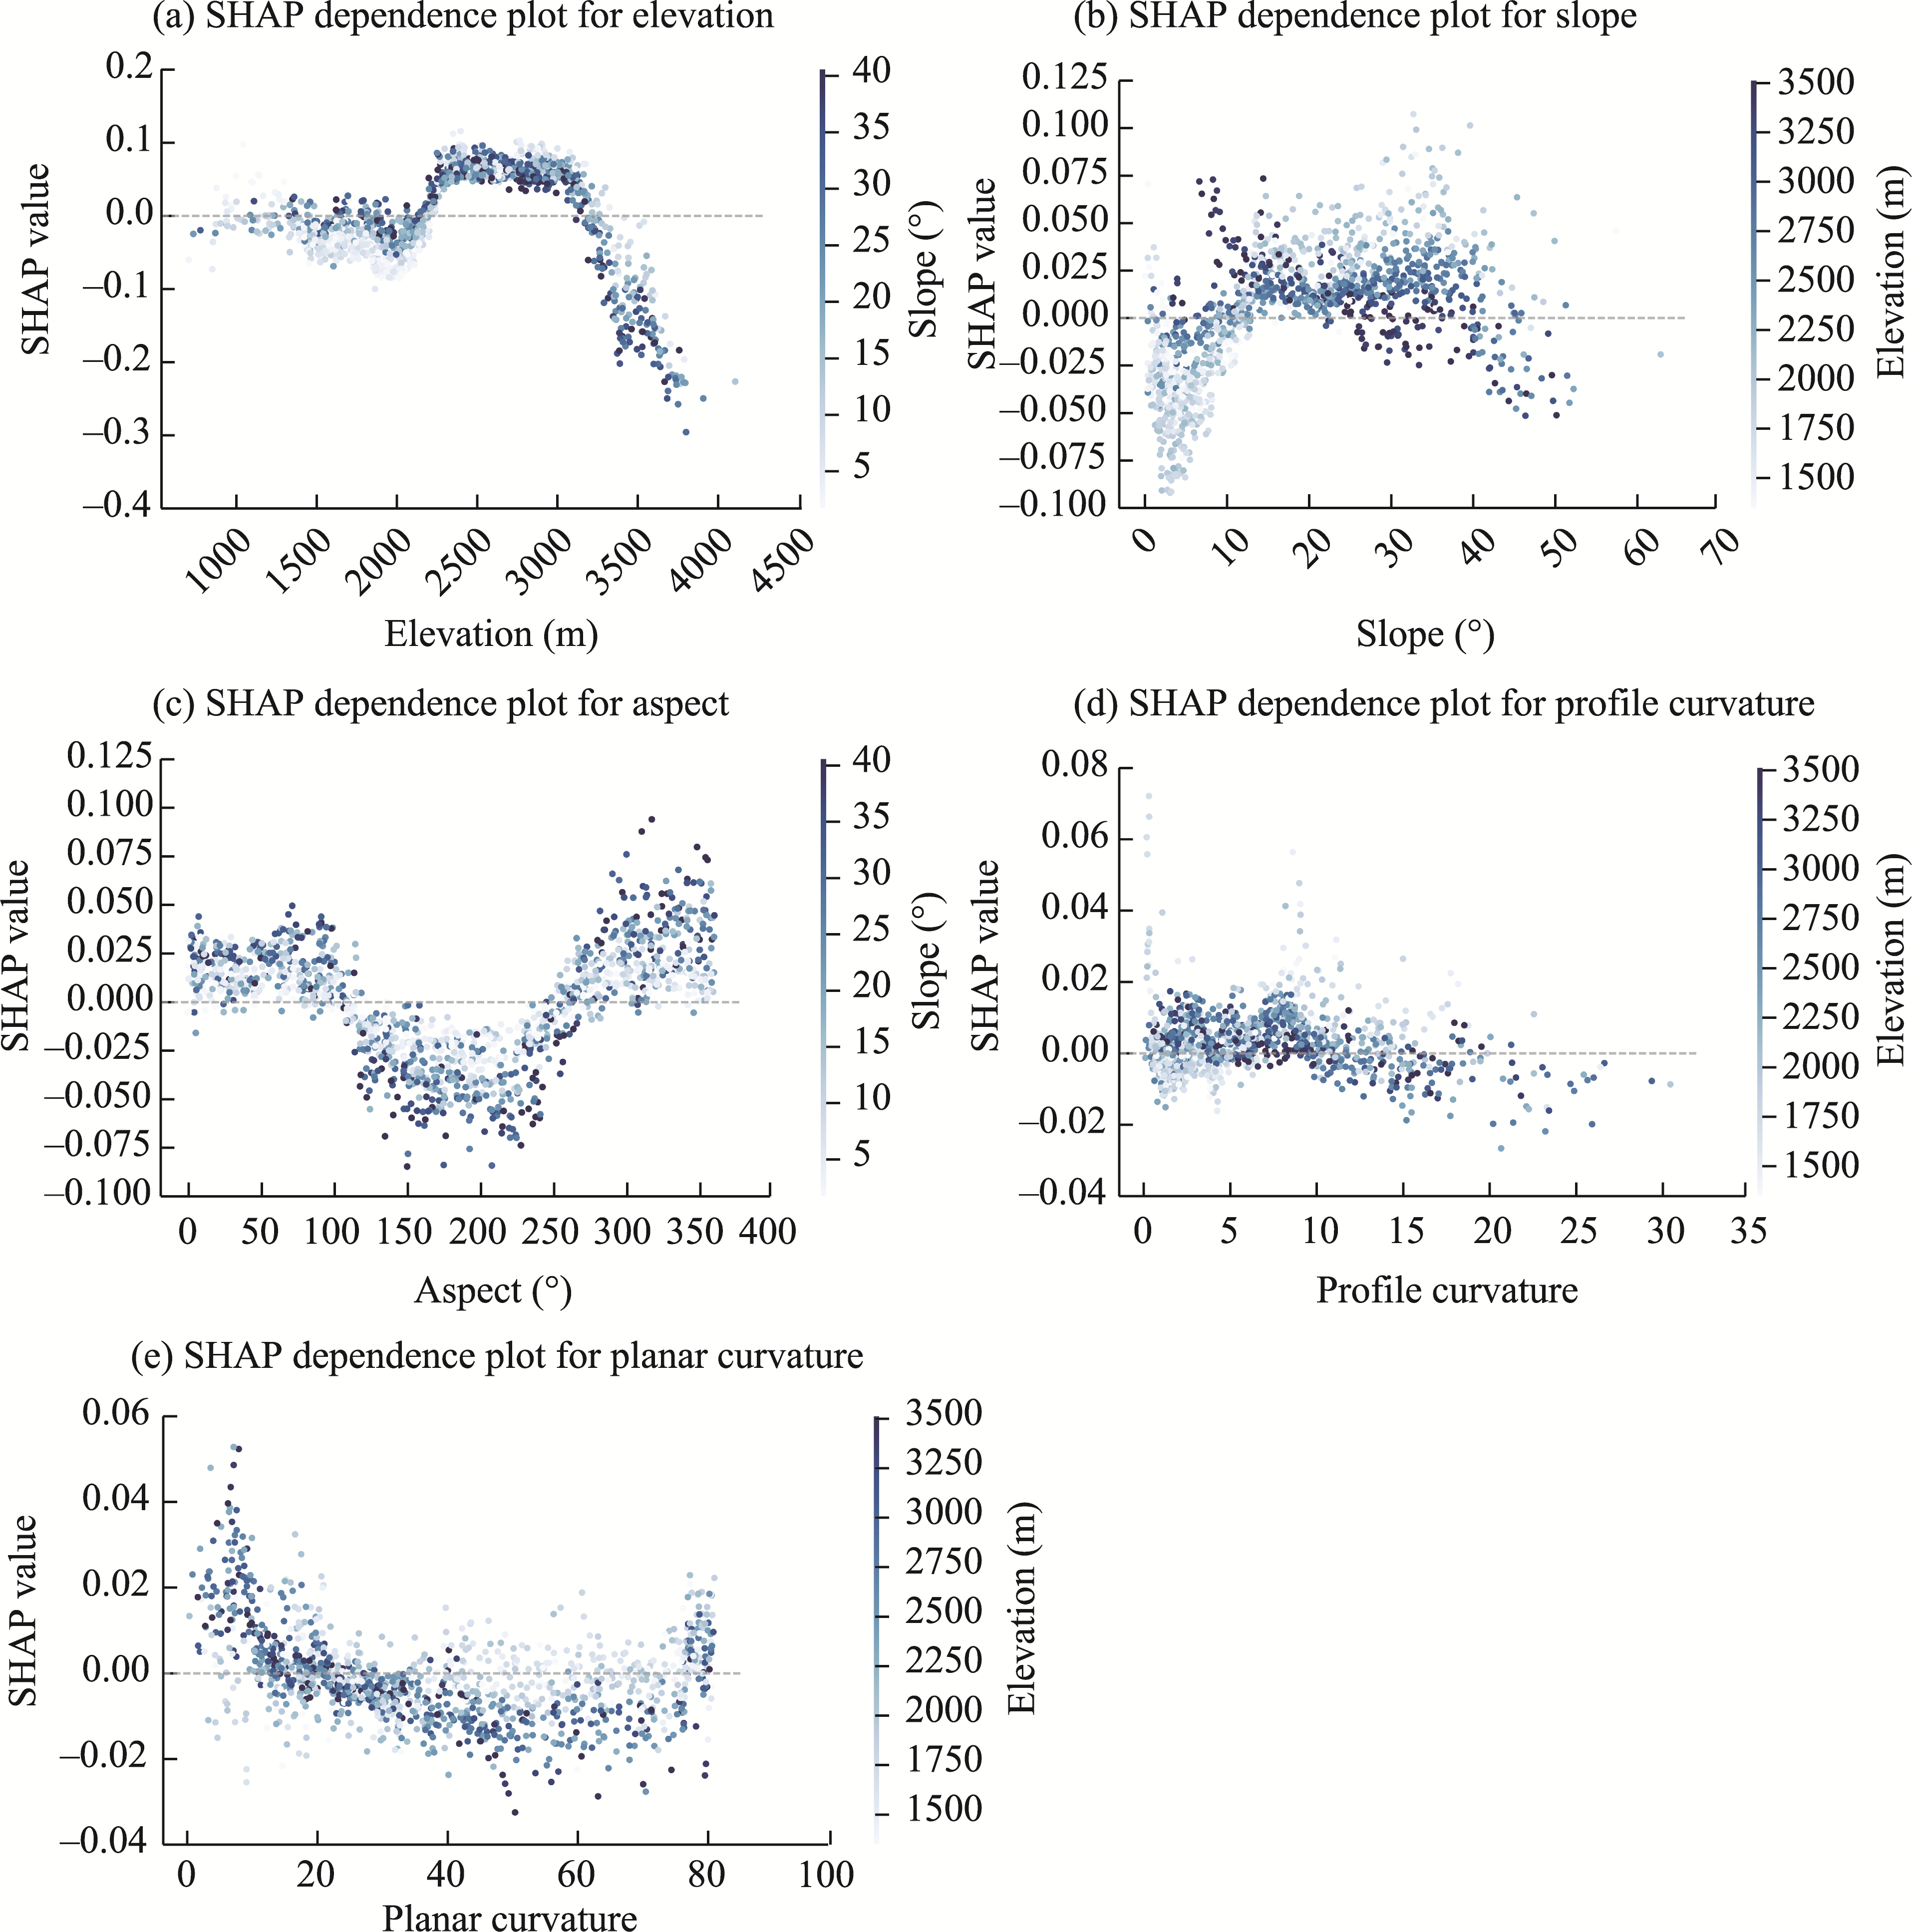
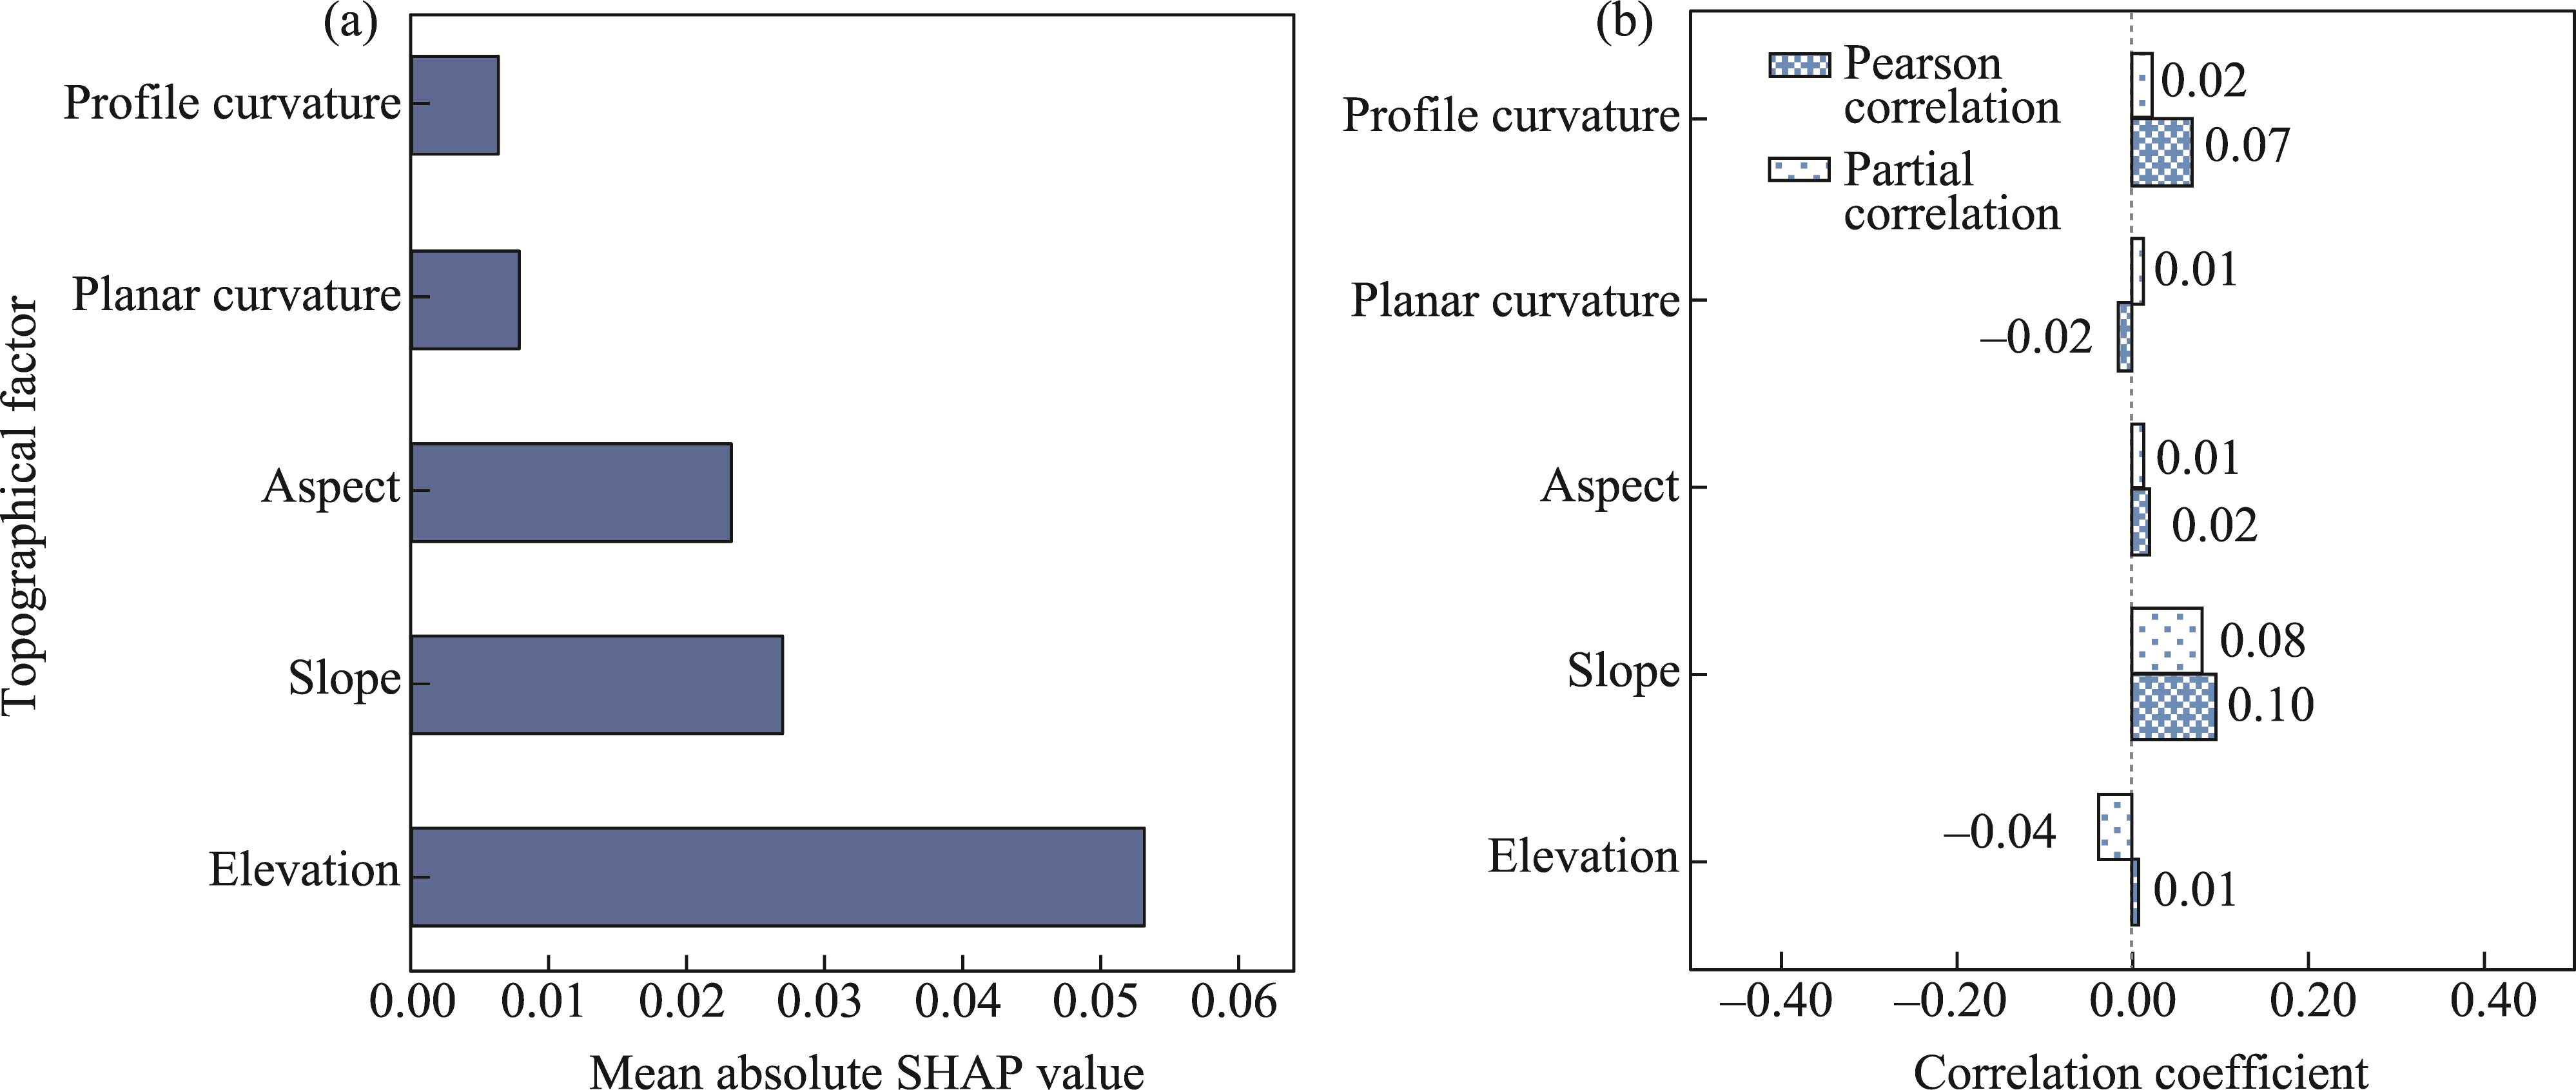
Abstract In the arid regions of Northwest China, vegetation cover plays a crucial role in maintaining unique terrestrial ecosystems. Vegetation growth is highly sensitive to variations in topographical factors, and the influence of topography on vegetation cover has attracted increasing attention. This study analyzed vegetation dynamics and their relationship with topography in the Tianshan Mountains of China using Landsat Normalized Difference Vegetation Index (NDVI) data during 2000-2022 and Shuttle Radar Topography Mission (SRTM)-derived topographical factors (elevation, slope, and aspect). Theil-Sen slope estimation and Mann-Kendall trend tests were applied to quantify temporal changes in vegetation, while a terrain area correction coefficient (K) was used to assess spatial associations of vegetation with topography. Random Forest (RF) regression and SHapley Additive exPlanations (SHAP) analysis evaluated the relative importance of topographical factors in shaping vegetation cover (multi-year mean NDVI) distribution. Key findings included that over the 23-a period, 59.46% of the vegetated area exhibited significant improvement (P<0.05), with the southern Tianshan Mountains showing the most pronounced increase (70.59%), whereas vegetation degradation (3.10%) was primarily concentrated in river valleys with intensive human activities. RF-SHAP analysis revealed that elevation is the primary driver of vegetation cover patterns, explaining 52.00% of the NDVI variation. The peak NDVI (0.42) occurred at elevations between 2800 and 3200 m. Slope and aspect also significantly influenced vegetation distribution, and higher NDVI values and greater improvement trends were observed on shady (north-facing) slopes compared to sunny (south-facing) slopes. K-index analysis indicated pronounced vegetation change—both degradation and improvement—in areas with elevations between 1100 and 2800 m and slopes exceeding 5°, particularly on sunny slopes. Low-elevation desert areas in the southern Tianshan Mountains were highly susceptible to degradation. This study underscores the critical role of topography in regulating vegetation cover and its spatiotemporal dynamics, providing a scientific basis for sustainable management of arid mountain ecosystems.
|
|
Received: 28 June 2025
Published: 31 March 2026
|
|
Corresponding Authors:
*LI Jun (E-mail: junli@cqnu.edu.cn)
|
|
|
| [1] |
Adams B T, Matthews S N, Iverson L R, et al. 2021. Spring phenological variability promoted by topography and vegetation assembly processes in a temperate forest landscape. Agricultural and Forest Meteorology, 308-309: 108578, doi: 10.1016/j.agrformet.2021.108578.
|
|
|
| [2] |
Bao Z X, Zhang J Y, Wang G Q, et al. 2021. The sensitivity of vegetation cover to climate change in multiple climatic zones using machine learning algorithms. Ecological Indicators, 124: 107443, doi: 10.1016/j.ecolind.2021.107443.
|
|
|
| [3] |
Bashir B, Cao C X, Naeem S, et al. 2020. Spatio-temporal vegetation dynamic and persistence under climatic and anthropogenic factors. Remote Sensing, 12(16): 2612, doi: 10.3390/rs12162612.
|
|
|
| [4] |
Bhambri R, Schmidt S, Chand P, et al. 2023. Heterogeneity in glacier thinning and slowdown of ice movement in the Garhwal Himalaya, India. Science of The Total Environment, 875: 162625, doi: 10.1016/j.scitotenv.2023.162625.
|
|
|
| [5] |
Bi X, Li B, Zhang L X, et al. 2020. Response of grassland productivity to climate change and anthropogenic activities in arid regions of Central Asia. Peerj, 8: 9797, doi: 10.7717/peerj.9797.
pmid: 32944421
|
|
|
| [6] |
Cai X R, Li Z Q, Zhang H, et al. 2021. Vulnerability of glacier change in the Tianshan Mountains region of China. Journal of Geographical Sciences, 31(10): 1469-1489.
doi: 10.1007/s11442-021-1907-z
|
|
|
| [7] |
Cao F F, Liu L Z, Rong Y P, et al. 2025. Climate change enhances greening while human activities accelerate degradation in northern China's grasslands. Science of The Total Environment, 966: 178570, doi: 10.1016/j.scitotenv.2025.178570.
|
|
|
| [8] |
Fan J, Fan Y M, Cheng J H, et al. 2023. The spatio-temporal evolution characteristics of the vegetation NDVI in the northern slope of the Tianshan Mountains at different spatial scales. Sustainability, 15(8): 6642, doi: 10.3390/su15086642.
|
|
|
| [9] |
Fang Y A, Wu C D, Wang Y Z, et al. 2019. Topographic evolution of the Tianshan Mountains and their relation to the Junggar and Turpan Basins, Central Asia, from the Permian to the Neogene. Gondwana Research, 75: 47-67.
doi: 10.1016/j.gr.2019.03.020
|
|
|
| [10] |
Fu B L, Yuan B Y, Yao H, et al. 2025. Spatio-temporal dynamics of invasive Spartina Alterniflora and its functional traits' responding to hydro-meteorology. Earth's Future, 13(6): e2024EF005421, doi: 10.1029/2024ef005421.
|
|
|
| [11] |
Gao M D, Piao S L, Chen A P, et al. 2019. Divergent changes in the elevational gradient of vegetation activities over the last 30 years. Nature Communications, 10: 2970, doi: 10.1038/s41467-019-11035-w.
|
|
|
| [12] |
Gao W D, Zheng C, Liu X H, et al. 2022. NDVI-based vegetation dynamics and their responses to climate change and human activities from 1982 to 2020: A case study in the Mu Us Sandy Land, China. Ecological Indicators, 137: 108745, doi: 10.1016/j.ecolind.2022.108745.
|
|
|
| [13] |
García-Gamero V, Peña A, Laguna A M, et al. 2021. Factors controlling the asymmetry of soil moisture and vegetation dynamics in a hilly Mediterranean catchment. Journal of Hydrology, 598: 126207, doi: 10.1016/j.jhydrol.2021.126207.
|
|
|
| [14] |
Han J X, Zhang X Y, Wang J H, et al. 2023. Geographic exploration of the driving forces of the NDVI spatial differentiation in the Upper Yellow River Basin from 2000 to 2020. Sustainability, 15(3): 1922, doi: 10.3390/su15031922.
|
|
|
| [15] |
Hong T, Yim S H L, Heo Y. 2025. Interpreting complex relationships between urban and meteorological factors and street-level urban heat islands: Application of random forest and SHAP method. Sustainable Cities and Society, 126: 106353, doi: 10.1016/j.scs.2025.106353.
|
|
|
| [16] |
Hou G Y, Wu S X, Long W Y, et al. 2023. Quantitative analysis of the impact of climate change and oasification on changes in net primary productivity variation in mid-Tianshan Mountains from 2001 to 2020. Ecological Indicators, 154: 110820, doi: 10.1016/j.ecolind.2023.110820.
|
|
|
| [17] |
Hu T, Dong J Q, Hu Y N, et al. 2023. Stage response of vegetation dynamics to urbanization in megacities: A case study of Changsha City, China. Science of The Total Environment, 858: 159659, doi: 10.1016/j.scitotenv.2022.159659.
|
|
|
| [18] |
Hua X B, Ohlemüller R, Sirguey P. 2022. Differential effects of topography on the timing of the growing season in mountainous grassland ecosystems. Environmental Advances, 8: 100234, doi: 10.1016/j.envadv.2022.100234.
|
|
|
| [19] |
Immerzeel W W, Lutz A F, Andrade M, et al. 2020. Importance and vulnerability of the world's water towers. Nature, 577(7790): 364-369.
doi: 10.1038/s41586-019-1822-y
|
|
|
| [20] |
Jia L, Li Z B, Xu G C, et al. 2020. Dynamic change of vegetation and its response to climate and topographic factors in the Xijiang River basin, China. Environmental Science and Pollution Research, 27(11): 11637-11648.
doi: 10.1007/s11356-020-07692-w
|
|
|
| [21] |
Jiang L G, Liu Y, Wu S, et al. 2021. Analyzing ecological environment change and associated driving factors in China based on NDVI time series data. Ecological Indicators, 129: 107933, doi: 10.1016/j.ecolind.2021.107933.
|
|
|
| [22] |
Jin K, Wang F, Zong Q L, et al. 2020. Impact of variations in vegetation on surface air temperature change over the Chinese Loess Plateau. Science of The Total Environment, 716: 136967, doi: 10.1016/j.scitotenv.2020.136967.
|
|
|
| [23] |
Jing Q Q, He J J, Li Y R, et al. 2024. Analysis of the spatiotemporal changes in global land cover from 2001 to 2020. Science of The Total Environment, 908: 168354, doi: 10.1016/j.scitotenv.2023.168354.
|
|
|
| [24] |
Lan S X, Dong Z J. 2022. Incorporating vegetation type transformation with NDVI time-series to study the vegetation dynamics in Xinjiang. Sustainability, 14(1): 582, doi: 10.3390/su14010582.
|
|
|
| [25] |
Li C J, Fu B J, Wang S, et al. 2021a. Drivers and impacts of changes in China's drylands. Nature Reviews Earth & Environment, 2(12): 858-873.
|
|
|
| [26] |
Li L L, Li J, Yu R C. 2022a. Evaluation of CMIP 6 HighResMIP models in simulating precipitation over Central Asia. Advances in Climate Change Research, 13(1): 1-13.
doi: 10.1016/j.accre.2021.09.009
|
|
|
| [27] |
Li S Z, Xiao J, Lei X Y, et al. 2023. Farmland abandonment in the mountainous areas from an ecological restoration perspective: A case study of Chongqing, China. Ecological Indicators, 153: 110412, doi: 10.1016/j.ecolind.2023.110412.
|
|
|
| [28] |
Li X M, Zhang B, Ren R, et al. 2022b. Spatio-temporal heterogeneity of climate warming in the Chinese Tianshan Mountainous Region. Water, 14(2): 199, doi: 10.3390/w14020199.
|
|
|
| [29] |
Li Y, Xie Z X, Qin Y C, et al. 2019. Drought under global warming and climate change: An empirical study of the Loess Plateau. Sustainability, 11(5): 1281, doi: 10.3390/su11051281.
|
|
|
| [30] |
Li Y P, Chen Y N, Sun F, et al. 2021b. Recent vegetation browning and its drivers on Tianshan Mountain, Central Asia. Ecological Indicators, 129: 107912, doi: 10.1016/j.ecolind.2021.107912.
|
|
|
| [31] |
Liang T C, Tian F, Zou L Q, et al. 2024. Global assessment of vegetation patterns along topographic gradients. International Journal of Digital Earth, 17(1): 2404232, doi: 10.1080/17538947.2024.2404232.
|
|
|
| [32] |
Lin M, Hou L Z, Qi Z M, et al. 2022. Impacts of climate change and human activities on vegetation NDVI in China's Mu Us Sandy Land during 2000-2019. Ecological Indicators, 142: 109164, doi: 10.1016/j.ecolind.2022.109164.
|
|
|
| [33] |
Liu Y, Tian J Y, Liu R H, et al. 2021. Influences of climate change and human activities on NDVI changes in China. Remote Sensing, 13(21): 4326, doi: 10.3390/rs13214326.
|
|
|
| [34] |
Meng X Y, Gao X, Li S Y, et al. 2020. Spatial and temporal characteristics of vegetation NDVI changes and the driving forces in Mongolia during 1982-2015. Remote Sensing, 12(4): 603, doi: 10.3390/rs12040603.
|
|
|
| [35] |
Novillo C J, Arrogante-Funes P, Romero-Calcerrada R. 2019. Recent NDVI trends in Mainland Spain: Land-cover and phytoclimatic-type implications. Isprs International Journal of Geo-Information, 8(1): 43, doi: 10.3390/ijgi8010043.
|
|
|
| [36] |
Piao S L, Nan H J, Huntingford C, et al. 2014. Evidence for a weakening relationship between interannual temperature variability and northern vegetation activity. Nature Communications, 5: 5018, doi: 10.1038/ncomms6018.
pmid: 25318638
|
|
|
| [37] |
Piao S L, Wang X H, Park T, et al. 2020. Characteristics, drivers and feedbacks of global greening. Nature Reviews Earth & Environment, 1(1): 14-27.
|
|
|
| [38] |
Ren Y T, Zhang F, Zhao C L, et al. 2023. Attribution of climate change and human activities to vegetation NDVI in Jilin Province, China during 1998-2020. Ecological Indicators, 153: 110415, doi: 10.1016/j.ecolind.2023.110415.
|
|
|
| [39] |
Shi K F, Chang Z J, Chen Z Q, et al. 2020. Identifying and evaluating poverty using multisource remote sensing and point of interest (POI) data: A case study of Chongqing, China. Journal of Cleaner Production, 255: 12024, doi: 10.1016/j.jclepro.2020.120245.
|
|
|
| [40] |
Sorg A, Bolch T, Stoffel M, et al. 2012. Climate change impacts on glaciers and runoff in Tien Shan (Central Asia). Nature Climate Change, 2: 725-731.
doi: 10.1038/nclimate1592
|
|
|
| [41] |
Wang C Y, Wang J N, Naudiyal N, et al. 2022. Multiple effects of topographic factors on spatio-temporal variations of vegetation patterns in the three parallel rivers region, Southeast Qinghai-Tibet Plateau. Remote Sensing, 14(1): 151, doi: 10.3390/rs14010151.
|
|
|
| [42] |
Wang F, Wang X, Zhao Y, et al. 2014. Temporal variations of NDVI and correlations between NDVI and hydro-climatological variables at Lake Baiyangdian, China. International Journal of Biometeorology, 58(7): 1531-1543.
doi: 10.1007/s00484-013-0758-4
pmid: 24173361
|
|
|
| [43] |
Wang Y T, Zhang X L, Guo Z Q. 2021. Estimation of tree height and aboveground biomass of coniferous forests in North China using stereo ZY-3, multispectral Sentinel-2, and DEM data. Ecological Indicators, 126: 107645, doi: 10.1016/j.ecolind.2021.107645.
|
|
|
| [44] |
Xiao J Y, Xie B G, Zhou K C, et al. 2023. Bidirectional dependency between vegetation and terrestrial water storage in China. Journal of Hydrology, 626: 130313, doi: 10.1016/j.jhydrol.2023.130313.
|
|
|
| [45] |
Xiong Y L, Wang H L. 2022. Spatial relationships between NDVI and topographic factors at multiple scales in a watershed of the Minjiang River, China. Ecological Informatics, 69: 101617, doi: 10.1016/j.ecoinf.2022.101617.
|
|
|
| [46] |
Yadav S, Padalia H, Sinha S K, et al. 2021. Above-ground biomass estimation of Indian tropical forests using X band Pol-InSAR and Random Forest. Remote Sensing Applications: Society and Environment, 21: 100462, doi: 10.1016/j.rsase.2020.100462.
|
|
|
| [47] |
Yan W, Wang H S, Jiang C, et al. 2021. Satellite view of vegetation dynamics and drivers over southwestern China. Ecological Indicators, 130: 108074, doi: 10.1016/j.ecolind.2021.108074.
|
|
|
| [48] |
Yang J, El-Kassaby Y A, Guan W B. 2020. The effect of slope aspect on vegetation attributes in a mountainous dry valley, Southwest China. Scientific Reports, 10: 16465, doi: 10.1038/s41598-020-73496-0.
pmid: 33020576
|
|
|
| [49] |
Yang J L, Dong J W, Xiao X M, et al. 2019. Divergent shifts in peak photosynthesis timing of temperate and alpine grasslands in China. Remote Sensing of Environment, 233: 111395, doi: 10.1016/j.rse.2019.111395.
|
|
|
| [50] |
Yao H, Fu B L, Sun W W, et al. 2025. Quantifying key indicators of essential biodiversity variables for mangrove species in response to hydro-meteorological factors. International Journal of Applied Earth Observation and Geoinformation, 139: 104535, doi: 10.1016/j.jag.2025.104535.
|
|
|
| [51] |
Zhang J X, Yang T, Deng M J, et al. 2023a. Spatiotemporal variations and its driving factors of NDVI in Northwest China during 2000-2021. Environmental Science and Pollution Research, 30(56): 118782-118800.
doi: 10.1007/s11356-023-30250-z
|
|
|
| [52] |
Zhang X Y, Jia W W, Lu S X, et al. 2024. Ecological assessment and driver analysis of high vegetation cover areas based on new remote sensing index. Ecological Informatics, 82: 102786, doi: 10.1016/j.ecoinf.2024.102786.
|
|
|
| [53] |
Zhang Y, Liu L Y, Liu Y, et al. 2021. Response of altitudinal vegetation belts of the Tianshan Mountains in northwestern China to climate change during 1989-2015. Scientific Reports, 11: 4870, doi: 10.1038/s41598-021-84399-z.
|
|
|
| [54] |
Zhang Y, An C B, Jiang L, et al. 2023b. Increased vegetation productivity of altitudinal vegetation belts in the Chinese Tianshan Mountains despite warming and drying since the early 21st century. Forests, 14(11): 2189, doi: 10.3390/f14112189.
|
|
|
| [55] |
Zhou Z Q, Ding Y B, Shi H Y, et al. 2020. Analysis and prediction of vegetation dynamic changes in China: Past, present and future. Ecological Indicators, 117: 106642, doi: 10.1016/j.ecolind.2020.106642.
|
|
|
|
Viewed |
|
|
|
Full text
|
|
|
|
|
Abstract
|
|
|
|
|
Cited |
|
|
|
|
| |
Shared |
|
|
|
|
| |
Discussed |
|
|
|
|