| Research article |
|


|
|
|
| Comprehensive applicability evaluation of four precipitation products at multiple spatiotemporal scales in Northwest China |
WANG Xiangyu1,2, XU Min2,3,*( ), KANG Shichang2,3, LI Xuemei4, HAN Haidong2,3, LI Xingdong1 ), KANG Shichang2,3, LI Xuemei4, HAN Haidong2,3, LI Xingdong1 |
1School of Mathematics, Lanzhou Jiaotong University, Lanzhou 730070, China
2Key Laboratory of Cryospheric Science and Frozen Soil Engineering, Northwest Institute of Eco-Environment and Resources, Chinese Academy of Sciences, Lanzhou 730000, China
3University of Chinese Academy of Sciences, Beijing 100049, China
4Faculty of Geomatics, Lanzhou Jiaotong University, Lanzhou 730070, China |
|
|
|
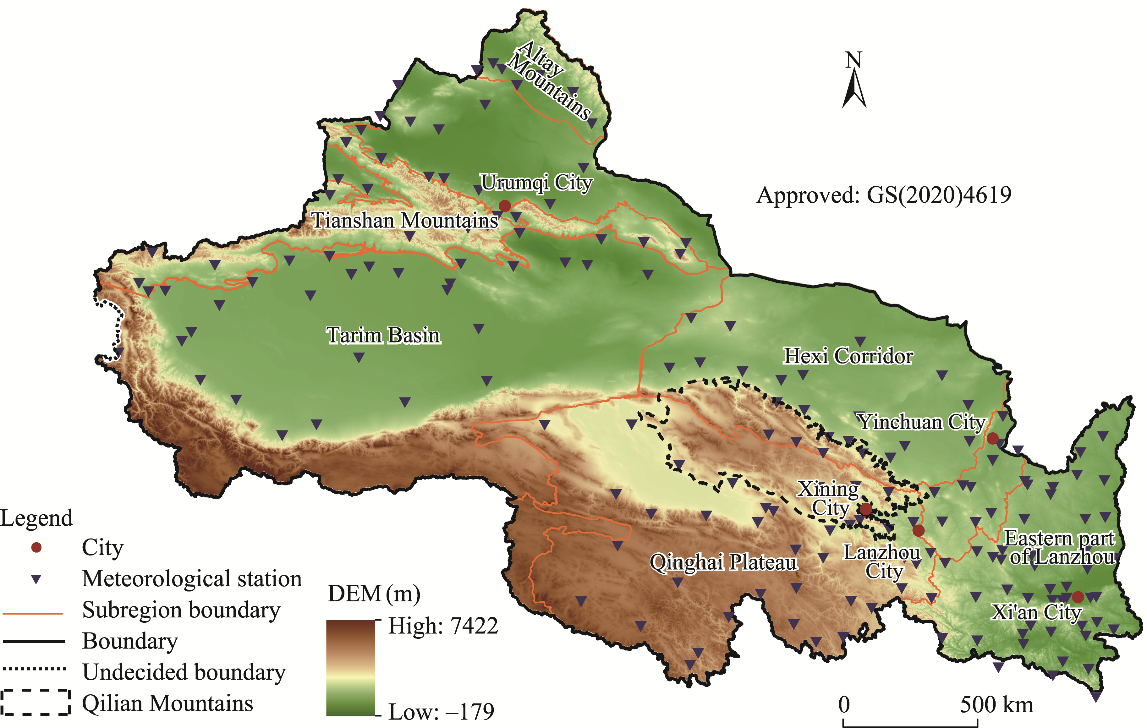
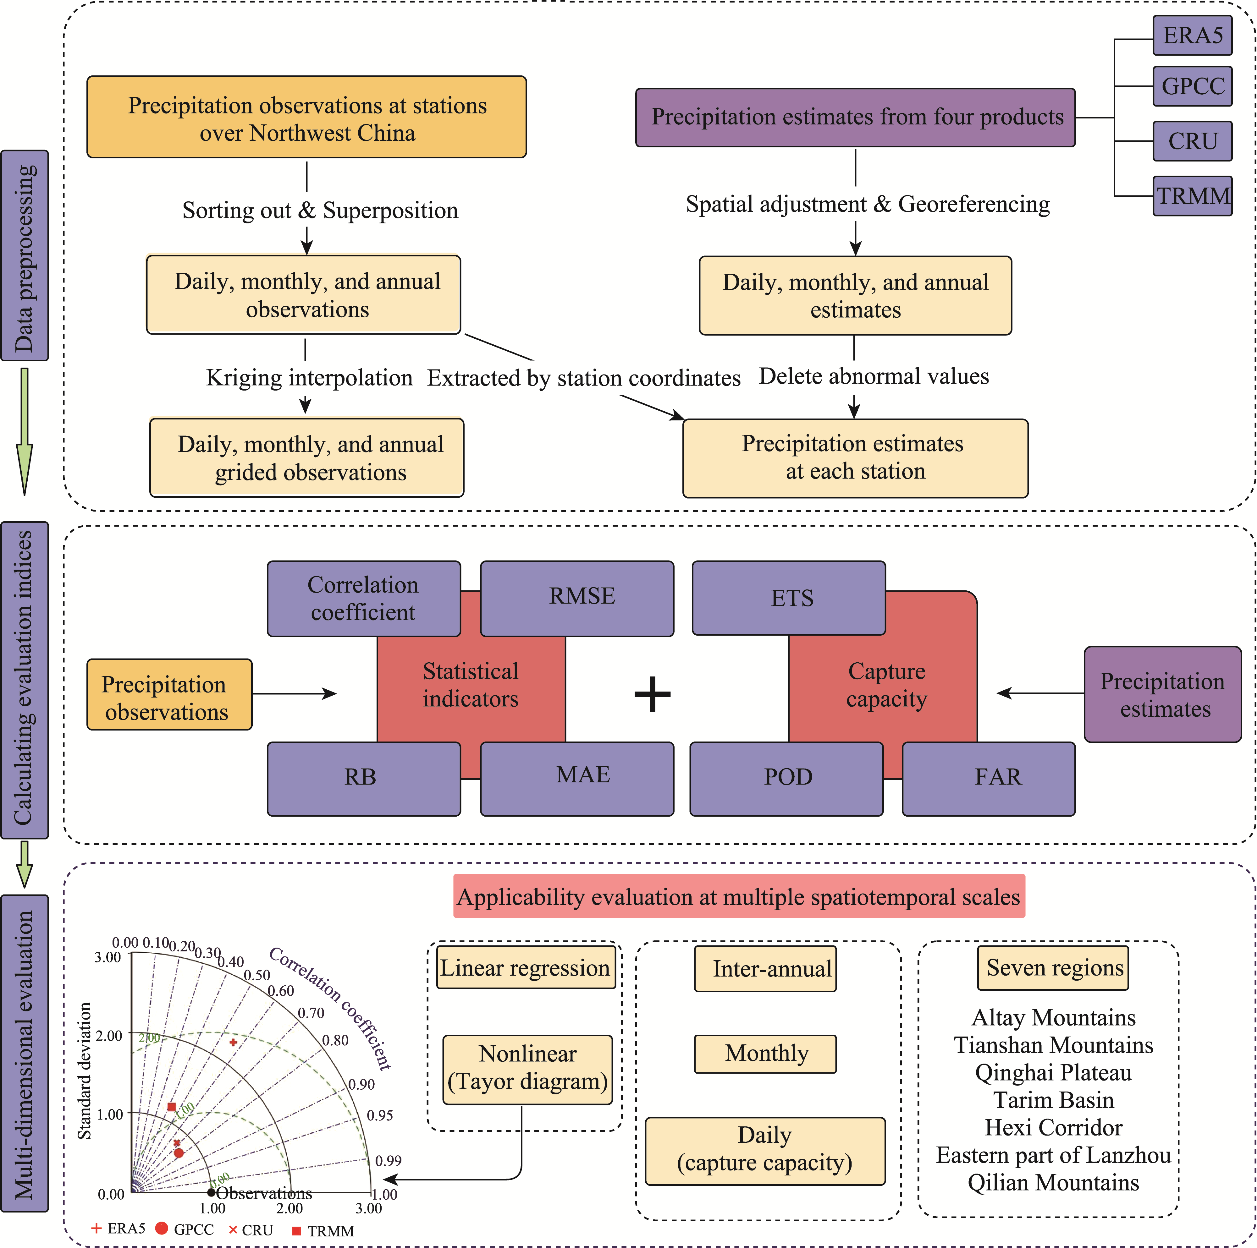
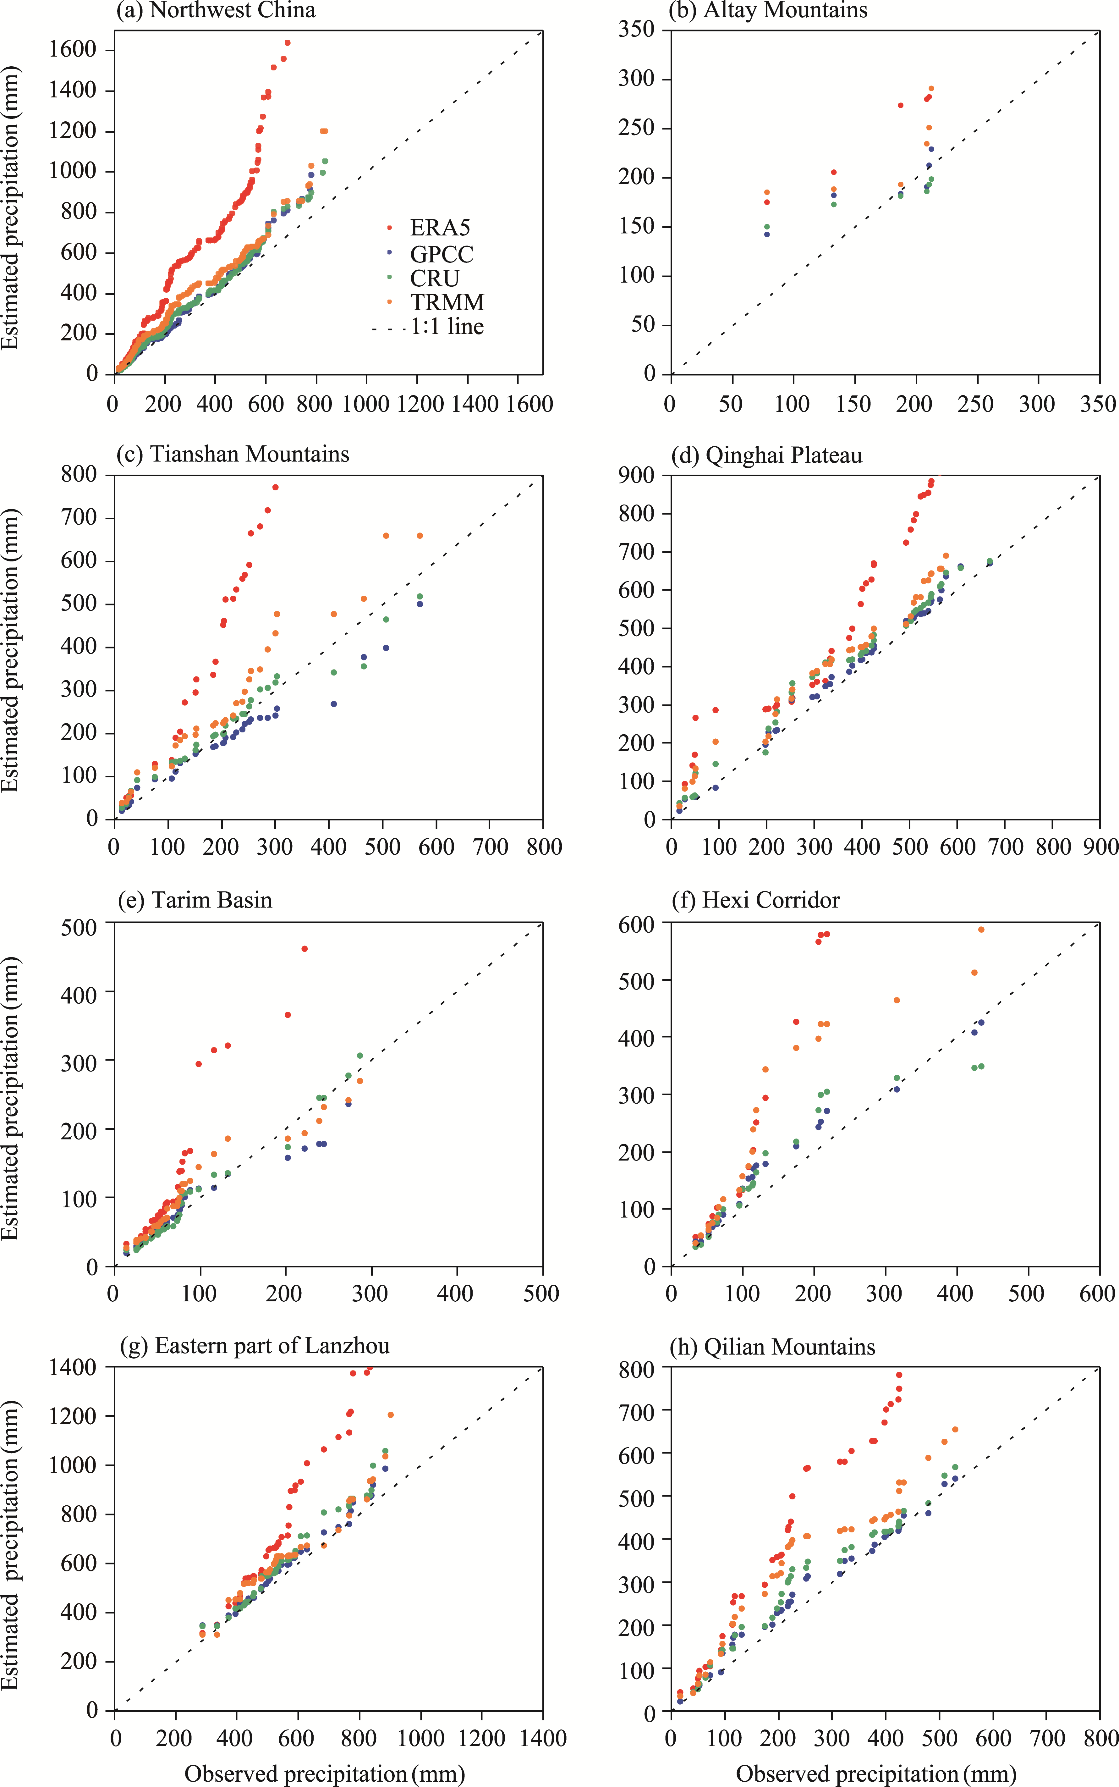
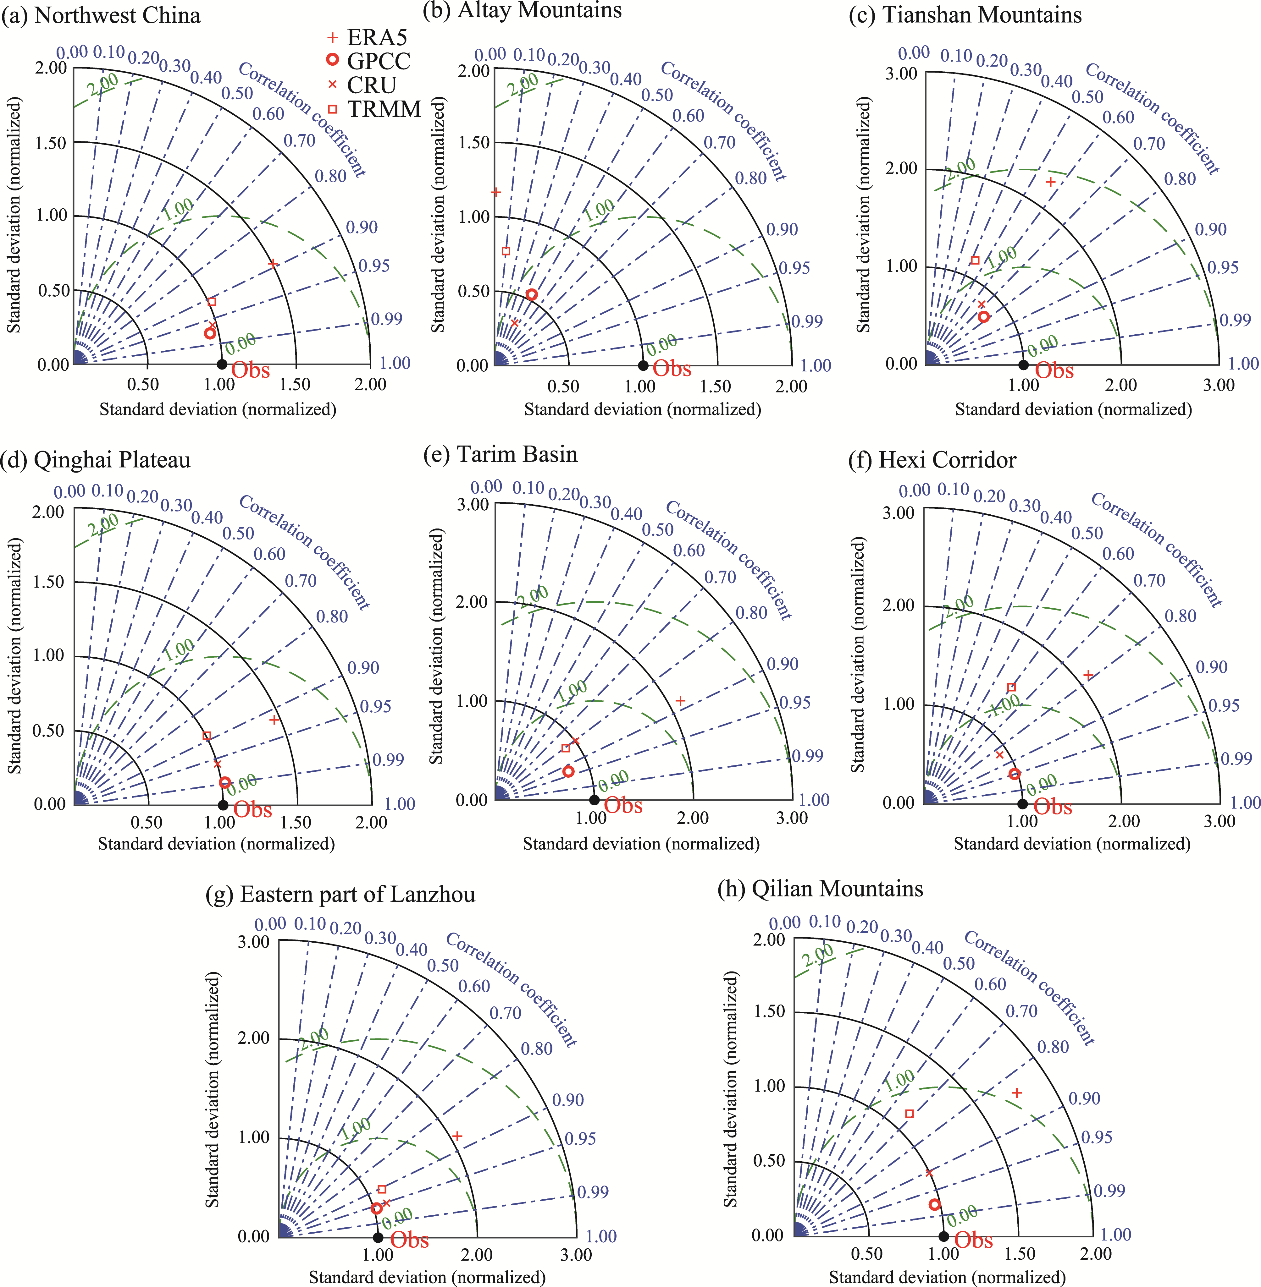
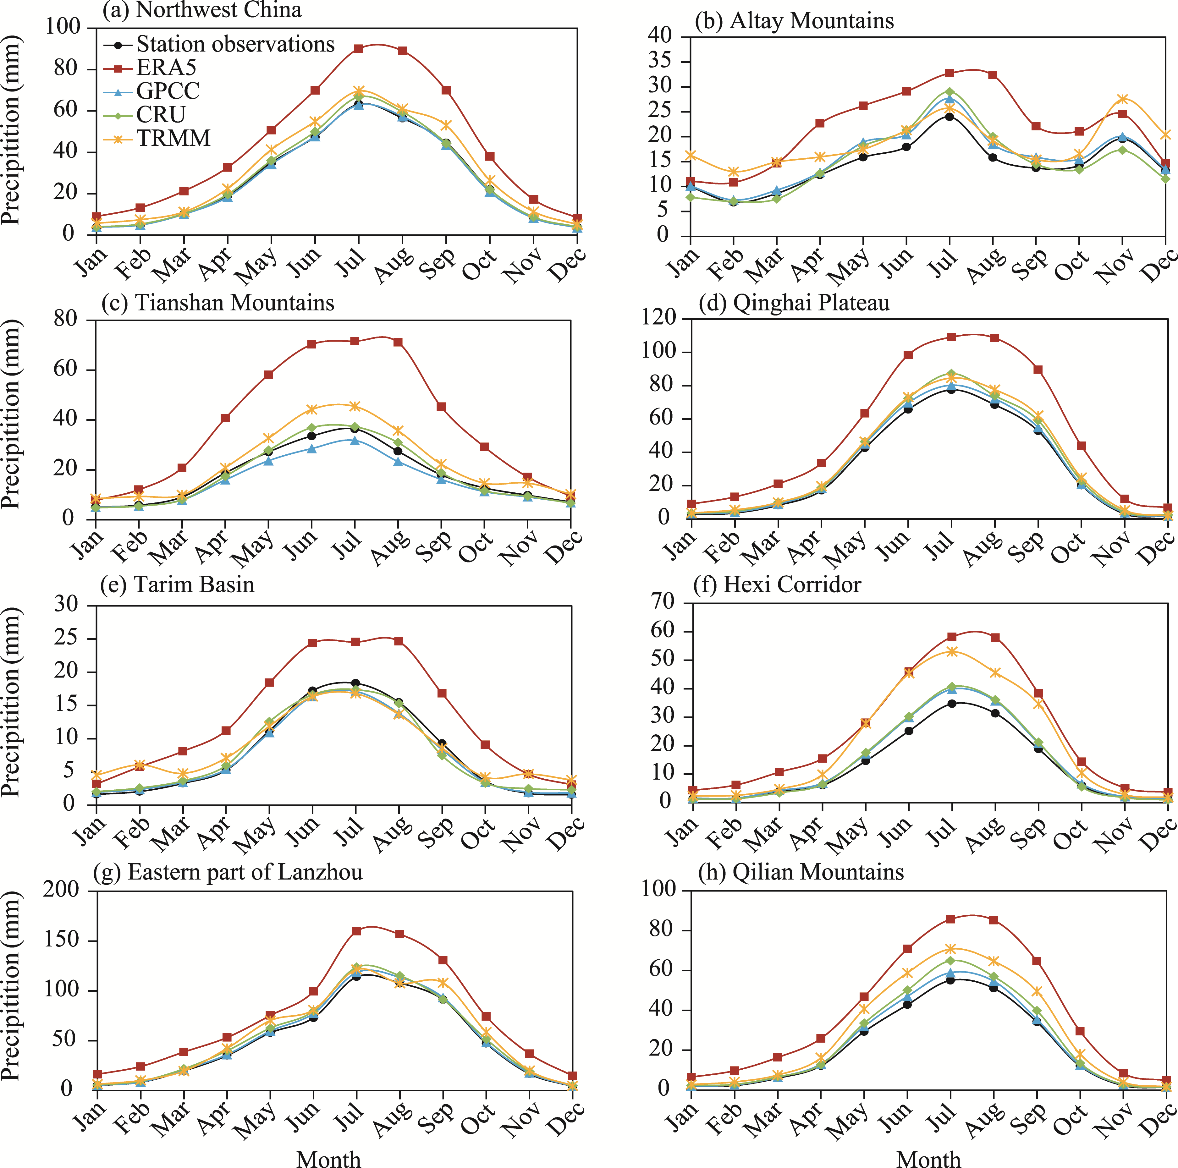
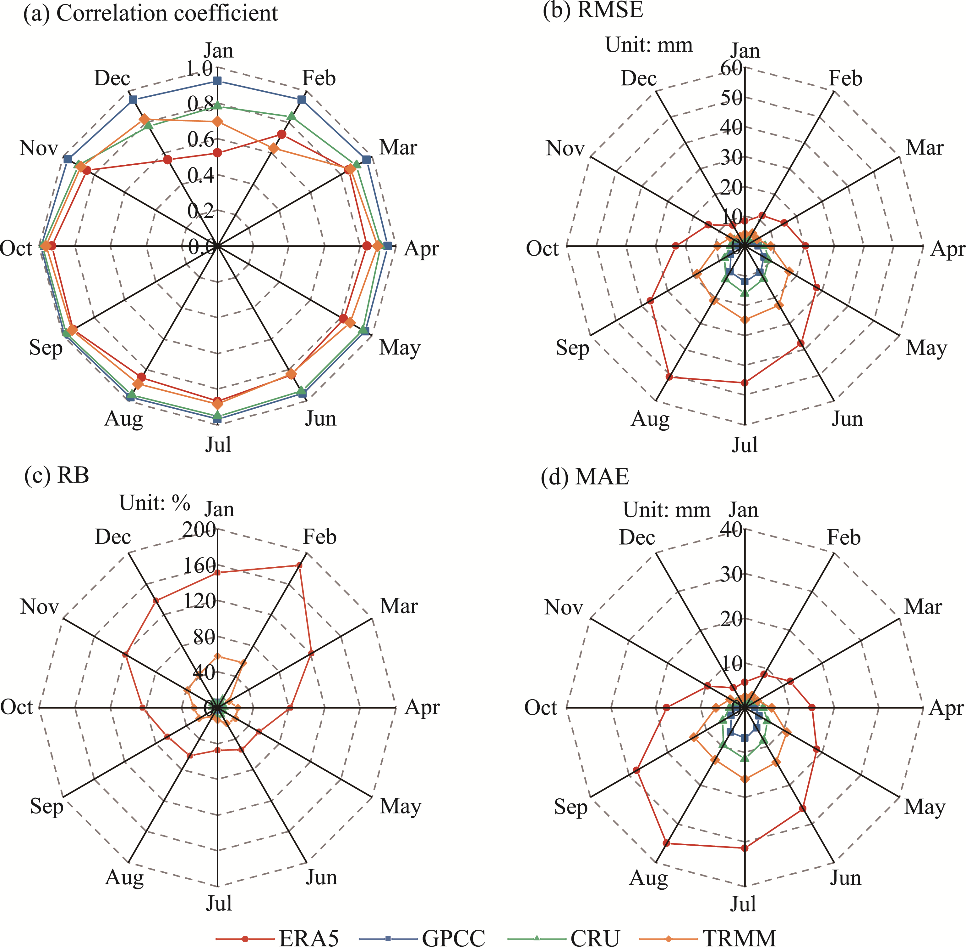
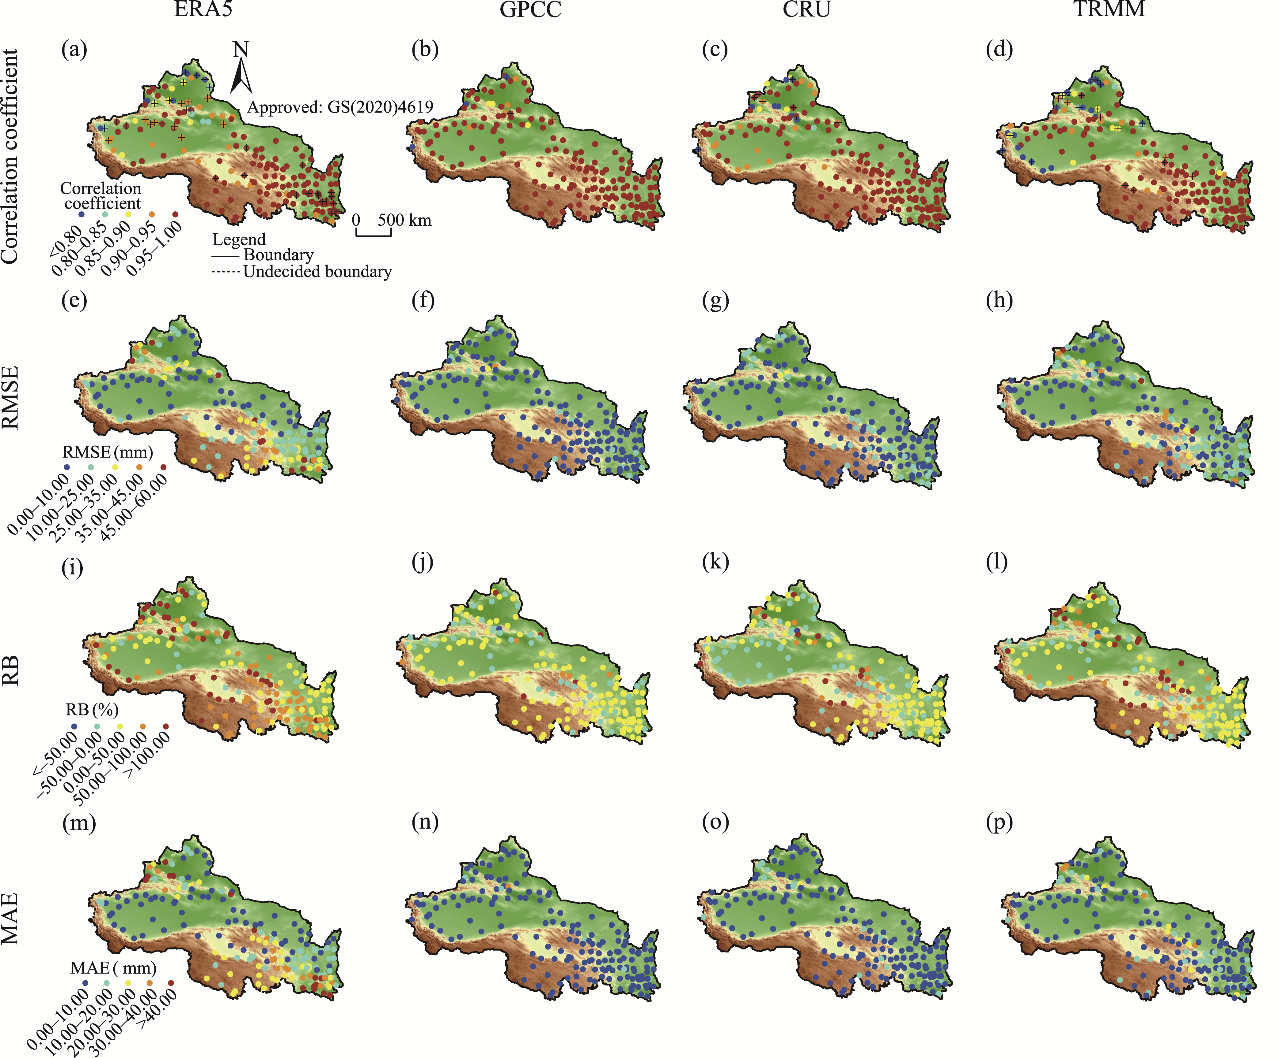
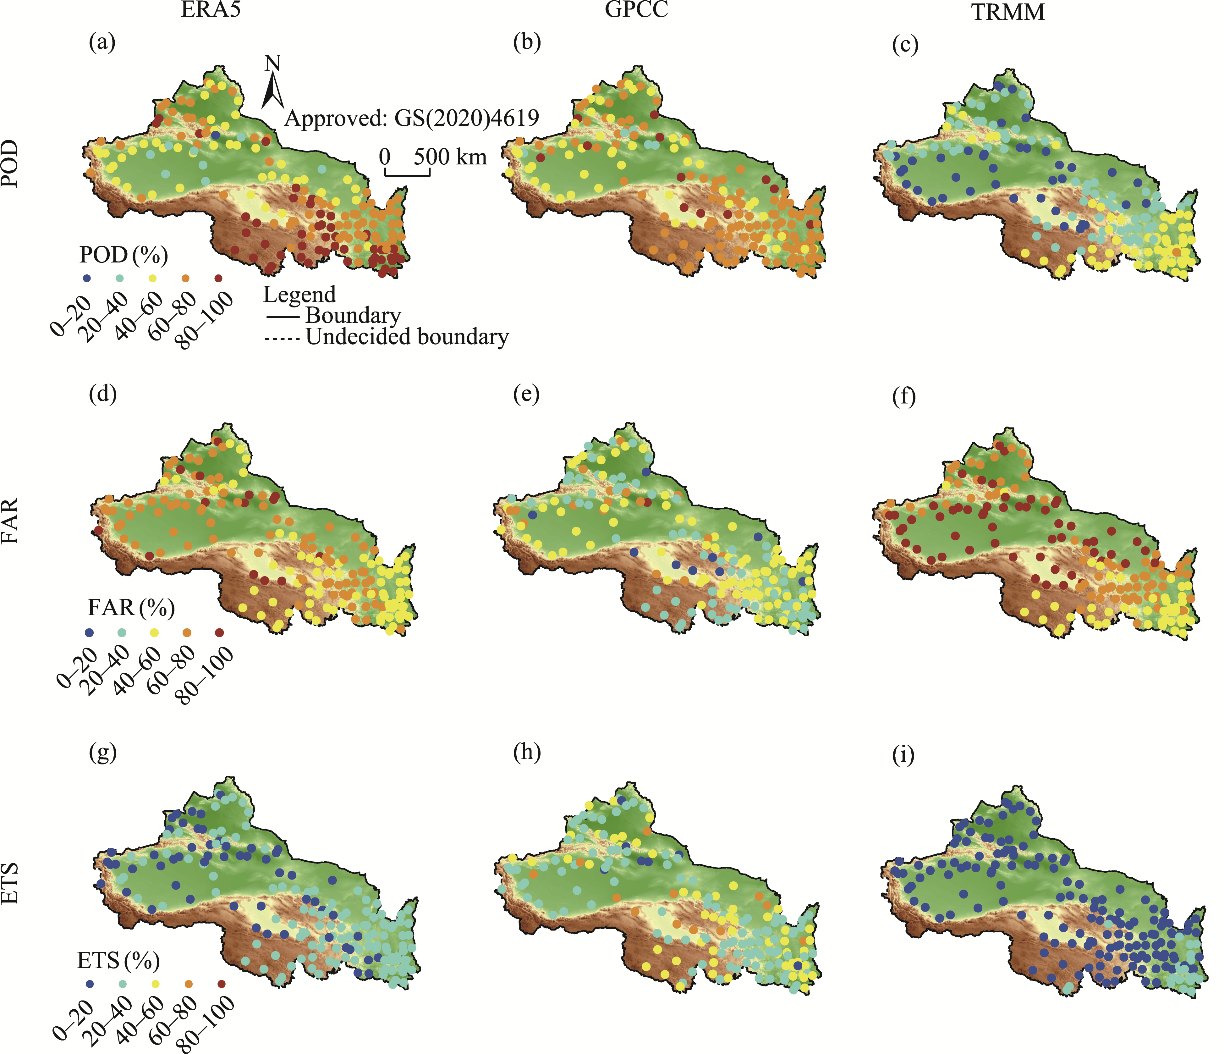
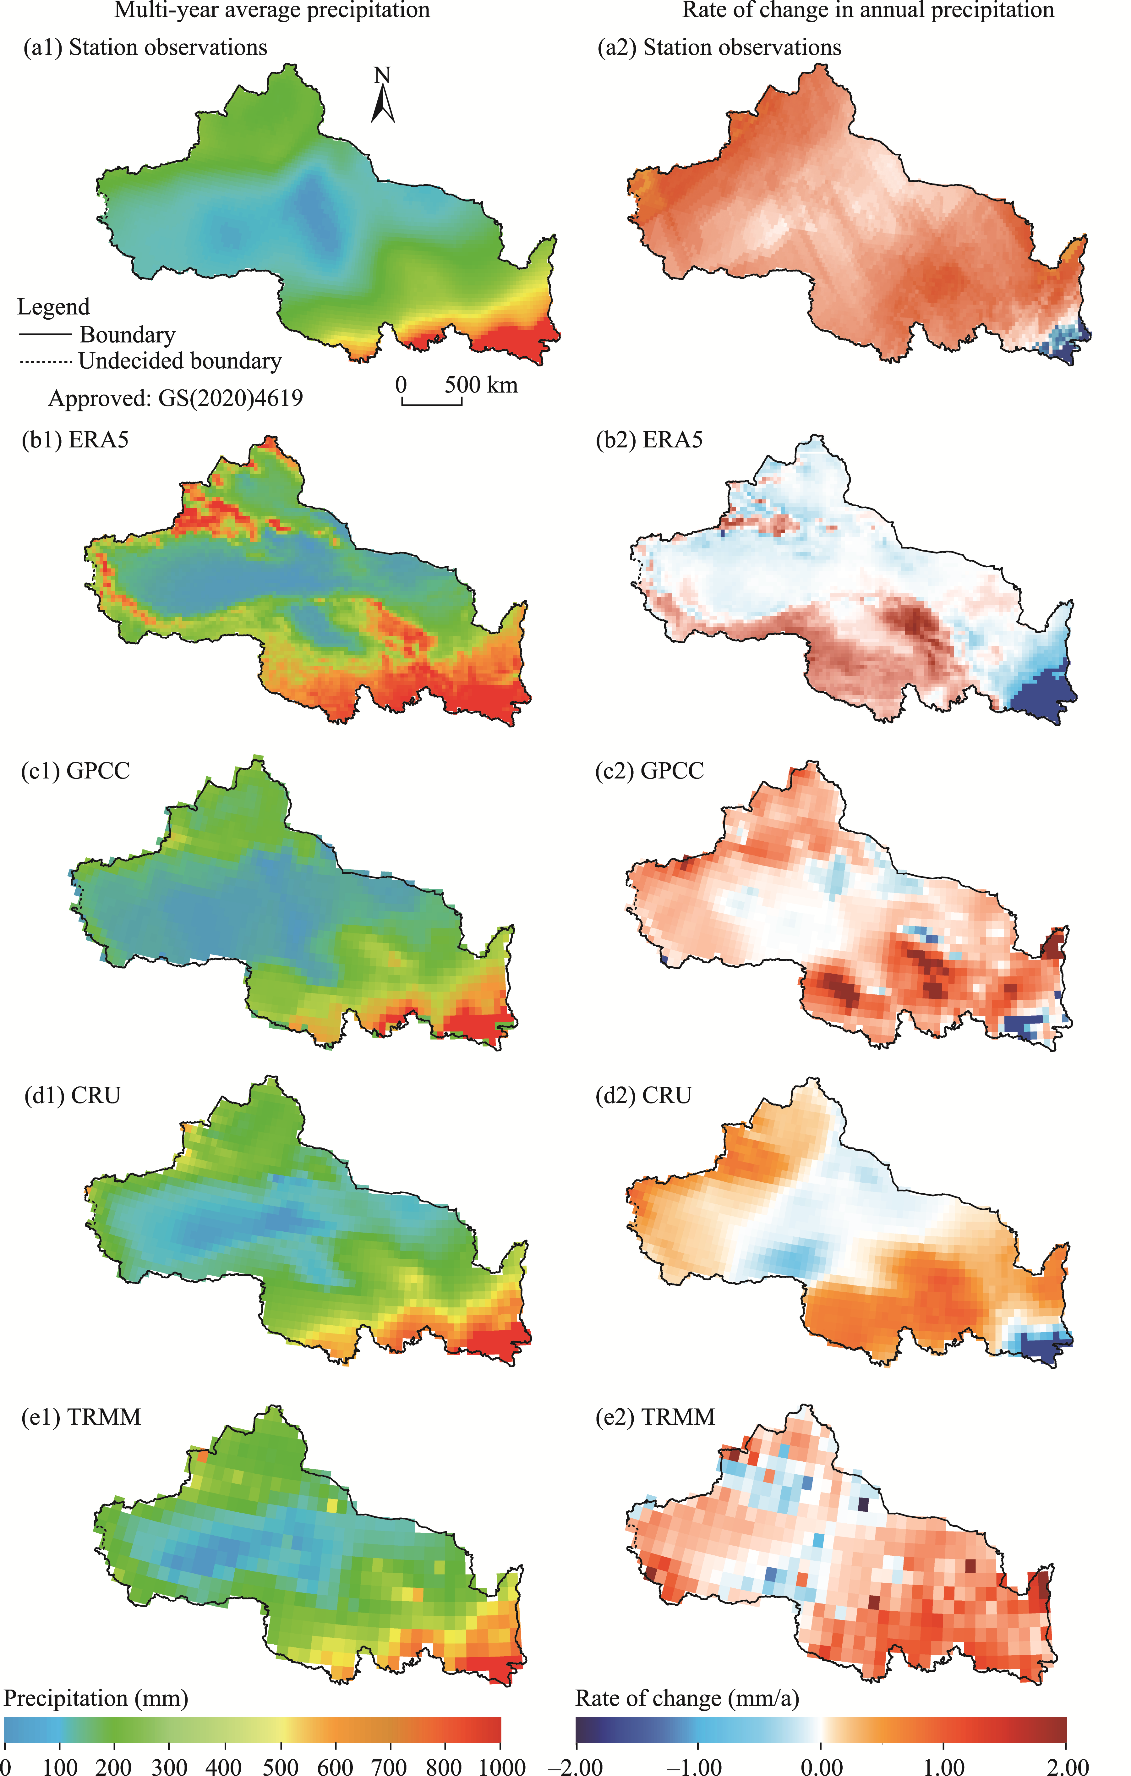
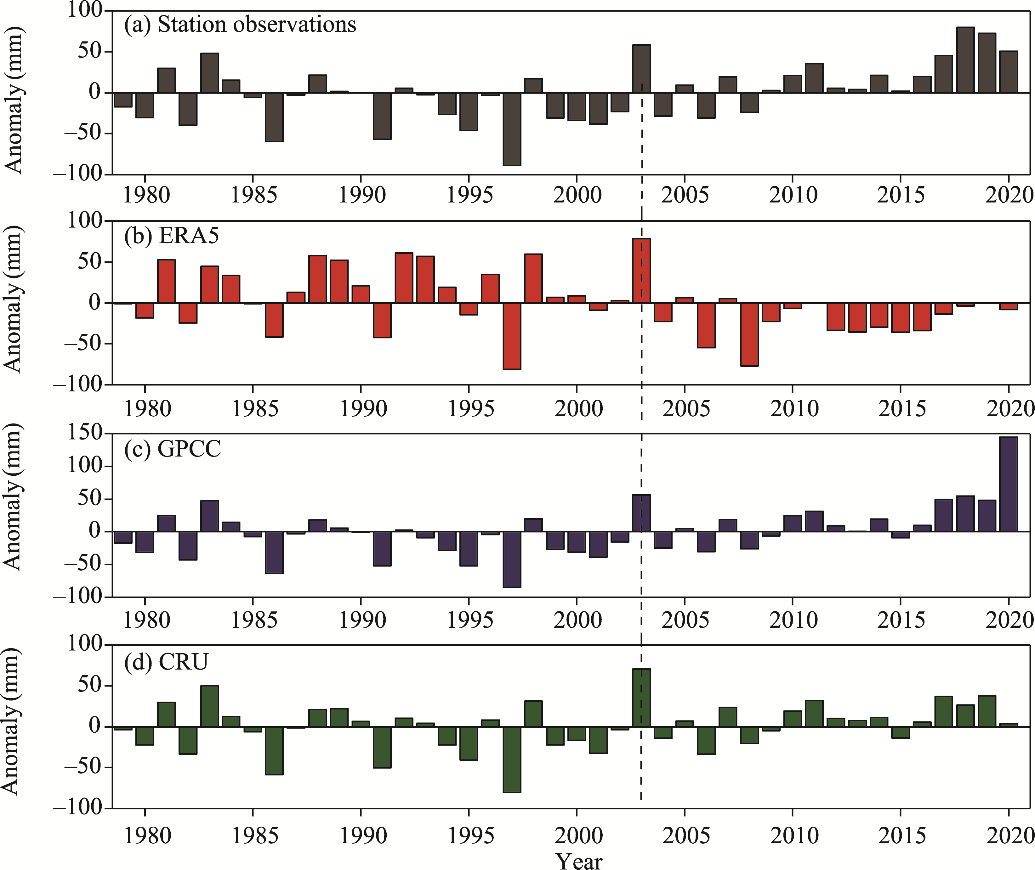
Abstract Precipitation plays a crucial role in the water cycle of Northwest China. Obtaining accurate precipitation data is crucial for regional water resource management, hydrological forecasting, flood control and drought relief. Currently, the applicability of multi-source precipitation products for long time series in Northwest China has not been thoroughly evaluated. In this study, precipitation data from 183 meteorological stations in Northwest China from 1979 to 2020 were selected to assess the regional applicability of four precipitation products (the fifth generation of European Centre for Medium-Range Weather Forecasts (ECMWF) atmospheric reanalysis of the global climate (ERA5), Global Precipitation Climatology Centre (GPCC), Climatic Research Unit gridded Time Series Version 4.07 (CRU TS v4.07, hereafter CRU), and Tropical Rainfall Measuring Mission (TRMM)) based on the following statistical indicators: correlation coefficient, root mean square error (RMSE), relative bias (RB), mean absolute error (MAE), probability of detection (POD), false alarm ratio (FAR), and equitable threat score (ETS). The results showed that precipitation in Northwest China was generally high in the east and low in the west, and exhibited an increasing trend from 1979 to 2020. Compared with the station observations, ERA5 showed a larger spatial distribution difference than the other products. The overall overestimation of multi-year average precipitation was approximately 200.00 mm and the degree of overestimation increased with increasing precipitation intensity. The multi-year average precipitation of GPCC and CRU was relatively close to that of station observations. The trend of annual precipitation of TRMM was overestimated in high-altitude regions and the eastern part of Lanzhou with more precipitation. At the monthly scale, GPCC performed well but underestimated precipitation in the Tarim Basin (RB= -4.11%), while ERA5 and TRMM exhibited poor accuracy in high-altitude regions. ERA5 had a large bias (RB≥120.00%) in winter months and a strong dispersion (RMSE≥35.00 mm) in summer months. TRMM showed a relatively low correlation with station observations in winter months (correlation coefficients≤0.70). The capture performance analysis showed that ERA5, GPCC, and TRMM had lower POD and ETS values and higher FAR values in Northwest China as the precipitation intensity increased. ERA5 showed a high capture performance for small precipitation events and a slower decreasing trend of POD as the precipitation intensity increased. GPCC had the lowest FAR values. TRMM was statistically ineffective for predicting the occurrence of daily precipitation events. The findings provide a reference for data users to select appropriate datasets in Northwest China and for data developers to develop new precipitation products in the future.
|
|
Received: 06 March 2024
Published: 30 September 2024
|
|
|
|
Corresponding Authors:
*XU Min (E-mail: xumin@lzb.ac.cn)
|
|
|
| [1] |
Anjum M N, Ahmad I, Ding Y J, et al. 2019. Assessment of IMERG-V06 precipitation product over different hydro-climatic regimes in the Tianshan Mountains, North-Western China. Remote Sensing, 11(19): 2314, doi: 10.3390/rs11192314.
|
|
|
| [2] |
Bao X H, Zhang F Q. 2013. Evaluation of NCEP-CFSR, NCEP-NCAR, ERA-Interim, and ERA-40 reanalysis datasets against independent sounding observations over the Tibetan Plateau. Journal of Climate, 26(1): 206-214.
|
|
|
| [3] |
Betts A K, Zhao M, Dirmeyer P A, et al. 2006. Comparison of ERA40 and NCEP/DOE near-surface data sets with other ISLSCP-II data sets. Journal of Geophysical Research: Atmospheres, 111(D22): D22S04, doi: 10.1029/2006JD007174.
|
|
|
| [4] |
Chen S, Hong Y, Cao Q, et al. 2013. Performance evaluation of radar and satellite rainfalls for Typhoon Morakot over Taiwan: Are remote-sensing products ready for gauge denial scenario of extreme events? Journal of Hydrology, 506: 4-13.
|
|
|
| [5] |
Curtarelli M P, Rennó C D, Alcântara E H. 2014. Evaluation of the Tropical Rainfall Measuring Mission 3B 43 product over an inland area in Brazil and the effects of satellite boost on rainfall estimates. Journal of Applied Remote Sensing, 8(1): 083589, doi: 10.1117/1.JRS.8.083589.
|
|
|
| [6] |
Ding G X, Guo J L, Tang Z Y, et al. 2022. Evaluation on applicability of various reanalysis datasets of precipitation in Changjiang River Basin. Yangtze River, 53(9): 72-79. (in Chinese)
|
|
|
| [7] |
Ding Y H, Liu Y J, Xu Y, et al. 2023. Regional responses to global climate change: Progress and prospects for trend, causes, and projection of climatic warming-wetting in Northwest China. Advances in Earth Science, 38(6): 551-562. (in Chinese)
doi: 10.11867/j.issn.1001-8166.2023.027
|
|
|
| [8] |
Dinku T, Ceccato P, Grover-Kopec E, et al. 2007. Validation of satellite rainfall products over East Africa's complex topography. International Journal of Remote Sensing, 28(7): 1503-1526.
|
|
|
| [9] |
Dinku T, Connor S J, Ceccato P. 2010. Comparison of CMORPH and TRMM-3B42 over mountainous regions of Africa and South America. In: Gebremichael M, Hossain F. Satellite Rainfall Applications for Surface Hydrology. Dordrecht: Springer, 193-204.
|
|
|
| [10] |
Dou X K, Liu W S, Amayenc P, et al. 2000. Impacts of nonuniform beam filling on spaceborne rain radar algorithms. Chinese Journal of Atmospheric Sciences, 24(4): 568-576. (in Chinese)
|
|
|
| [11] |
Ebert E E, Janowiak J E, Kidd C. 2007. Comparison of near-real-time precipitation estimates from satellite observations and numerical models. Bulletin of the American Meteorological Society, 88(1): 47-64.
|
|
|
| [12] |
Fu Y, Xia J Z, Yuan W P, et al. 2016. Assessment of multiple precipitation products over major river basins of China. Theoretical and Applied Climatology, 123(1): 11-22.
|
|
|
| [13] |
Gulakhmadov A, Chen X, Gulakhmadov M, et al. 2021. Evaluation of the CRU TS3.1, APHRODITE_V1101, and CFSR datasets in assessing water balance components in the Upper Vakhsh River Basin in Central Asia. Atmosphere, 12(12): 1641, doi: 10.3390/atmos12121641.
|
|
|
| [14] |
Huang X L, Wu W, Xu J H, et al. 2023. The applicability performance of the ERA5-Land precipitation datasets in Southwest China. Plateau Meteorology, 42(6): 1562-1575. (in Chinese)
doi: 10.7522/j.issn.1000-0534.2023.00012
|
|
|
| [15] |
Ji X, Luo Y. 2013. Quality assessment of the TRMM precipitation data in Mid Tianshan Mountains. Arid Land Geography, 36(2): 253-262. (in Chinese)
|
|
|
| [16] |
Jiao D L, Xu N N, Yang F, et al. 2021. Evaluation of spatial-temporal variation performance of ERA 5 precipitation data in China. Scientific Reports, 11: 17956, doi: 10.1038/s41598-021-97432-y.
|
|
|
| [17] |
Jin P W, Zhang H L, Li H, et al. 2023. Inter comparisons of global precipitation datasets in global river basins. Water Resources and Power, 41(5): 10-14. (in Chinese)
|
|
|
| [18] |
Joyce R J, Janowiak J E, Arkin P A, et al. 2004. CMORPH: A method that produces global precipitation estimates from passive microwave and infrared data at high spatial and temporal resolution. Journal of Hydrometeorology, 5(3): 487-503.
|
|
|
| [19] |
Kidd C, Becker A, Huffman G J, et al. 2016. So, how much of the Earth's surface is covered by rain gauges? Bulletin of the American Meteorological Society, 98(1): 69-78.
|
|
|
| [20] |
Li Y Z, Zhuang J C, Bai P, et al. 2022. Improving and comprehensive evaluation precipitation estimation by merging multi-satellite precipitation products in different climate regions of China. Geographical Research, 41(12): 3335-3351. (in Chinese)
|
|
|
| [21] |
Liao R W, Zhang D B, Shen Y. 2015. Validation of six satellite-derived rainfall estimates over China. Meteorological Monthly, 41(8): 970-979. (in Chinese)
|
|
|
| [22] |
Liu T T, Zhu X F, Guo R, et al. 2022. Applicability of ERA 5 reanalysis of precipitation data in China. Arid Land Geography, 45(1): 66-79. (in Chinese)
|
|
|
| [23] |
Luan L, Zhai P M. 2023. Changes in rainy season precipitation properties over the Qinghai-Tibet Plateau based on multi-source datasets. Climate Change Research, 19(2): 173-190. (in Chinese)
|
|
|
| [24] |
Ma L J, Zhang T J, Frauenfeld O W, et al. 2009. Evaluation of precipitation from the ERA-40, NCEP-1, and NCEP-2 Reanalyses and CMAP-1, CMAP-2, and GPCP-2 with ground-based measurements in China. Journal of Geophysical Research: Atmospheres, 114(D9): D09105, doi: 10.1029/2008jd011178.
|
|
|
| [25] |
Nan T Y, Chen J, Ding Z W, et al. 2023. Deep learning-based multi-source precipitation merging for the Tibetan Plateau. Science China Earth Sciences, 66(4): 852-870.
|
|
|
| [26] |
Ruane A C, Roads J O. 2007. 6-hour to 1-year variance of five global precipitation sets. Earth Interactions, 11(11): 1-29.
|
|
|
| [27] |
Shao C K, Yang K, Tang W J, et al. 2022. Convolutional neural network-based homogenization for constructing a long-term global surface solar radiation dataset. Renewable and Sustainable Energy Reviews, 169: 112952, doi: 10.1016/j.rser.2022.112952.
|
|
|
| [28] |
Shen L L, Yang Y F, Bai L, et al. 2022. Accuracy evaluation of multi-source precipitation data in the middle and upper reaches of the Yellow River. Water Resources and Power, 40(2): 1-5. (in Chinese)
|
|
|
| [29] |
Shi Y J, Wang Z J, Suo Y. 2022. Evaluation of Haihe River basin precipitation resources based on multisource data fusion. Advance in Water Science, 33(4): 602-613. (in Chinese)
|
|
|
| [30] |
Sorooshian S, Hsu K L, Gao X G, et al. 2000. Evaluation of PERSIANN system satellite-based estimates of tropical rainfall. Bulletin of the American Meteorological Society, 81(9): 2035-2046.
|
|
|
| [31] |
Sun Q H, Miao C Y, Duan Q Y, et al. 2018. A review of global precipitation data sets: Data sources, estimation, and inter-comparisons. Reviews of Geophysics, 56(1): 79-107.
|
|
|
| [32] |
Tarek M, Brissette F P, Arsenault R. 2020. Evaluation of the ERA 5 reanalysis as a potential reference dataset for hydrological modelling over North America. Hydrology and Earth System Sciences, 24(5): 2527-2544.
|
|
|
| [33] |
Taylor K E. 2001. Summarizing multiple aspects of model performance in a single diagram. Journal of Geophysical Research: Atmospheres, 106(D7): 7183-7192.
|
|
|
| [34] |
Tian F Q, Hou S Y, Yang L, et al. 2018. How does the evaluation of GPM IMERG rainfall product depend on gauge density and rainfall intensity? Journal of Hydrometeorology, 19(2): 339-349.
|
|
|
| [35] |
Tuttle J D, Carbone R E, Arkin P A. 2008. Comparison of ground-based radar and geosynchronous satellite climatologies of warm-season precipitation over the United States. Journal of Applied Meteorology and Climatology, 47(12): 3264-3270.
|
|
|
| [36] |
Wang Y W, Zhao N. 2022. Evaluation of eight high-resolution gridded precipitation products in the Heihe River Basin, Northwest China. Remote Sensing, 14(6): 1458, doi: 10.3390/rs14061458.
|
|
|
| [37] |
Wen T T, Guo Y X, Dong S R, et al. 2022. Assessment of CRU, ERA5, CMFD grid precipitation data for the Tibetan Plateau from 1979 to 2017. Arid Zone Research, 39(3): 684-697. (in Chinese)
doi: 10.13866/j.azr.2022.03.03
|
|
|
| [38] |
Widmann M, Bretherton C S. 2000. Validation of mesoscale precipitation in the NCEP reanalysis using a new gridcell dataset for the northwestern United States. Journal of Climate, 13(11): 1936-1950.
|
|
|
| [39] |
Wu Q X, Ma S Y, Zhang Z H, et al. 2019. Evaluation on the performance of five precipitation datasets of monthly precipitation in the upper reaches, middle and lower reaches of Shule River basin. Journal of Glaciology and Geocryology, 41(2): 470-482. (in Chinese)
doi: 10.7522/j.issn.1000-0240.2019.0022
|
|
|
| [40] |
Xia X R, Tian Y, Tan W L, et al. 2022. Evaluation of satellite precipitation products in China. Water Resources and Hydropower Engineering, 53(8): 29-40. (in Chinese)
|
|
|
| [41] |
Yang J H, Zhang Q, Liu X Y, et al. 2019. Spatial-temporal characteristics and causes of summer precipitation anomalies in the transitional zone of typical summer monsoon, China. Chinese Journal of Geophysics, 62(11): 4120-4128. (in Chinese)
|
|
|
| [42] |
You Q L, Min J Z, Zhang W, et al. 2015. Comparison of multiple datasets with gridded precipitation observations over the Tibetan Plateau. Climate Dynamics, 45(3-4): 791-806.
|
|
|
| [43] |
Zhang Q, Yang J H, Wang W, et al. 2021a. Climatic warming and humidification in the arid region of Northwest China: Process, multi-scale characteristics, and impacts on ecological vegetation. Journal of Meteorological Research, 35(1): 113-127.
|
|
|
| [44] |
Zhang Q, Zhu B, Yang J H, et al. 2021b. New characteristics about the climate humidification trend in Northwest China. Chinese Science Bulletin, 66(28-29): 3757-3771. (in Chinese)
|
|
|
| [45] |
Zhang Q, Yang J H, Duan X Y, et al. 2022. The eastward expansion of the climate humidification trend in northwest China since the start of this century and the synergistic influences on the circulation mechanism. Climate Dynamics, 59(7-8): 2481-2497.
|
|
|
| [46] |
Zhang Q, Yang J H, Wang P L, et al. 2023. Progress and prospect on climate warming and humidification in Northwest China. Chinese Science Bulletin, 68(14): 1814-1828. (in Chinese)
|
|
|
| [47] |
Zhang Y, Hanati G, Danierhan S, et al. 2020. Evaluation and comparison of daily GPM/TRMM precipitation products over the Tianshan Mountains in China. Water, 12(11): 3088, doi: 10.3390/w12113088.
|
|
|
| [48] |
Zhu H Q, Chen S, Li Z, et al. 2022. Comparison of satellite precipitation products: IMERG and GSMaP with rain gauge observations in Northern China. Remote Sensing, 14(19): 4748, doi: 10.3390/rs14194748.
|
|
|
|
Viewed |
|
|
|
Full text
|
|
|
|
|
Abstract
|
|
|
|
|
Cited |
|
|
|
|
| |
Shared |
|
|
|
|
| |
Discussed |
|
|
|
|