| Research article |
|


|
|
|
| Spatiotemporal variability of rain-on-snow events in the arid region of Northwest China |
YANG Zhiwei1,2, CHEN Rensheng1,*( ), LIU Zhangwen1, ZHAO Yanni1,2, LIU Yiwen1,2, WU Wentong1,2 ), LIU Zhangwen1, ZHAO Yanni1,2, LIU Yiwen1,2, WU Wentong1,2 |
1Qilian Alpine Ecology and Hydrology Research Station, Key Laboratory of Ecological Safety and Sustainable Development in Arid Lands, Northwest Institute of Eco-Environment and Resources, Chinese Academy of Sciences, Lanzhou 730000, China
2University of Chinese Academy of Sciences, Beijing 100049, China |
|
|
|
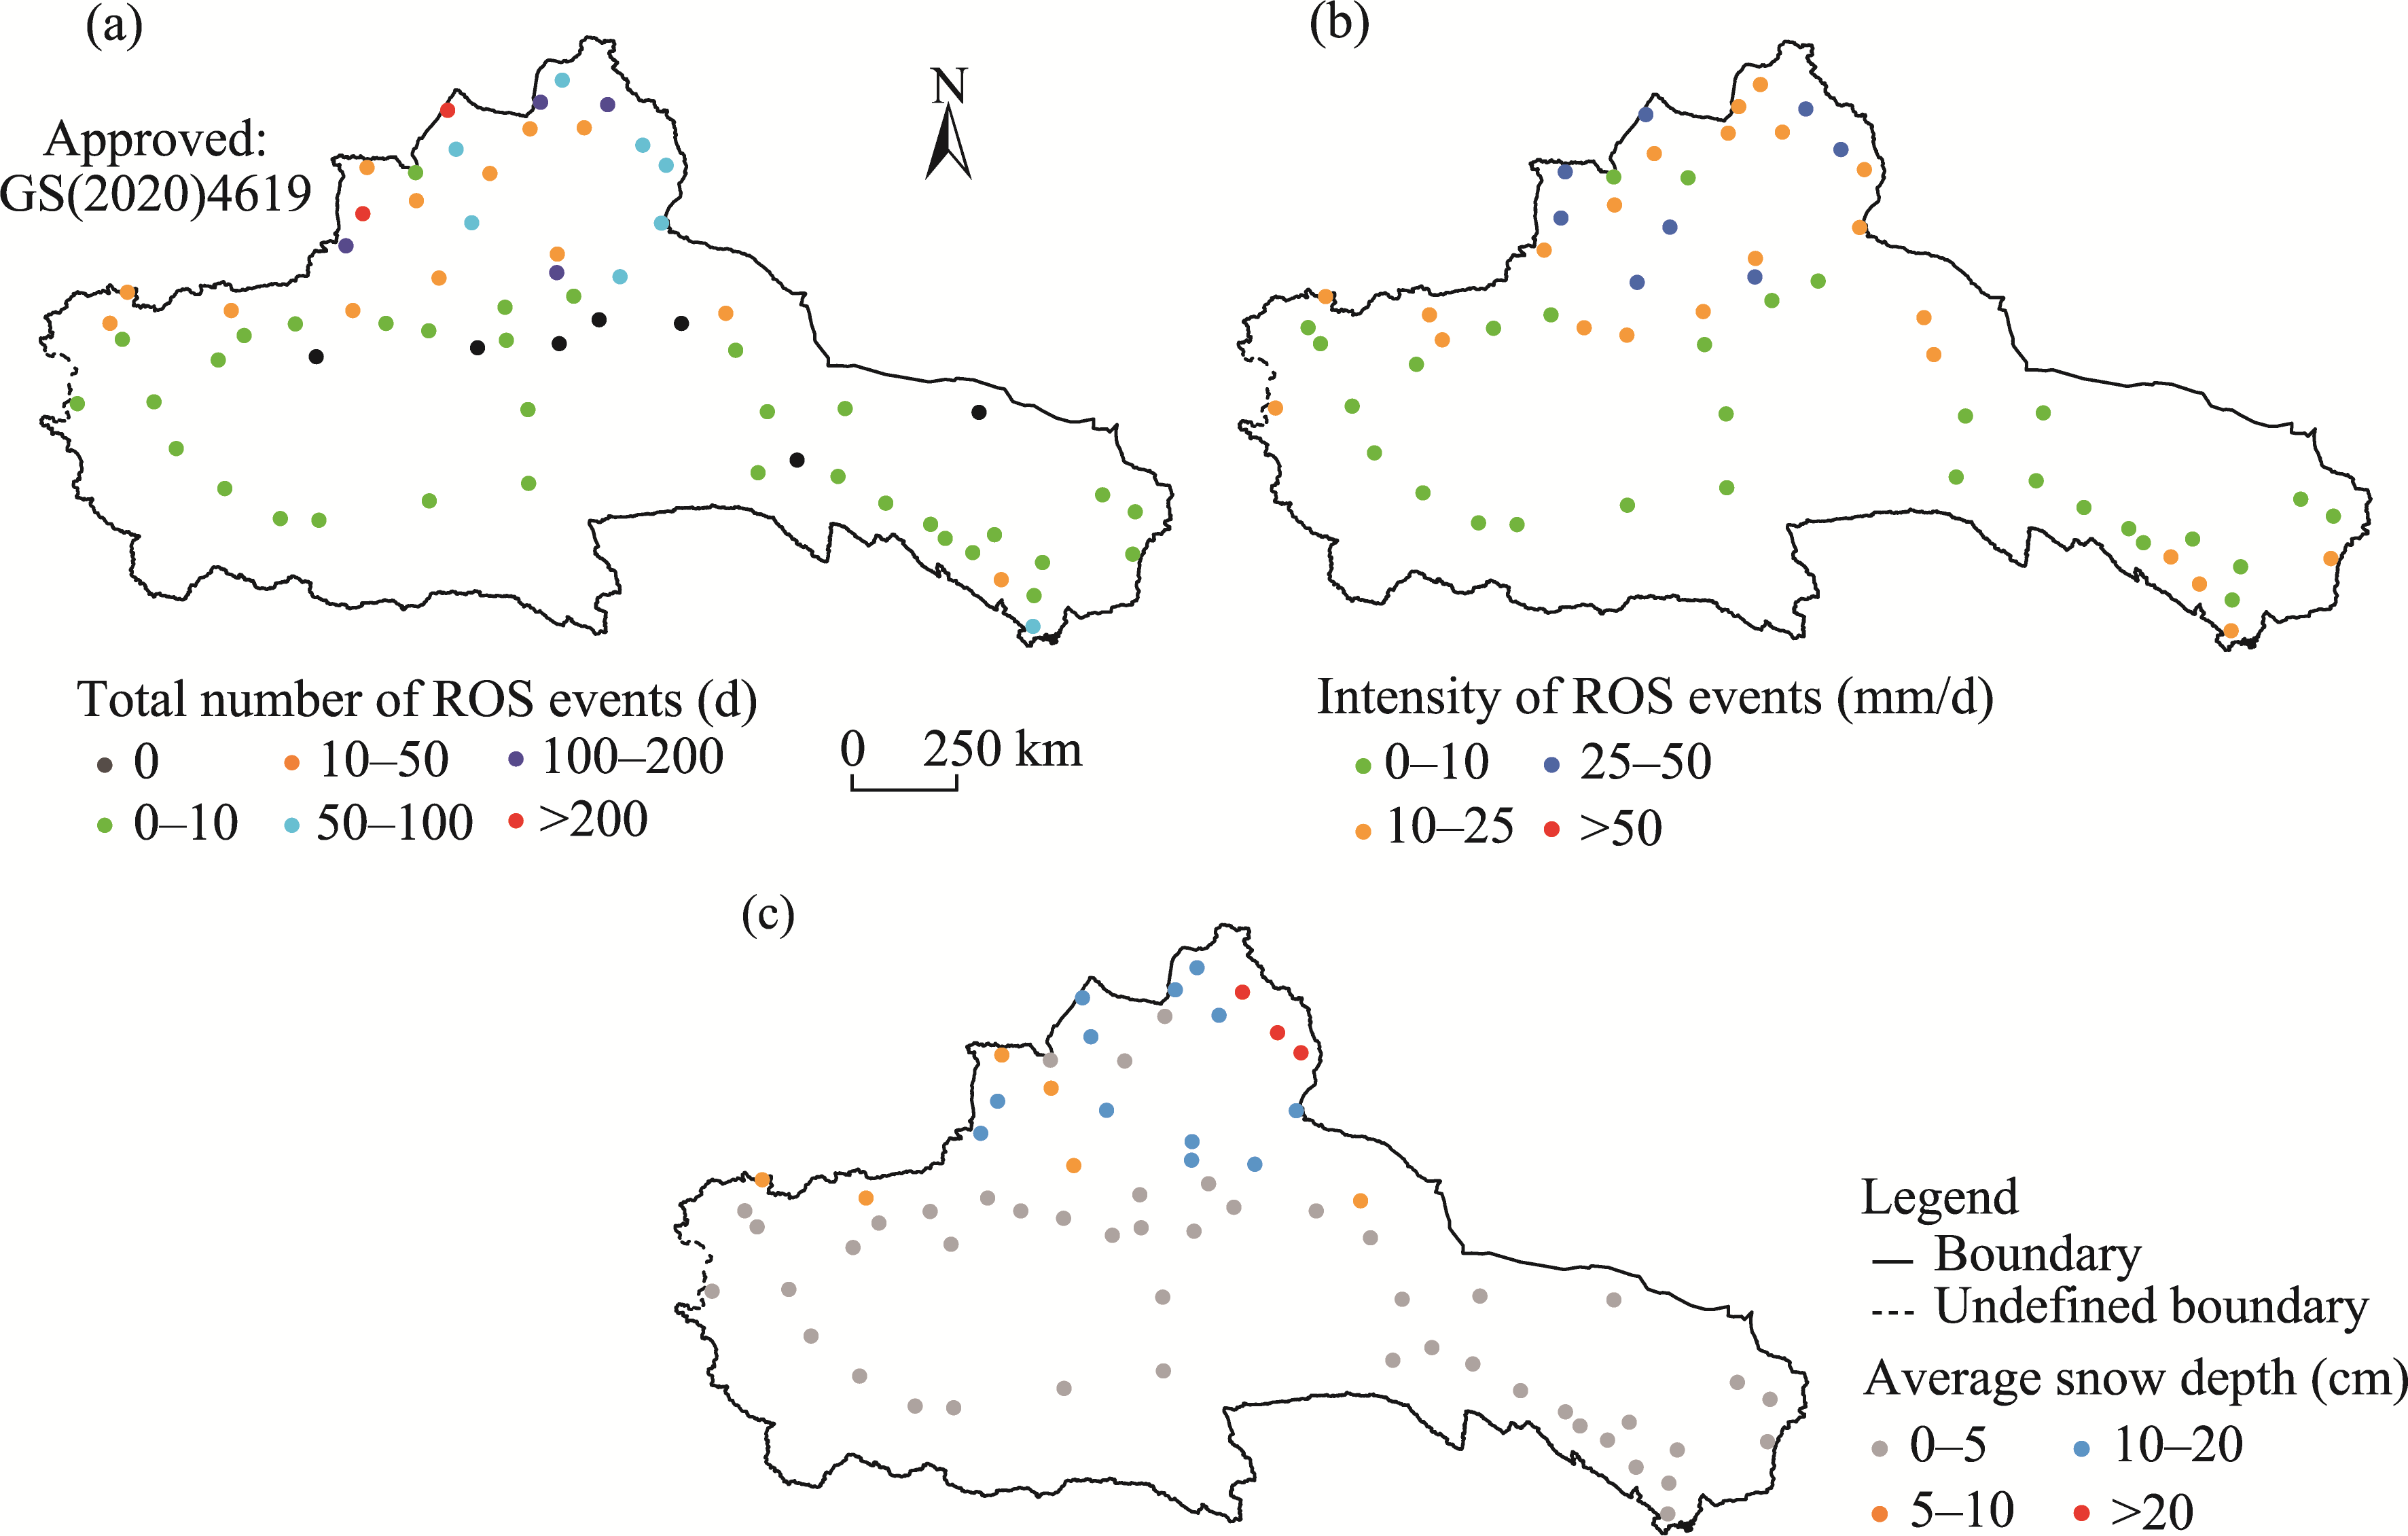
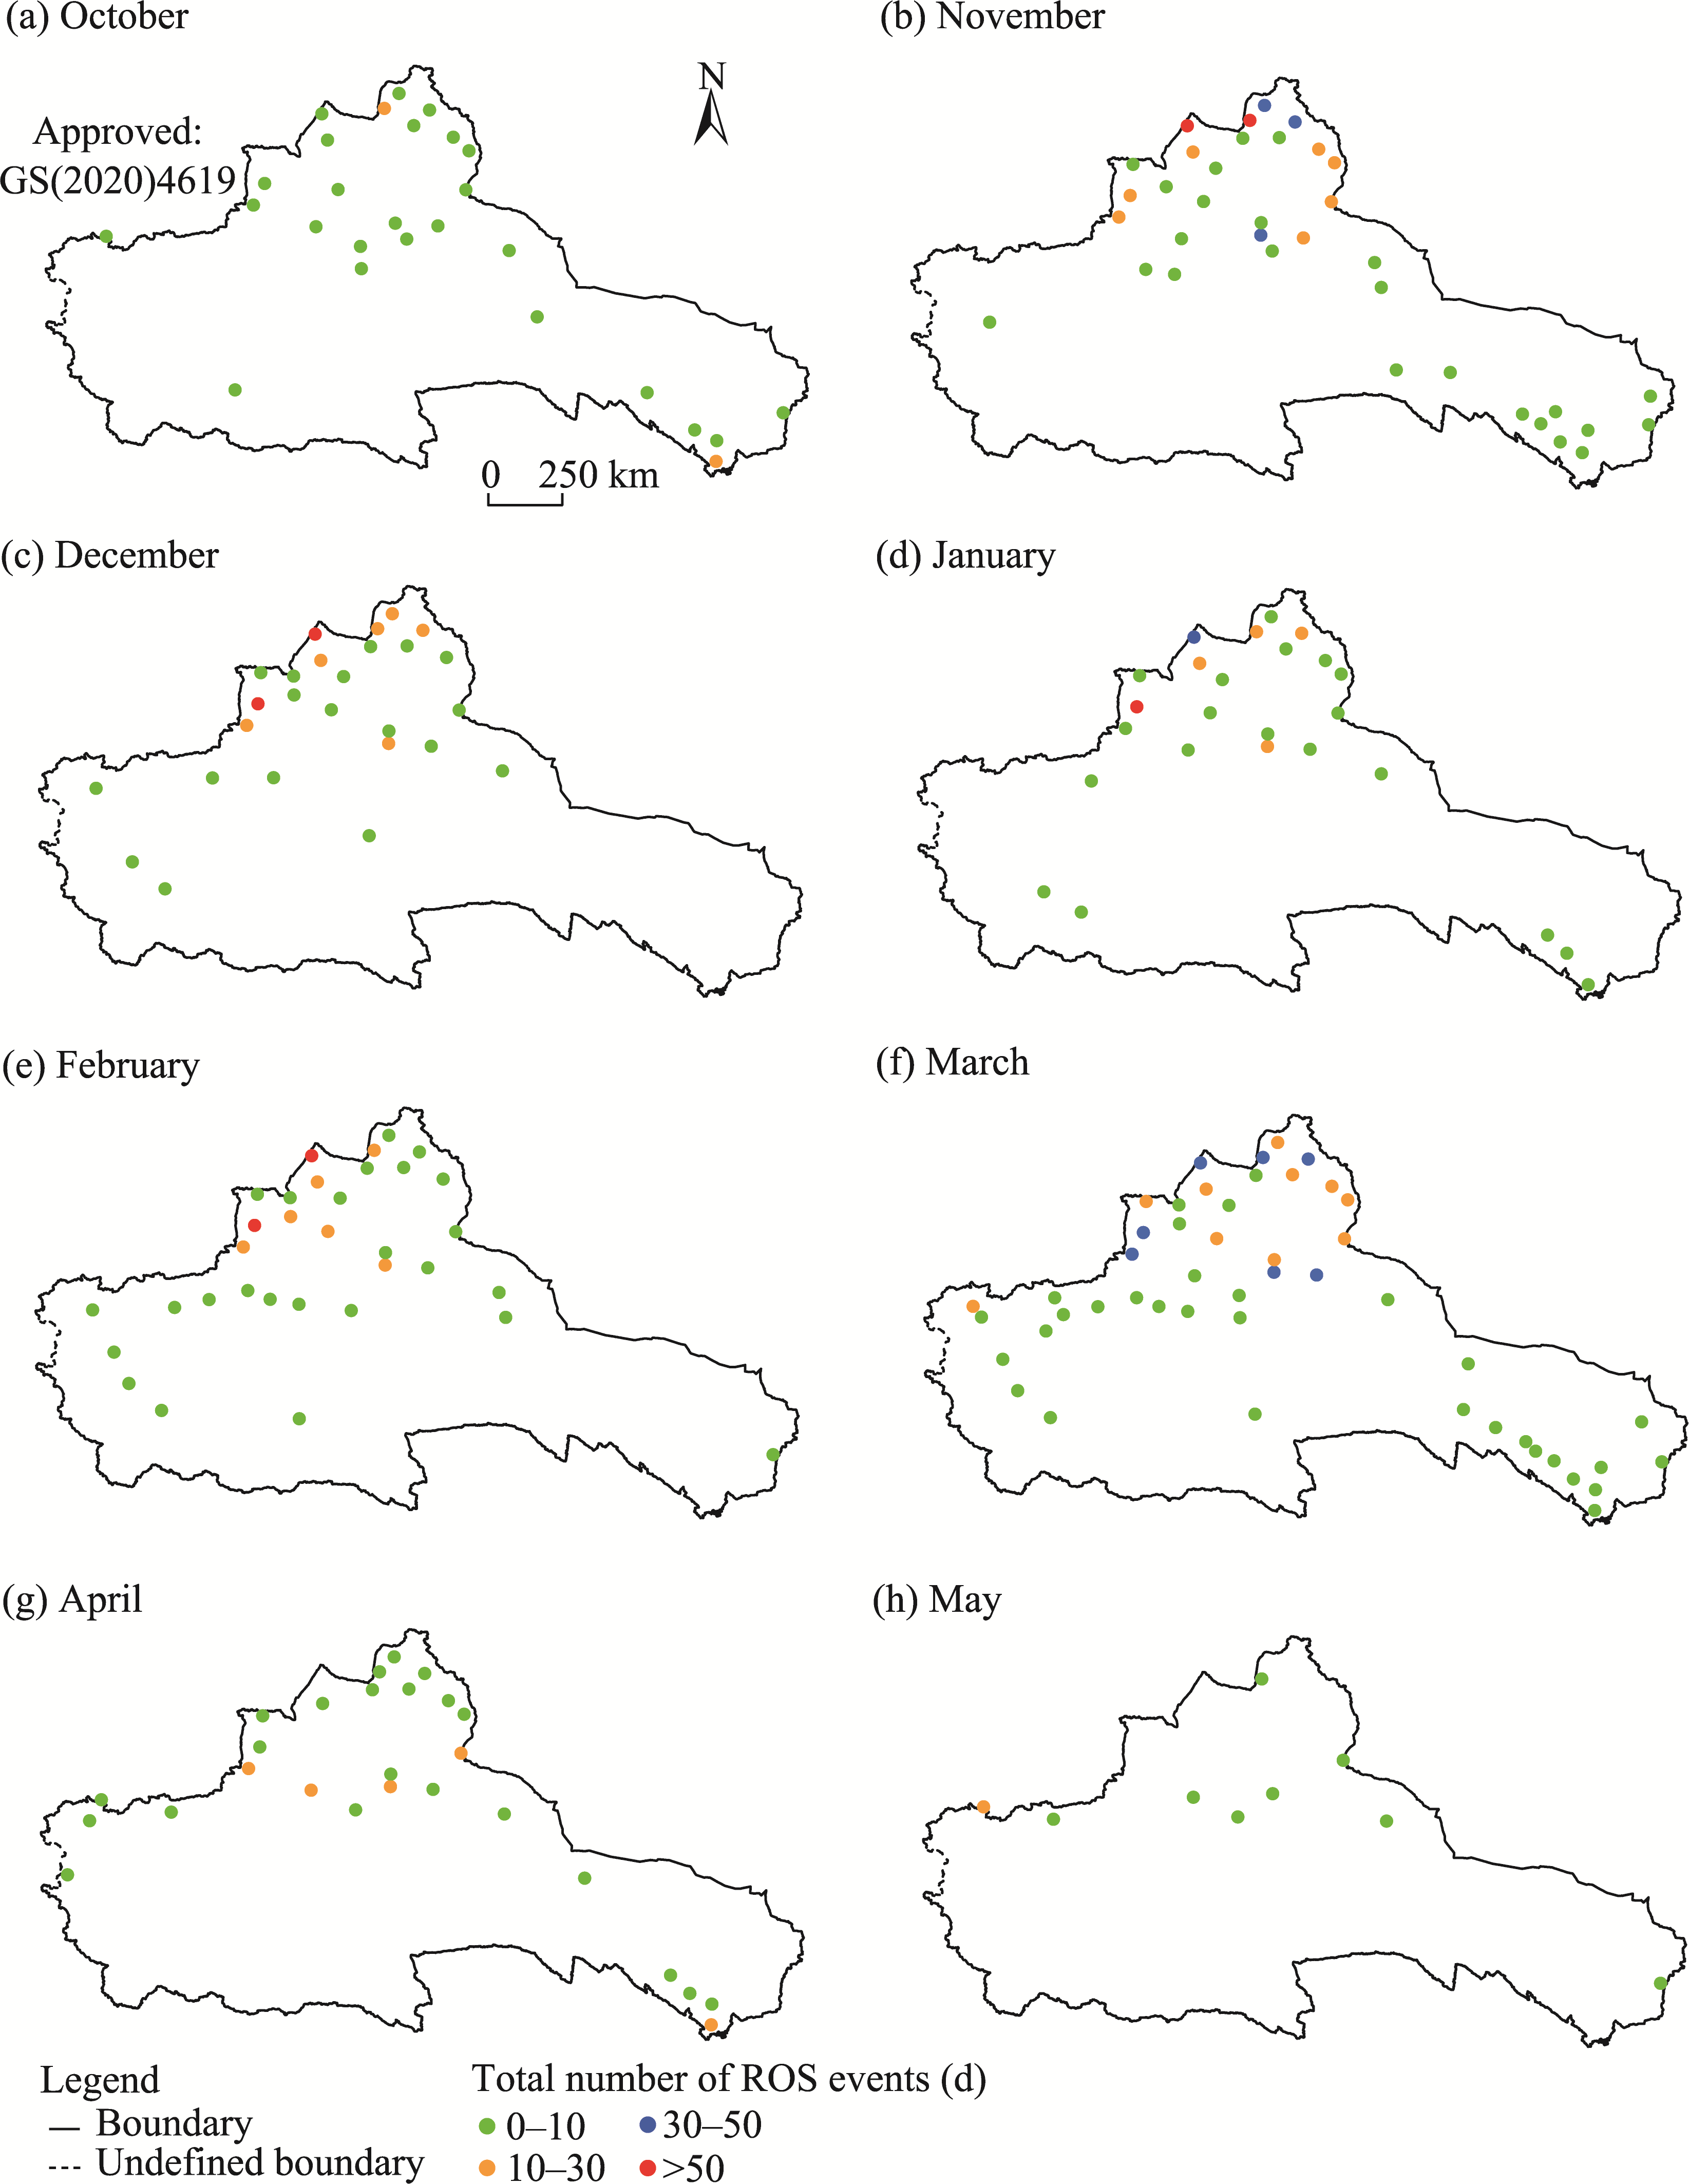
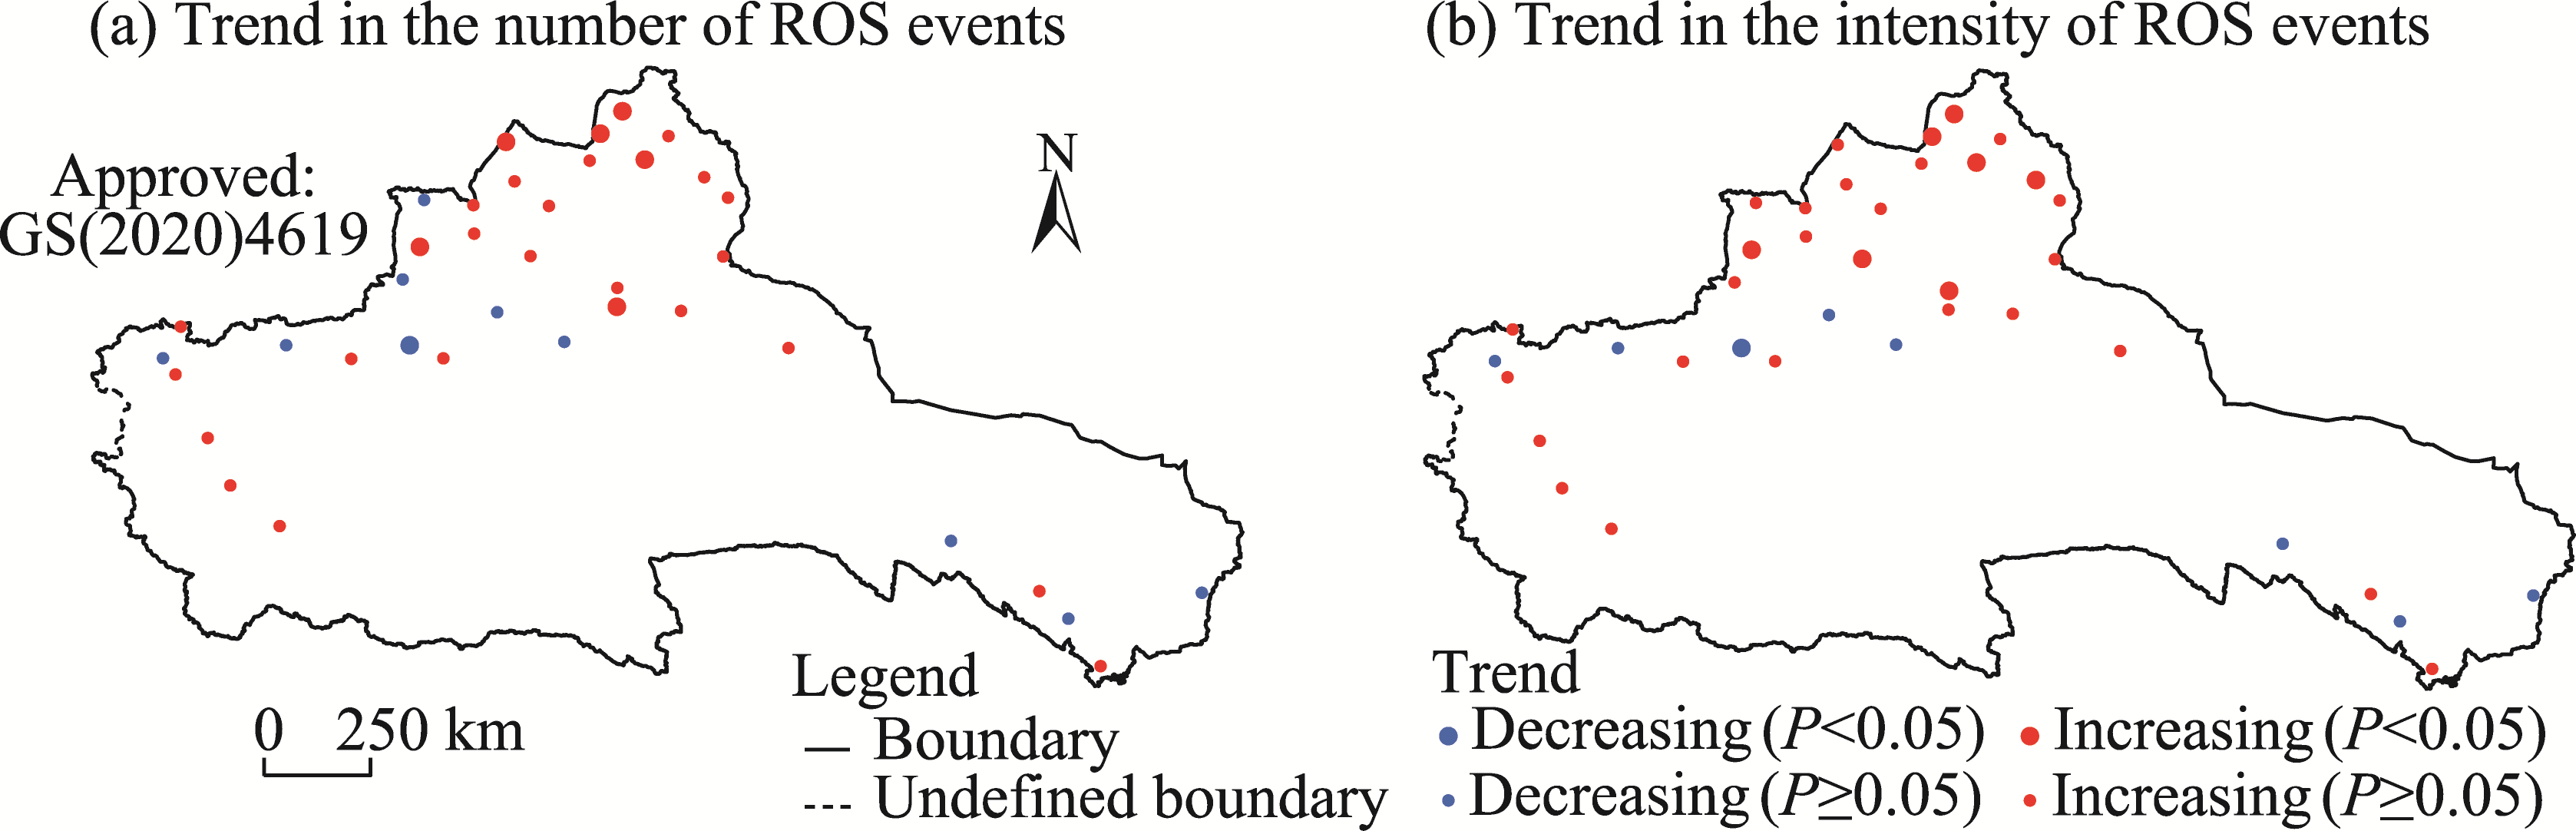
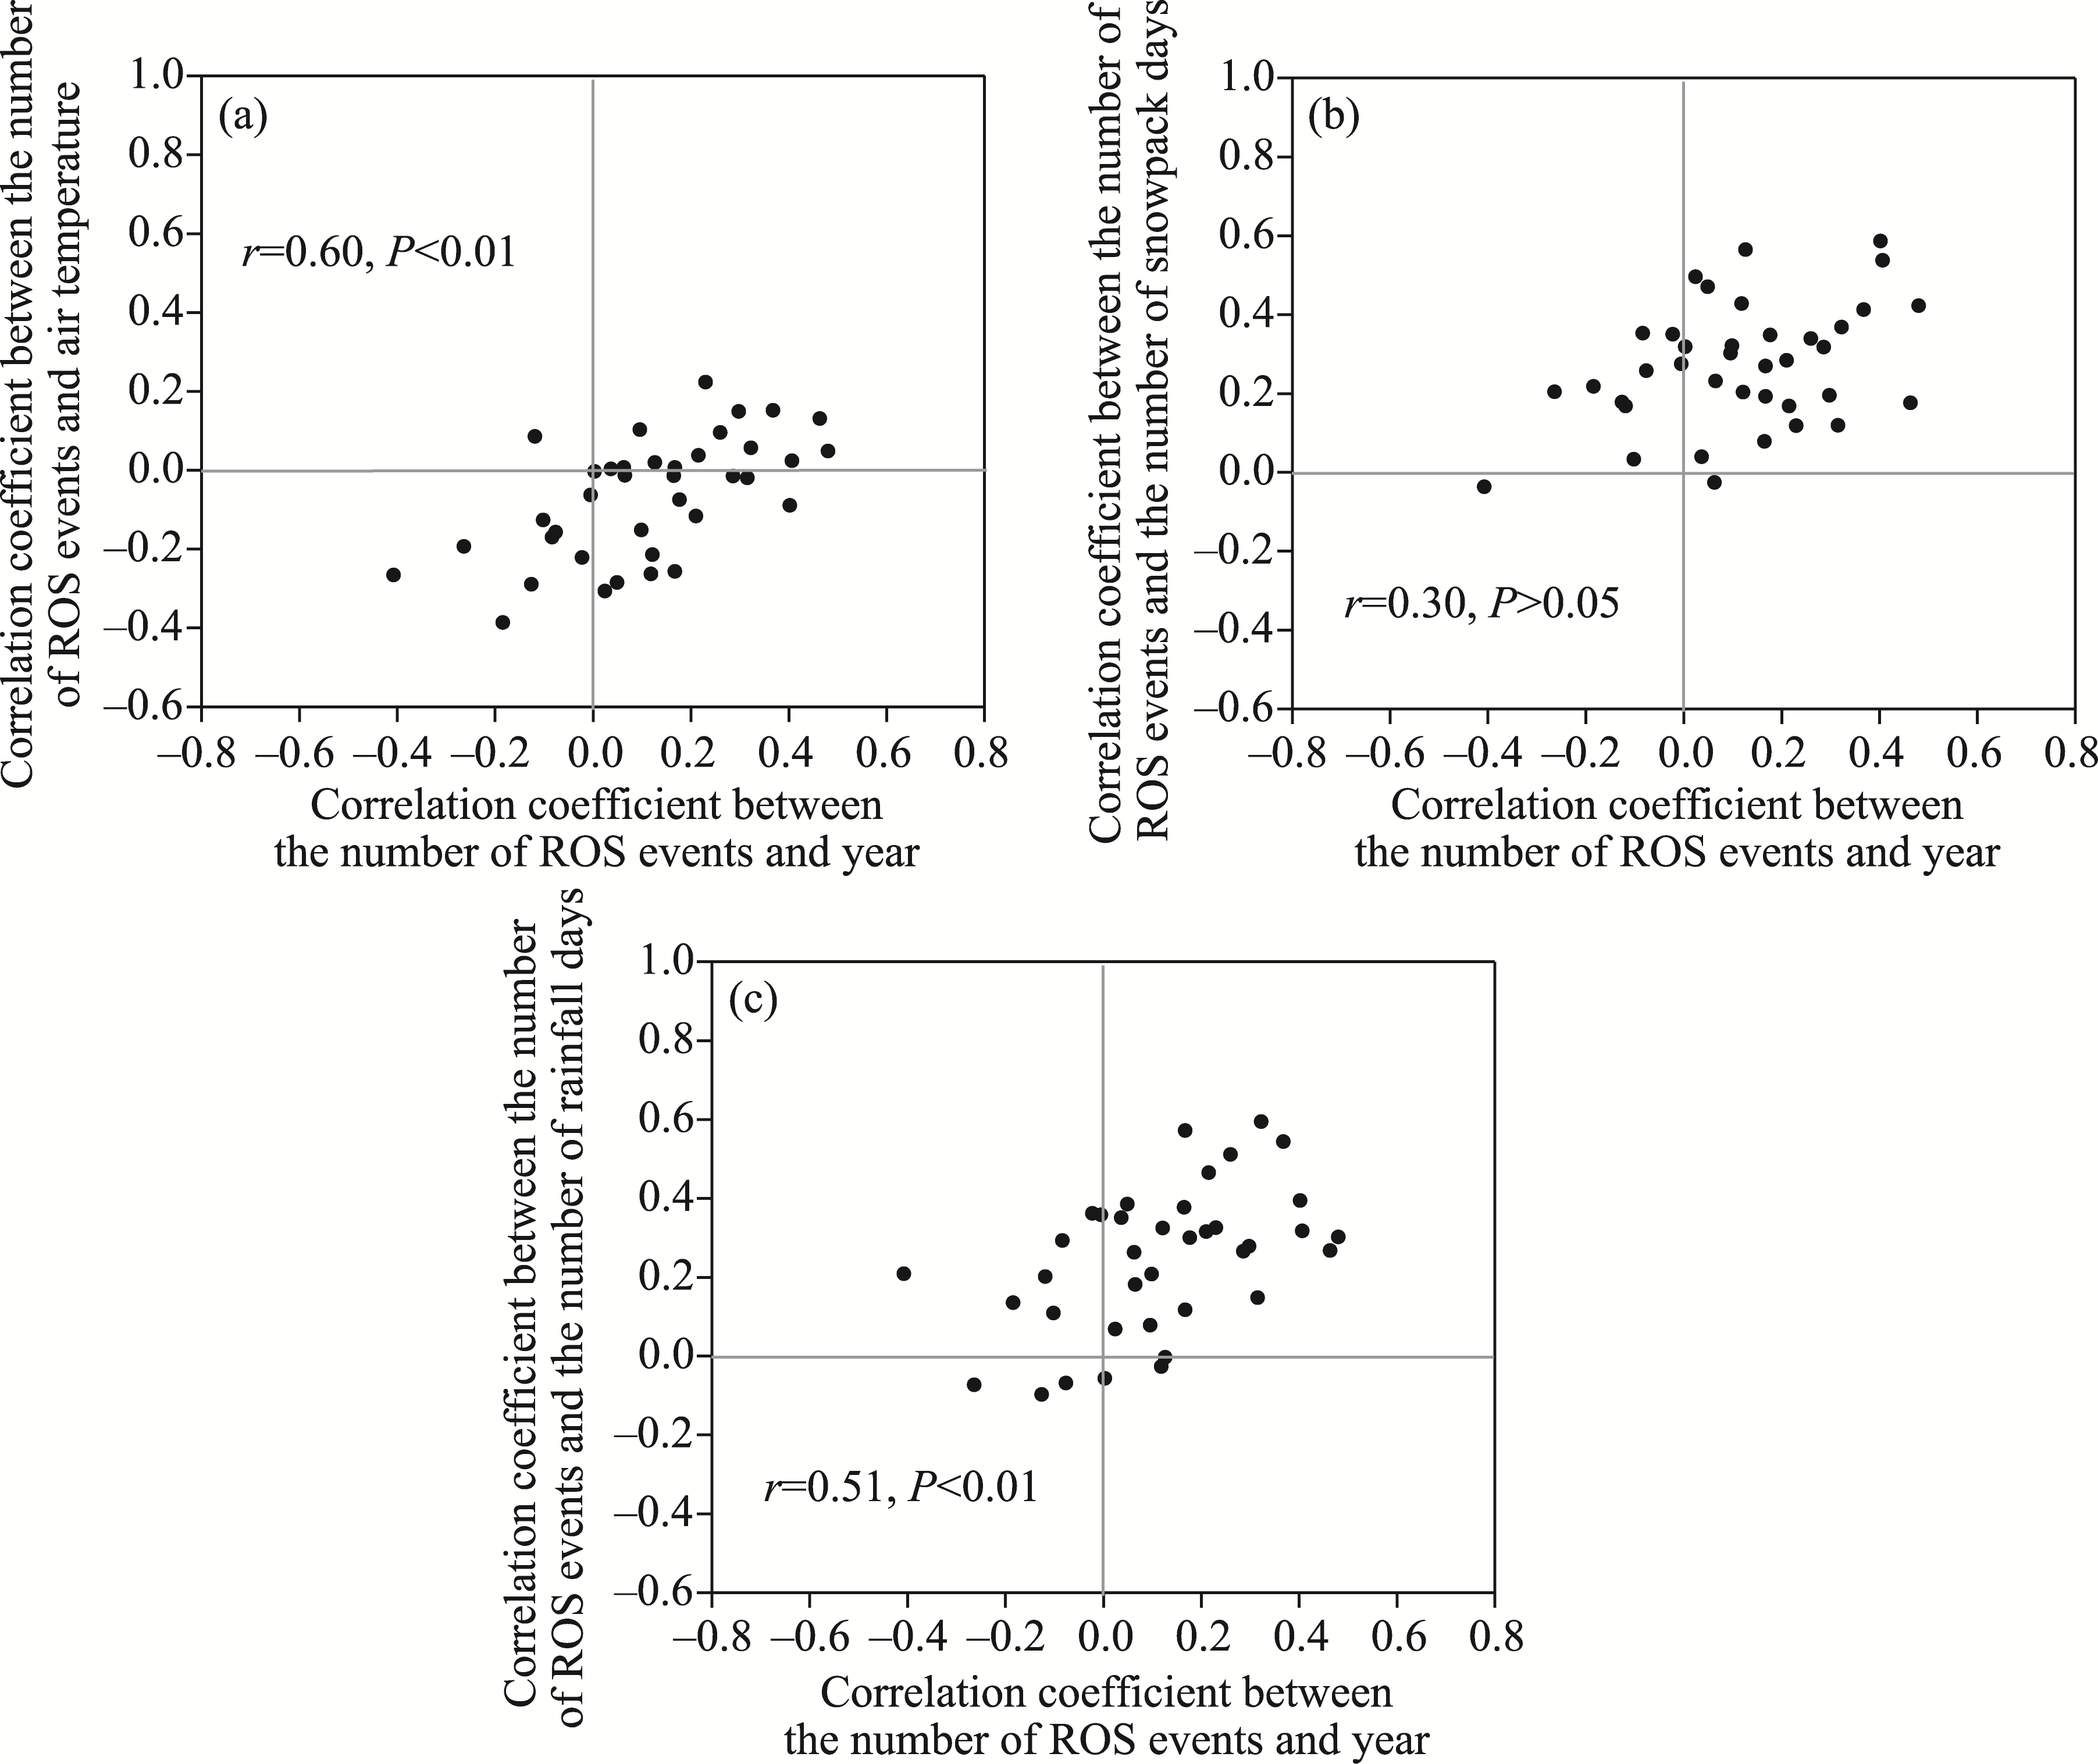
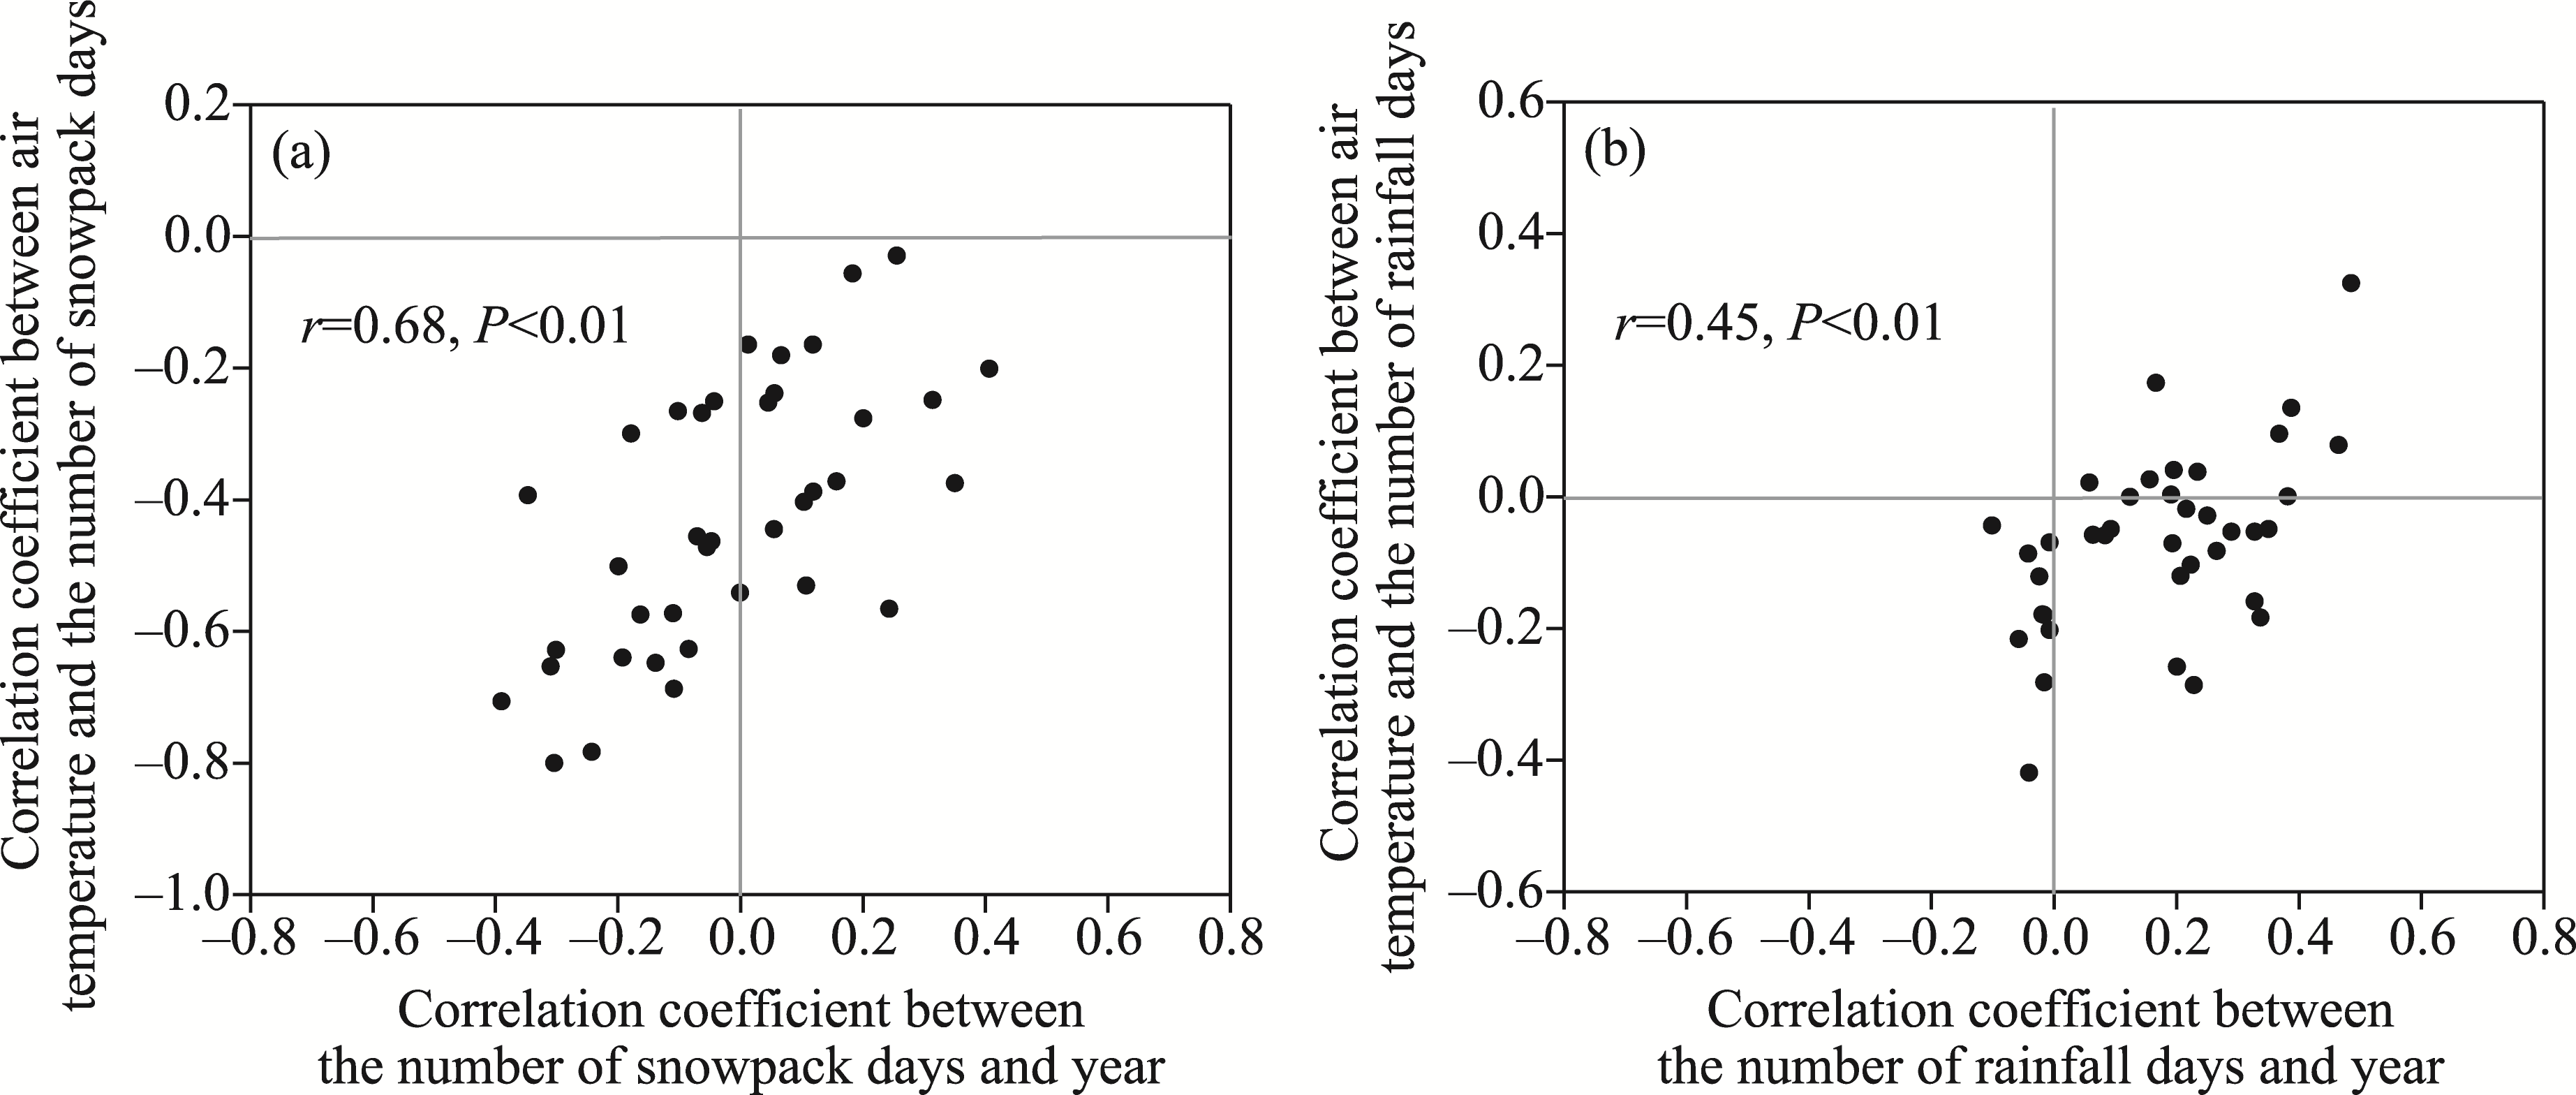
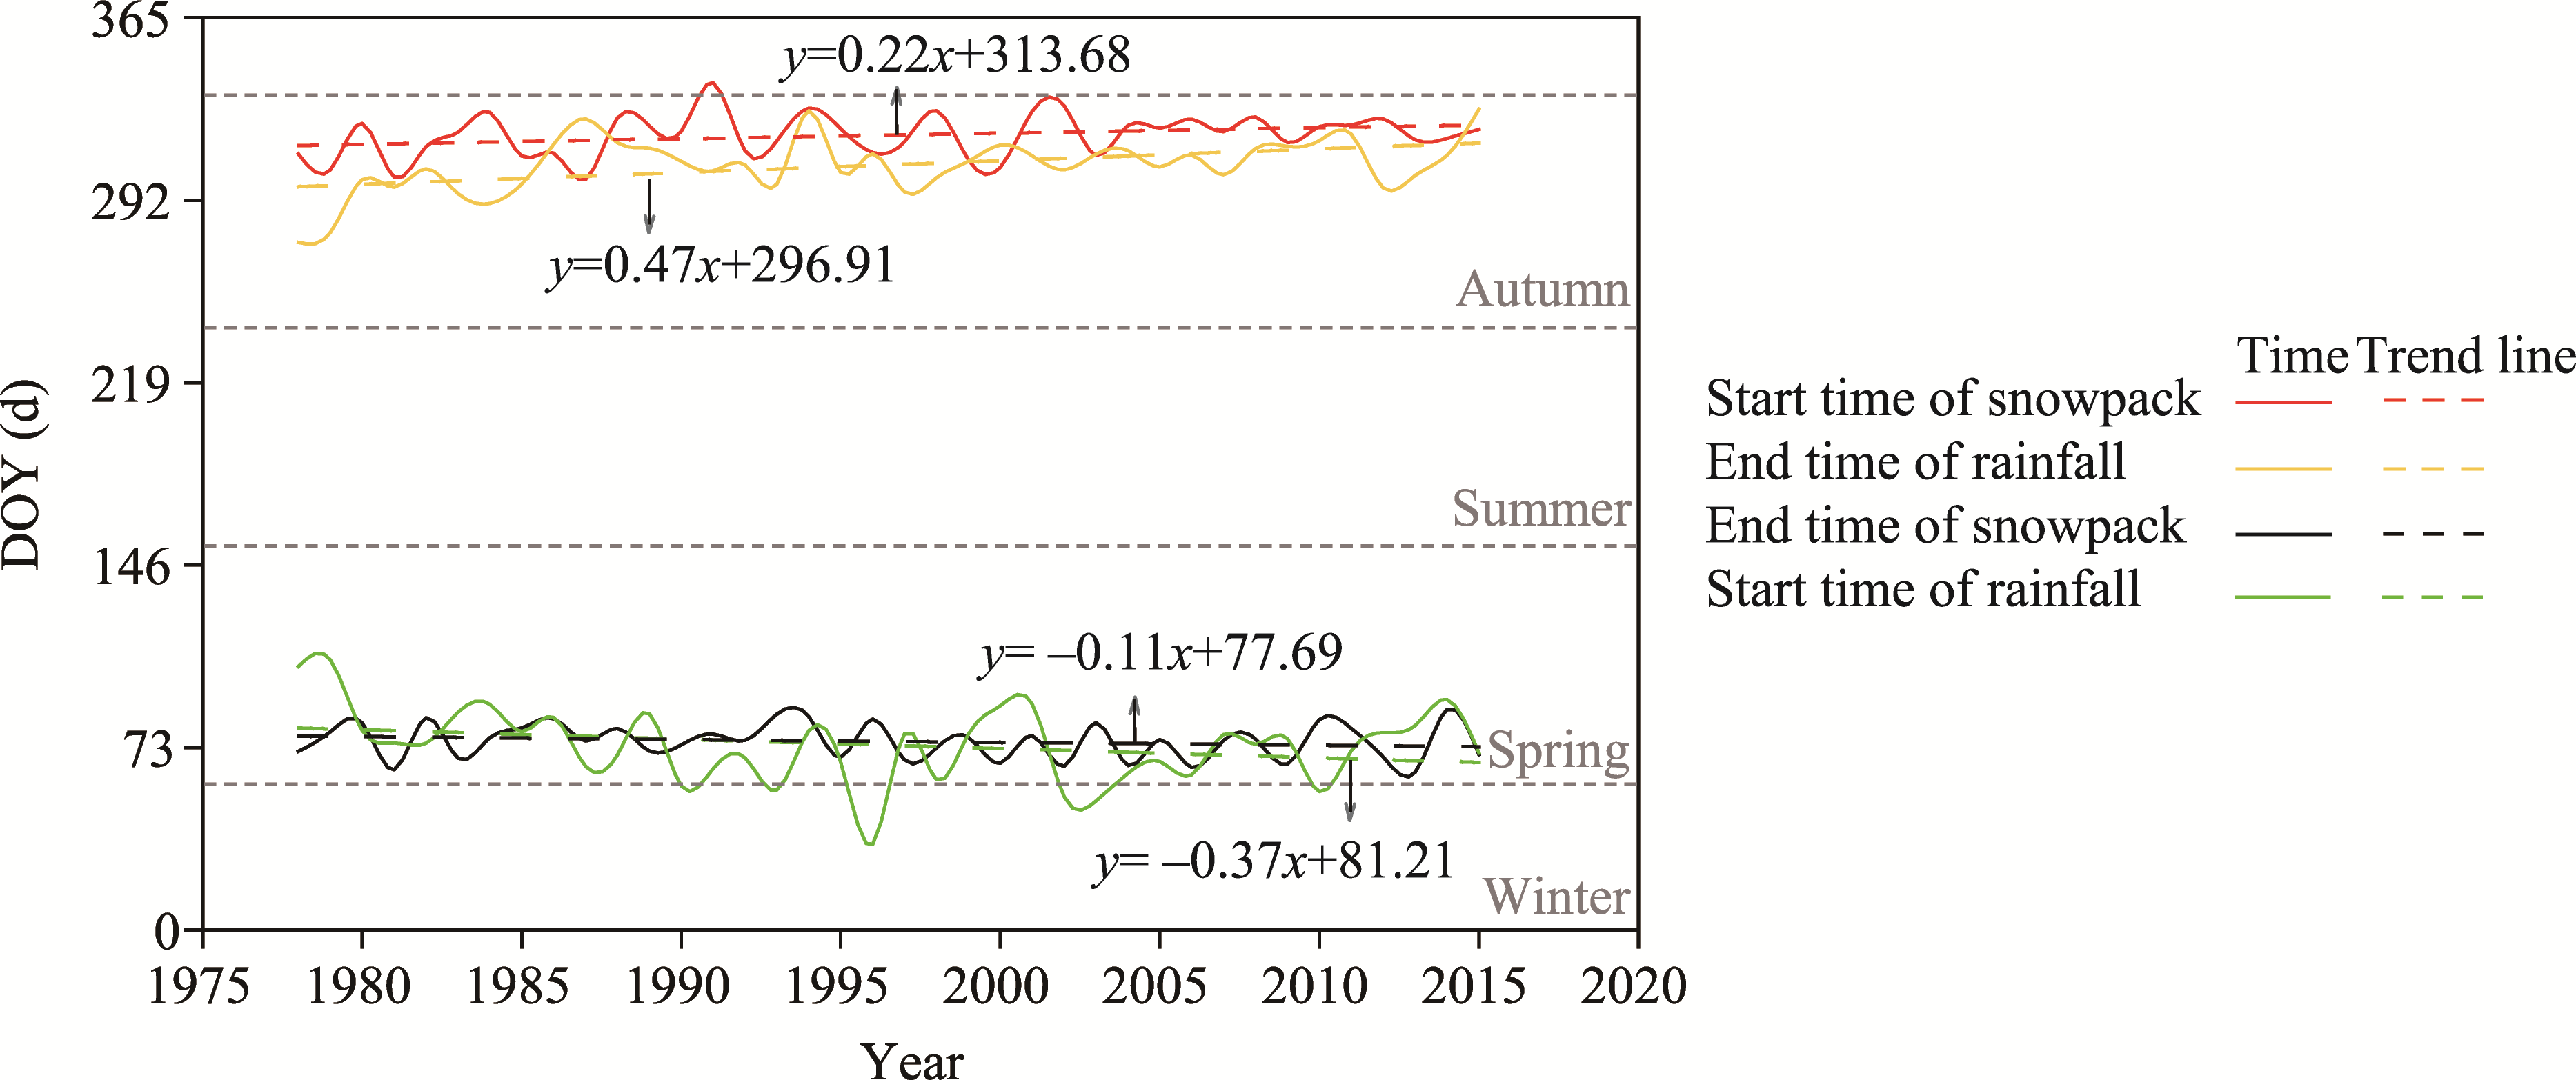
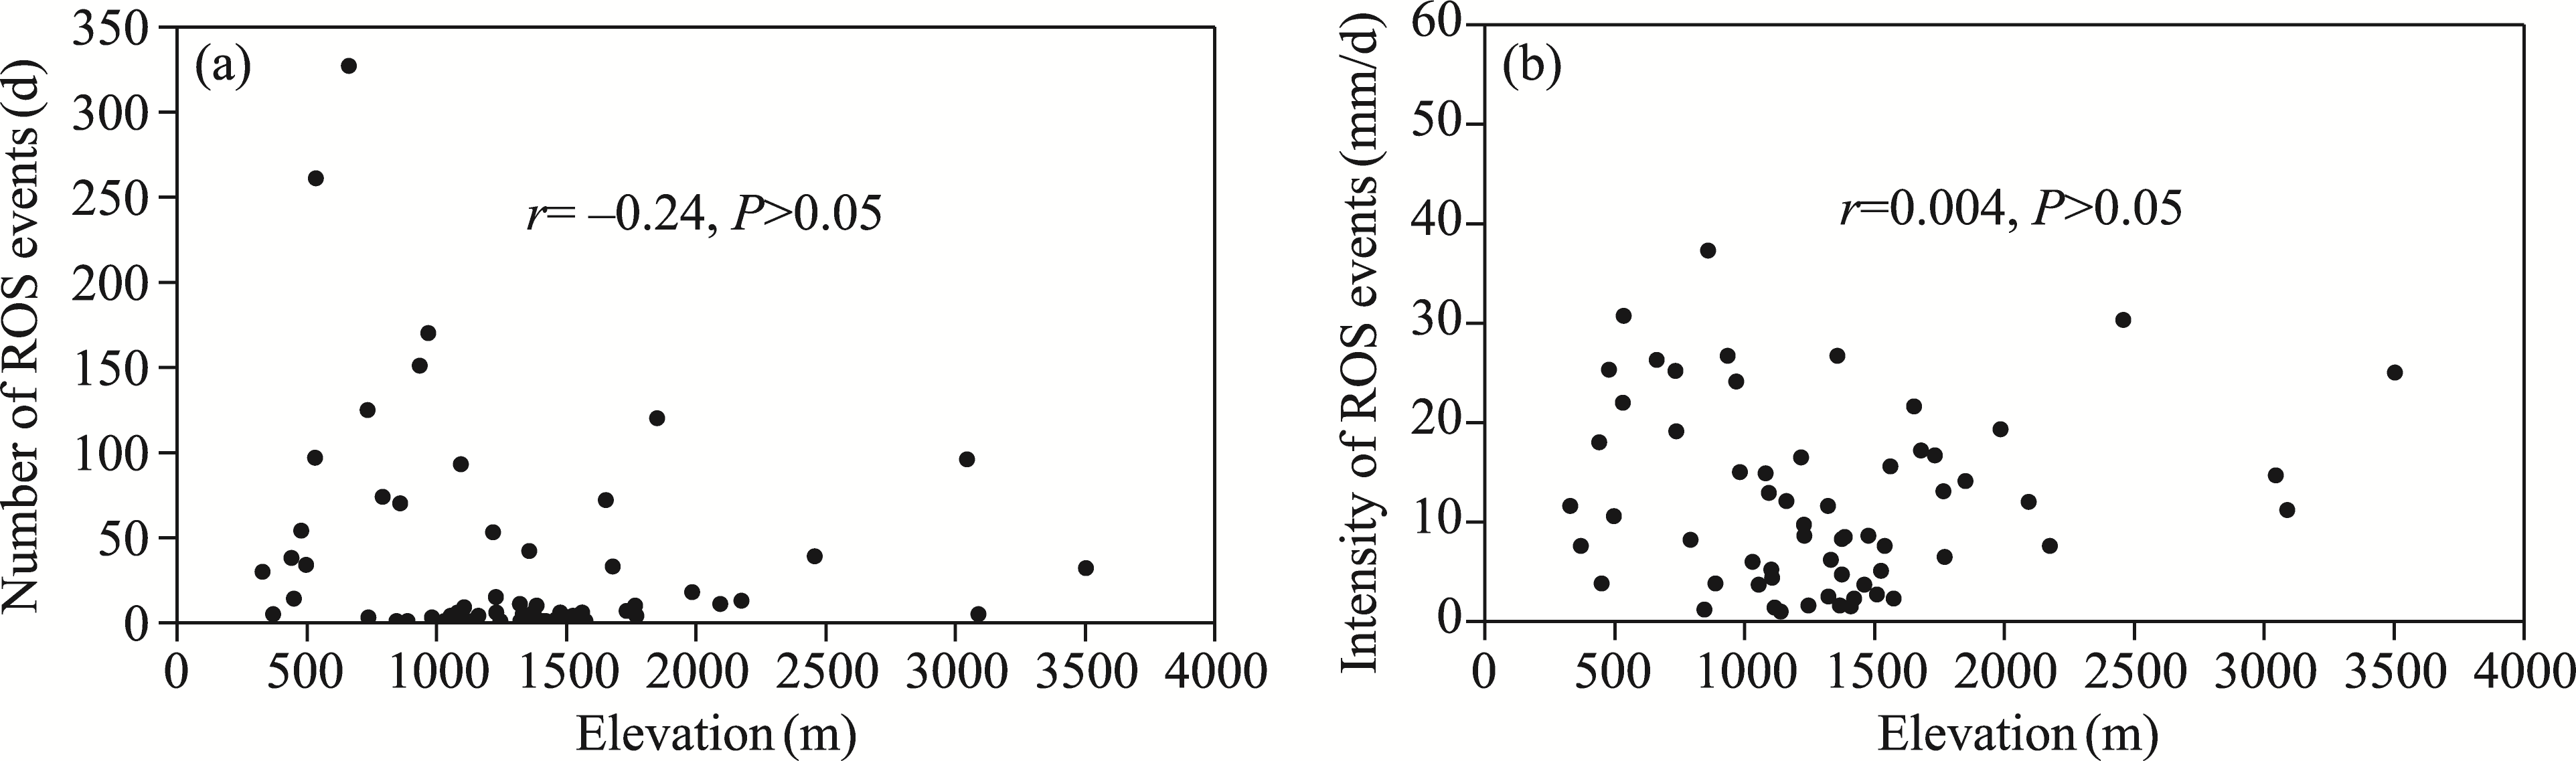
Abstract Rain-on-snow (ROS) events involve rainfall on snow surfaces, and the occurrence of ROS events can exacerbate water scarcity and ecosystem vulnerability in the arid region of Northwest China (ARNC). In this study, using daily snow depth data and daily meteorological data from 68 meteorological stations provided by the China Meteorological Administration National Meteorological Information Centre, we investigated the spatiotemporal variability of ROS events in the ARNC from 1978 to 2015 and examined the factors affecting these events and possible changes of future ROS events in the ARNC. The results showed that ROS events in the ARNC mainly occurred from October to May of the following year and were largely distributed in the Qilian Mountains, Tianshan Mountains, Ili River Valley, Tacheng Prefecture, and Altay Prefecture, with the Ili River Valley, Tacheng City, and Altay Mountains exhibiting the most occurrences. Based on the intensity of ROS events, the areas with the highest risk of flooding resulting from ROS events in the ARNC were the Tianshan Mountains, Ili River Valley, Tacheng City, and Altay Mountains. The number and intensity of ROS events in the ARNC largely increased from 1978 to 2015, mainly influenced by air temperature and the number of rainfall days. However, due to the snowpack abundance in areas experiencing frequent ROS events in the ARNC, snowpack changes exerted slight impact on ROS events, which is a temporary phenomenon. Furthermore, elevation imposed lesser impact on ROS events in the ARNC than other factors. In the ARNC, the start time of rainfall and the end time of snowpack gradually advanced from the spring of the current year to the winter of the previous year, while the end time of rainfall and the start time of snowpack gradually delayed from autumn to winter. This may lead to more ROS events in winter in the future. These results could provide a sound basis for managing water resources and mitigating related disasters caused by ROS events in the ARNC.
|
|
Received: 24 December 2023
Published: 30 April 2024
|
|
Corresponding Authors:
*CHEN Rensheng (E-mail: crs2008@lzb.ac.cn)
|
|
|
| [1] |
Anderson E A. 1968. Development and testing of snow pack energy balance equations. Water Resources Research, 4(1): 19-37.
doi: 10.1029/WR004i001p00019
|
|
|
| [2] |
Barnett T P, Adam J C, Lettenmaier D P. 2005. Potential impacts of a warming climate on water availability in snow-dominated regions. Nature, 438(7066): 303-309.
doi: 10.1038/nature04141
|
|
|
| [3] |
Colbeck S C. 1972. A theory of water percolation in snow. Journal of Glaciology, 11(63): 369-385.
doi: 10.3189/S0022143000022346
|
|
|
| [4] |
Conway H, Raymond C F. 1993. Snow stability during rain. Journal of Glaciology, 39(133): 635-642.
doi: 10.3189/S0022143000016531
|
|
|
| [5] |
Ding B H, Yang K, Qin J, et al. 2014. The dependence of precipitation types on surface elevation and meteorological conditions and its parameterization. Journal of Hydrology, 513: 154-163.
doi: 10.1016/j.jhydrol.2014.03.038
|
|
|
| [6] |
Eiriksson D, Whitson M, Luce C H, et al. 2013. An evaluation of the hydrologic relevance of lateral flow in snow at hillslope and catchment scales. Hydrological Processes, 27(5): 640-654.
doi: 10.1002/hyp.v27.5
|
|
|
| [7] |
Freudiger D, Kohn I, Stahl K, et al. 2014. Large-scale analysis of changing frequencies of rain-on-snow events with flood-generation potential. Hydrology and Earth System Sciences, 18(7): 2695-2709.
doi: 10.5194/hess-18-2695-2014
|
|
|
| [8] |
Garvelmann J, Pohl S, Weiler M. 2014. Variability of observed energy fluxes during rain-on-snow and clear sky snowmelt in a midlatitude mountain environment. Journal of Hydrometeorology, 15(3): 1220-1237.
doi: 10.1175/JHM-D-13-0187.1
|
|
|
| [9] |
Gouttevin I, Menegoz M, Dominé F, et al. 2012. How the insulating properties of snow affect soil carbon distribution in the continental pan-Arctic area. Journal of Geophysical Research: Biogeosciences, 117(G2), doi: 10.1029/2011JG001916.
|
|
|
| [10] |
Groisman P Y, Sun B, Vose R S, et al. 2003. Contemporary climate changes in high latitudes of the Northern Hemisphere:daily time resolution. In:14th Symposium on Global Change and Climate Variations. Long Beach, CA: American Meteorological Society.
|
|
|
| [11] |
Harr R D. 1981. Some characteristics and consequences of snowmelt during rainfall in western Oregon. Journal of Hydrology, 53(3-4): 277-304.
doi: 10.1016/0022-1694(81)90006-8
|
|
|
| [12] |
Helsel D R, Hirsch R M. 1992. Statistical Methods in Water Resources. Amsterdam, London, New York, and Tokyo: Elsevier.
|
|
|
| [13] |
Heywood L. 1988. Rain on snow avalanche events some observations. In:Proceedings of the 1988 International Snow Science Workshop. Whistler, Canada, 125-136.
|
|
|
| [14] |
Hock R. 2003. Temperature index melt modeling in mountain areas. Journal of Hydrology, 282(1-4): 104-115.
doi: 10.1016/S0022-1694(03)00257-9
|
|
|
| [15] |
Huntington T G, Hodgkins G A, Keim B D, et al. 2004. Changes in the proportion of precipitation occurring as snow in New England (1949-2000). Journal of Climate, 17(13): 2626-2636.
doi: 10.1175/1520-0442(2004)017<2626:CITPOP>2.0.CO;2
|
|
|
| [16] |
Jennings K S, Winchell T S, Livneh B, et al. 2018. Spatial variation of the rain-snow temperature threshold across the Northern Hemisphere. Nature Communications, 9: 1148, doi: 10.1038/s41467-018-03629-7.
pmid: 29559636
|
|
|
| [17] |
Kattelmann R. 1985. Macropores in snowpacks of Sierra Nevada. Annals of Glaciology, 6: 272-273.
doi: 10.3189/1985AoG6-1-272-273
|
|
|
| [18] |
Ke C Q, Li X C, Xie H J, et al. 2016. Variability in snow cover phenology in China from 1952 to 2010. Hydrology and Earth System Sciences, 20(2): 755-770.
doi: 10.5194/hess-20-755-2016
|
|
|
| [19] |
Ling F, Zhang T J. 2003. Impact of the timing and duration of seasonal snow cover on the active layer and permafrost in the Alaskan Arctic. Permafrost and Periglacial Processes, 14(2): 141-150.
doi: 10.1002/ppp.v14:2
|
|
|
| [20] |
Lu X Y, Chen R S, Liu Y, et al. 2021. Spatiotemporal variation of rain-on-snow days in northern Xinjiang. Journal of Glaciology and Geocryology, 43(5): 1446-1457. (in Chinese)
doi: 10.7522/j.issn.1000-0240.2021.0089
|
|
|
| [21] |
Maina F Z, Kumar S V. 2023. Diverging trends in rain-on-snow over high mountain Asia. Earth's Future, 11(3): e2022EF003009, doi: 10.1029/2022EF003009.
|
|
|
| [22] |
Marks D G, Link T E, Winstral A H, et al. 2001. Simulating snowmelt processes during rain-on-snow over a semi-arid mountain basin. Annals of Glaciology, 32: 195-202.
doi: 10.3189/172756401781819751
|
|
|
| [23] |
Martinec J, Rango A. 1986. Parameter values for snowmelt runoff modelling. Journal of Hydrology, 84(3-4): 197-219.
doi: 10.1016/0022-1694(86)90123-X
|
|
|
| [24] |
McCabe G J, Clark M P, Hay L E. 2007. Rain-on-snow events in the western United States. Bulletin of the American Meteorological Society, 88(3): 319-328.
doi: 10.1175/BAMS-88-3-319
|
|
|
| [25] |
Morán-Tejeda E, López-Moreno J I, Stoffel M, et al. 2016. Rain-on-snow events in Switzerland: recent observations and projections for the 21st century. Climate Research, 71(2): 111-125.
doi: 10.3354/cr01435
|
|
|
| [26] |
Musselman K N, Lehner F, Ikeda K, et al. 2018. Projected increases and shifts in rain-on-snow flood risk over western North America. Nature Climate Change, 8(9): 808-812.
doi: 10.1038/s41558-018-0236-4
|
|
|
| [27] |
Myers D T, Ficklin D L, Robeson S M. 2021. Incorporating rain-on-snow into the SWAT model results in more accurate simulations of hydrologic extremes. Journal of Hydrology, 603: 126972, doi: 10.1016/j.jhydrol.2021.126972.
|
|
|
| [28] |
Pan C G, Kirchner P B, Kimball J S, et al. 2018. Rain-on-snow events in Alaska, their frequency and distribution from satellite observations. Environmental Research Letters, 13(7): 075004, doi: 10.1088/1748-9326/aac9d3.
|
|
|
| [29] |
Pomeroy J W, Fang X, Marks D G. 2016. The cold rain-on-snow event of June 2013 in the Canadian Rockies-characteristics and diagnosis. Hydrological Processes, 30(17): 2899-2914.
doi: 10.1002/hyp.v30.17
|
|
|
| [30] |
Pradhanang S M, Frei A, Zion M, et al. 2013. Rain-on-snow runoff events in New York. Hydrological Processes, 27(21): 3035-3049.
|
|
|
| [31] |
Putkonen J, Roe G. 2003. Rain-on-snow events impact soil temperatures and affect ungulate survival. Geophysical Research Letters, 30(4): 1188, doi: 10.1029/2002GL016326.
|
|
|
| [32] |
Rennert K J, Roe G, Putkonen J, et al. 2009. Soil thermal and ecological impacts of rain on snow events in the circumpolar Arctic. Journal of Climate, 22(9): 2302-2315.
doi: 10.1175/2008JCLI2117.1
|
|
|
| [33] |
Sezen C, Šraj M, Medved A, et al. 2020. Investigation of rain-on-snow floods under climate change. Applied Sciences, 10(4): 1242, doi: 10.3390/app10041242.
|
|
|
| [34] |
Singh P, Spitzbart G, Hübl H, et al. 1997. Hydrological response of snowpack under rain-on-snow events: a field study. Journal of Hydrology, 202(1-4): 1-20, doi: 10.1016/S0022-1694(97)00004-8.
|
|
|
| [35] |
Stimberis J, Rubin C M. 2011. Glide avalanche response to an extreme rain-on-snow event, Snoqualmie Pass, Washington, USA. Journal of Glaciology, 57(203): 468-474.
|
|
|
| [36] |
Sun F, Chen Y N, Li Y P, et al. 2022. Incorporating relative humidity improves the accuracy of precipitation phase discrimination in High Mountain Asia. Atmospheric Research, 271: 106094, doi: 10.1016/j.atmosres.2022.106094.
|
|
|
| [37] |
Surfleet C G, Tullos D. 2013. Variability in effect of climate change on rain-on-snow peak flow events in a temperate climate. Journal of Hydrology, 479: 24-34.
doi: 10.1016/j.jhydrol.2012.11.021
|
|
|
| [38] |
Tan X J, Wu Z N, Mu X M, et al. 2019. Spatiotemporal changes in snow cover over China during 1960-2013. Atmospheric Research, 218: 183-194.
doi: 10.1016/j.atmosres.2018.11.018
|
|
|
| [39] |
Vahedifard F, AghaKouchak A, Ragno E, et al. 2017. Lessons from the Oroville dam. Science, 355(6330): 1139-1140.
doi: 10.1126/science.aan0171
pmid: 28302817
|
|
|
| [40] |
Wang C X, Li D L. 2012. Spatial-temporal variations of snow cover days and the maximum depth of snow cover in China during recent 50 years. Journal of Glaciology and Geocryology, 34(2): 247-256. (in Chinese)
|
|
|
| [41] |
Würzer S, Jonas T, Wever N, et al. 2016. Influence of initial snowpack properties on runoff formation during rain-on-snow events. Journal of Hydrometeorology, 17(6): 1801-1815.
doi: 10.1175/JHM-D-15-0181.1
|
|
|
| [42] |
Yang Y, Chen R S, Liu G H, et al. 2022. Trends and variability in snowmelt in China under climate change. Hydrology and Earth System Sciences, 26(2): 305-329.
doi: 10.5194/hess-26-305-2022
|
|
|
| [43] |
Yang Z W, Chen R S, Liu Y W, et al. 2023. The impact of rain-on-snow events on the snowmelt process: A field study. Hydrological Processes, 37(11): e15019, doi: 10.1002/hyp.15019.
|
|
|
| [44] |
Ye H C, Yang D Q, Robinson D. 2008. Winter rain on snow and its association with air temperature in northern Eurasia. Hydrological Processes, 22(15): 2728-2736.
doi: 10.1002/hyp.v22:15
|
|
|
| [45] |
Ye H C, Cohen J, Rawlins M. 2013. Discrimination of solid from liquid precipitation over Northern Eurasia using surface atmospheric conditions. Journal of Hydrometeorology, 14(4): 1345-1355.
doi: 10.1175/JHM-D-12-0164.1
|
|
|
| [46] |
Zhou G, Zhang D H, Wan J H, et al. 2023. Mapping reveals contrasting change patterns of rain-on-snow events in China during 2001 to 2018. Journal of Hydrology, 617: 129089, doi: 10.1016/j.jhydrol.2023.129089...
|
|
|
|
Viewed |
|
|
|
Full text
|
|
|
|
|
Abstract
|
|
|
|
|
Cited |
|
|
|
|
| |
Shared |
|
|
|
|
| |
Discussed |
|
|
|
|