| Research article |
|


|
|
|
| Impacts of continuous melon cropping on soil properties and microbial network restructuring |
HAN Runqiang1,2, SHI Yao1,2, WANG Haojie3, KUANG Zuoyu4, HAILATI Daren1,2, SHEN Zhengran1,2, MA Yanyu1,2, XUE Nana1,2,*( ) ) |
1College of Resources and Environment, Xinjiang Agricultural University, Urumqi 830052, China
2Xinjiang Key Laboratory of Soil and Plant Ecological Processes, Urumqi 830052, China
3Hami Melon Research Center, Xinjiang Academy of Agricultural Sciences, Urumqi 830052, China
4Agricultural Technology Promotion Center in Jiashi County, Jiashi 844300, China |
|
|
|
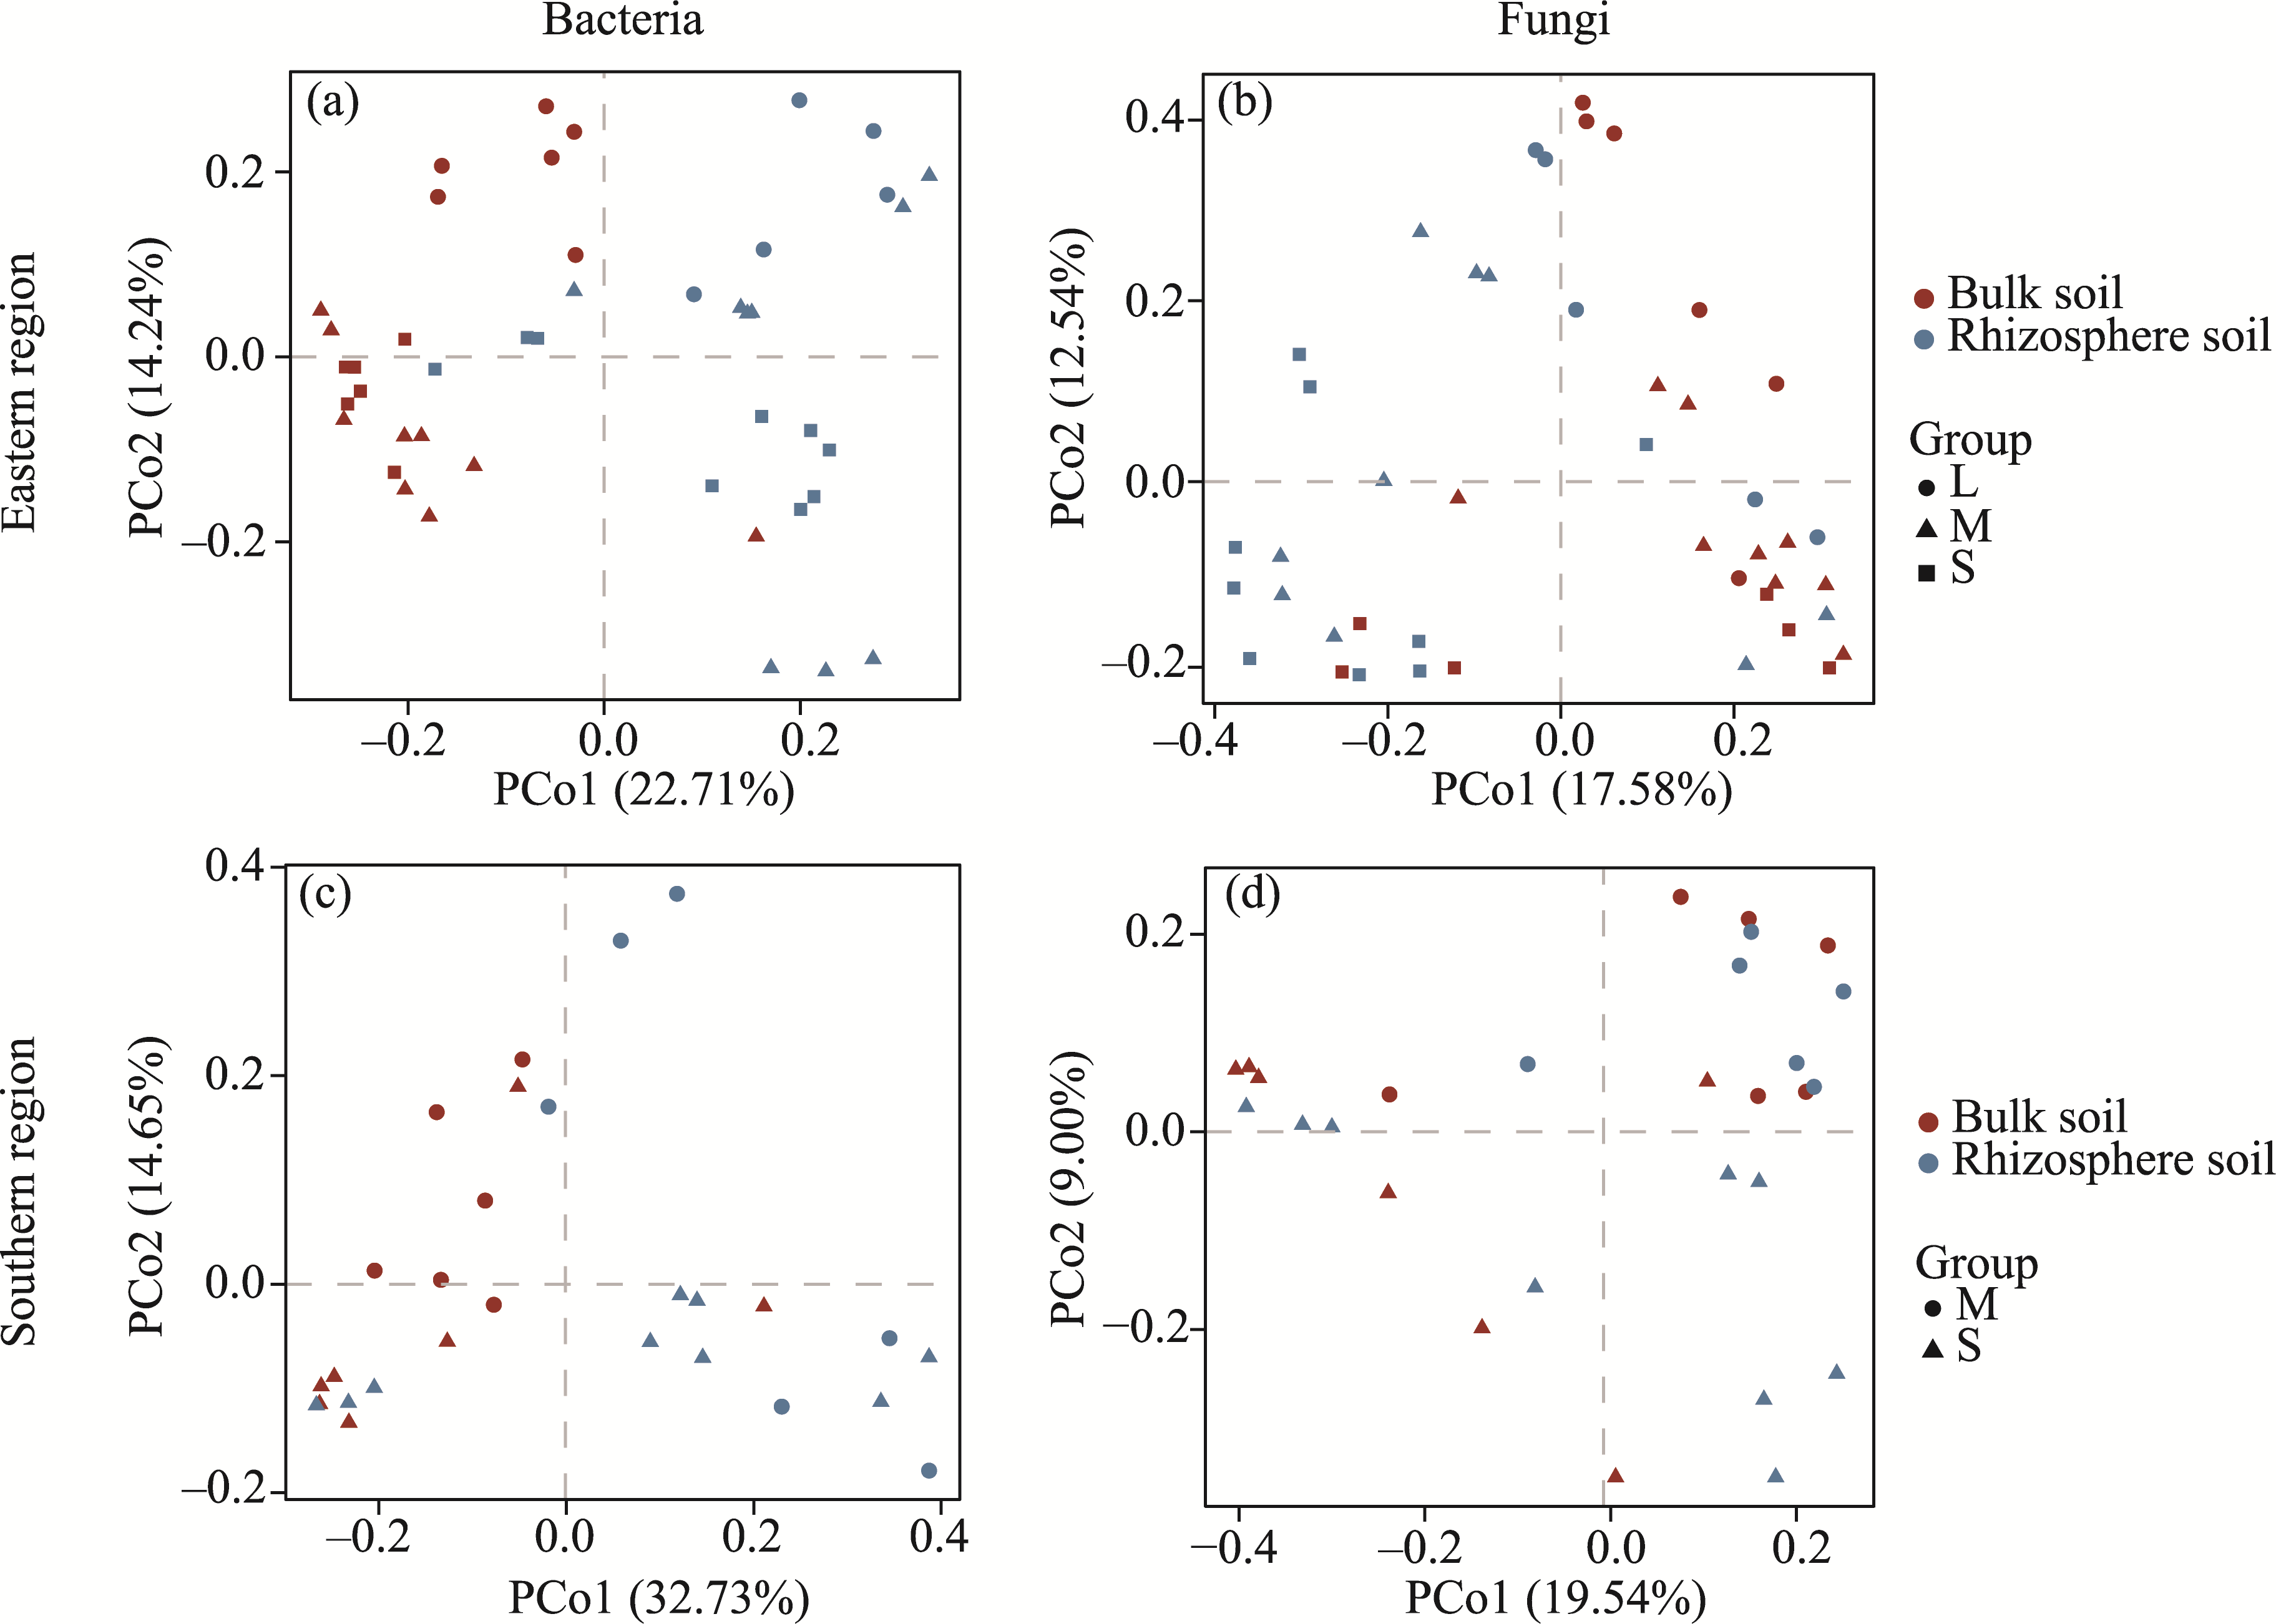
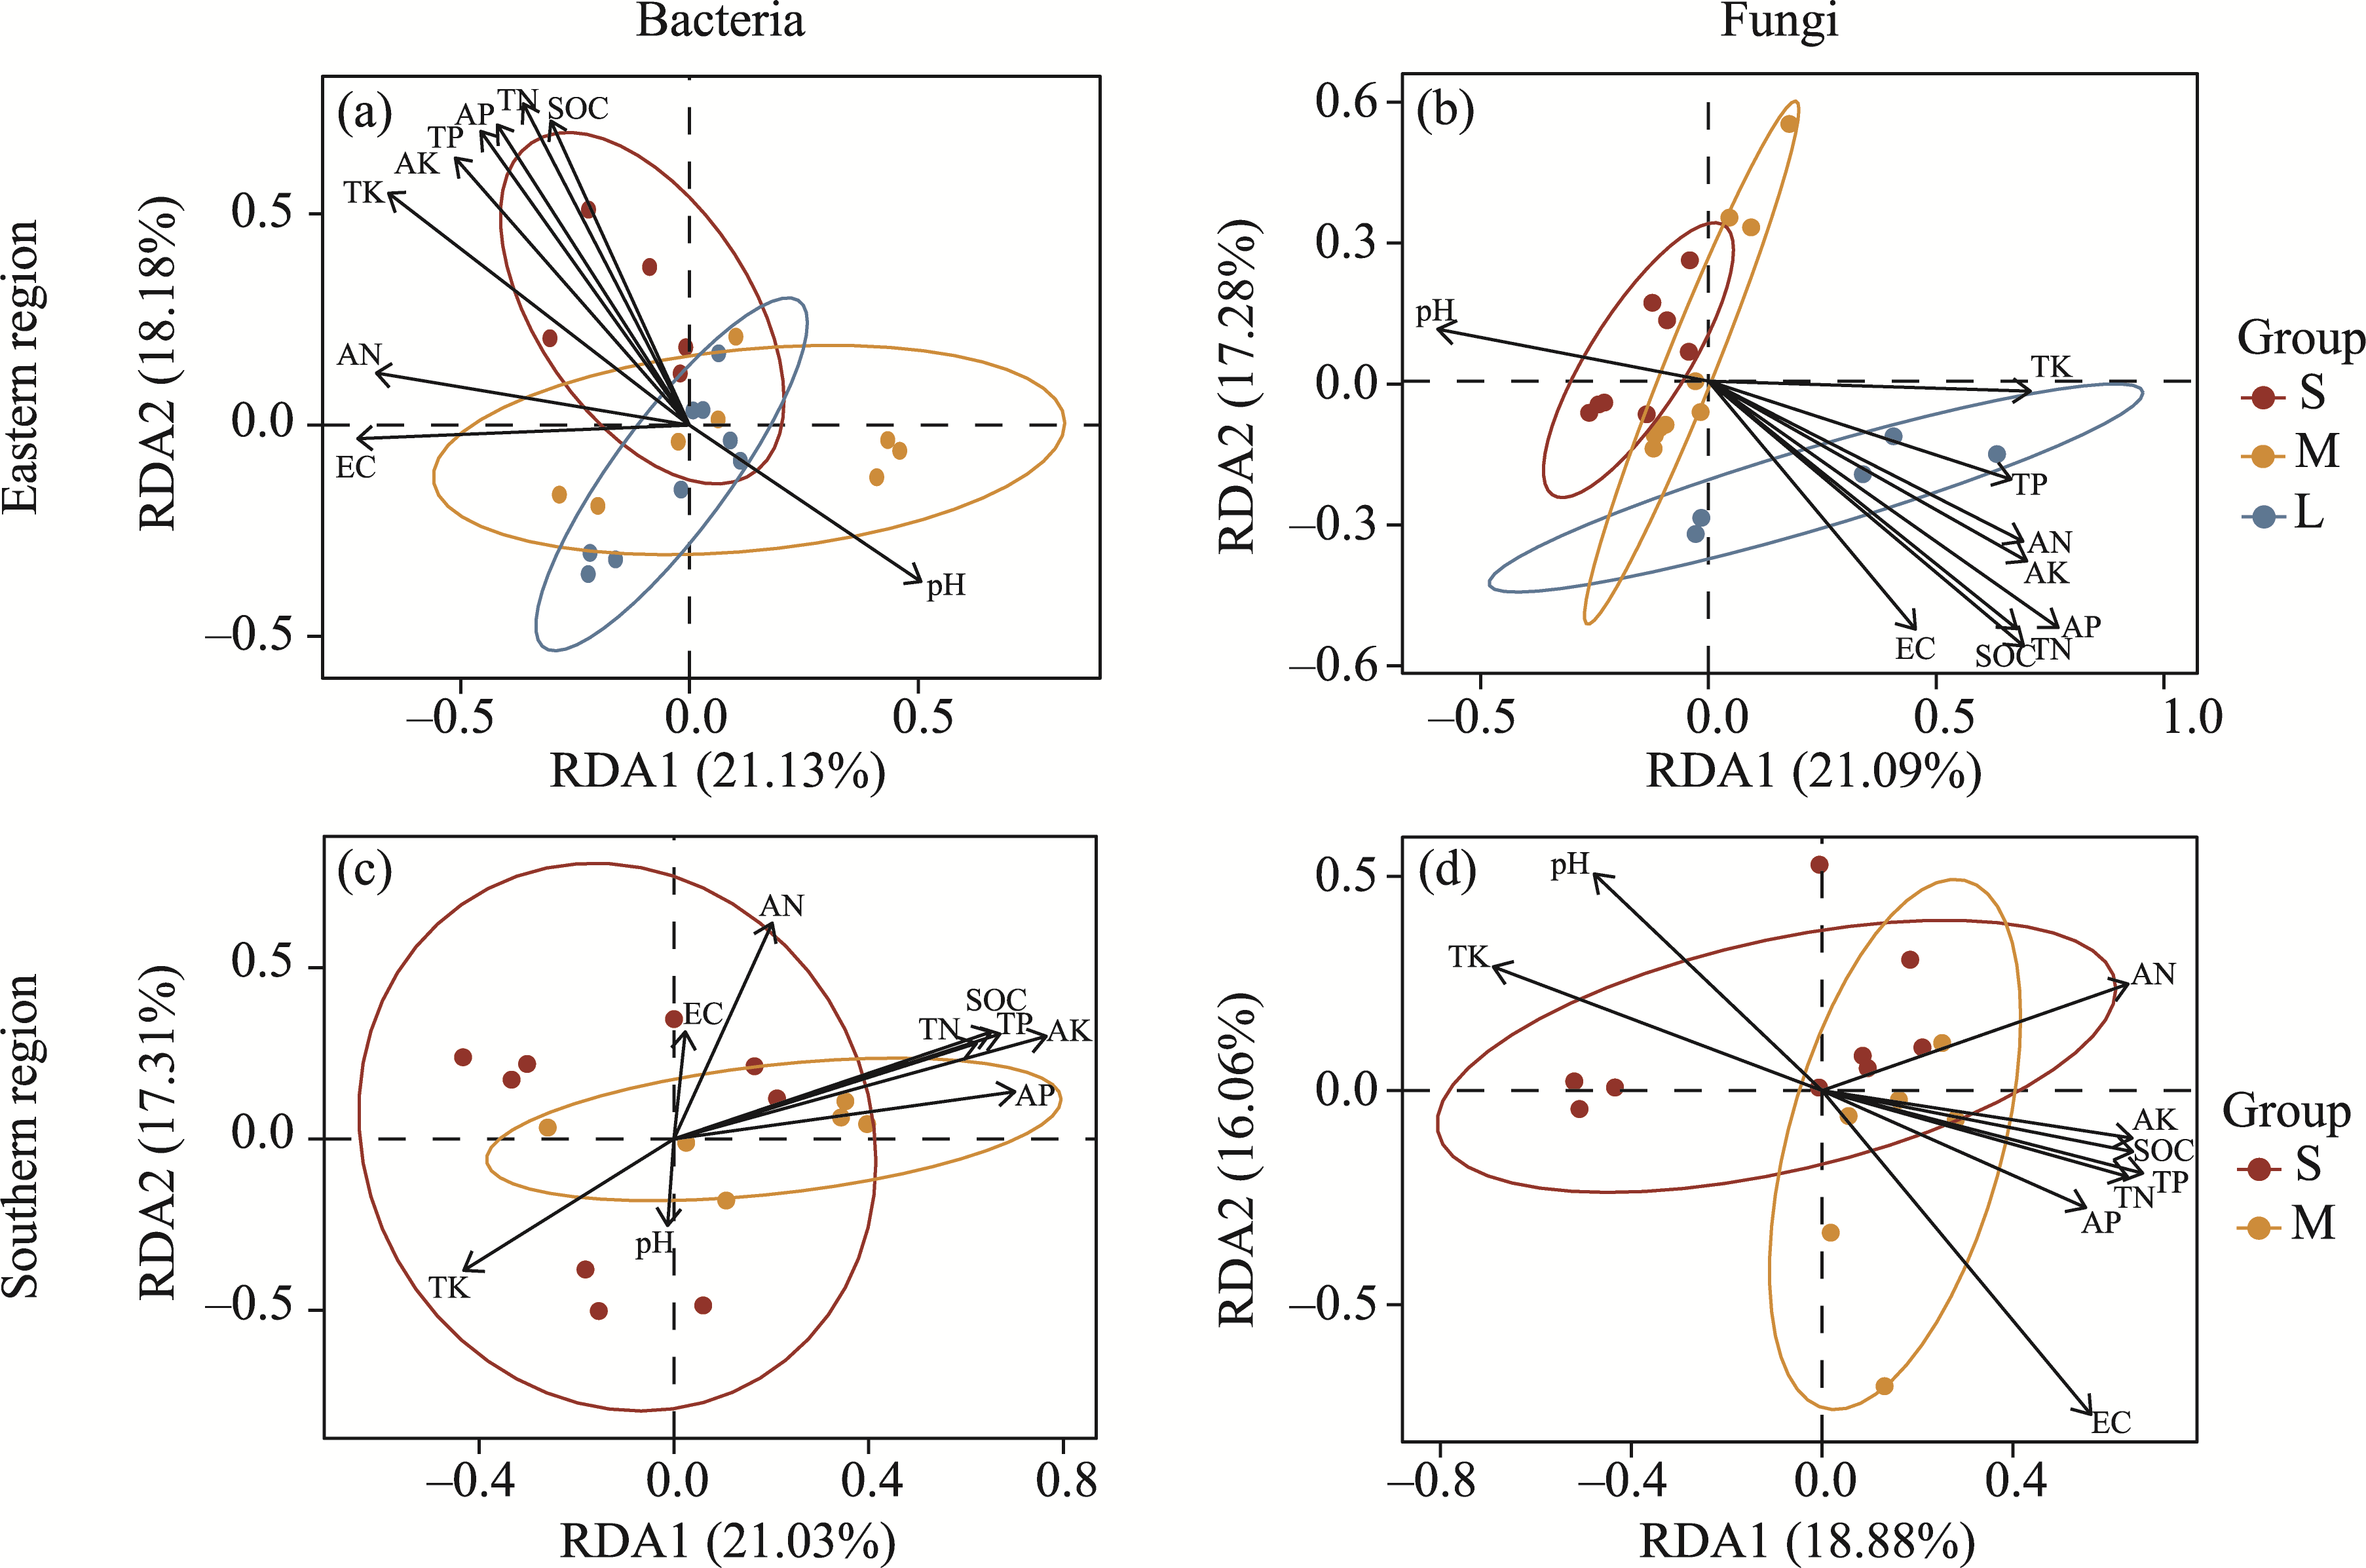
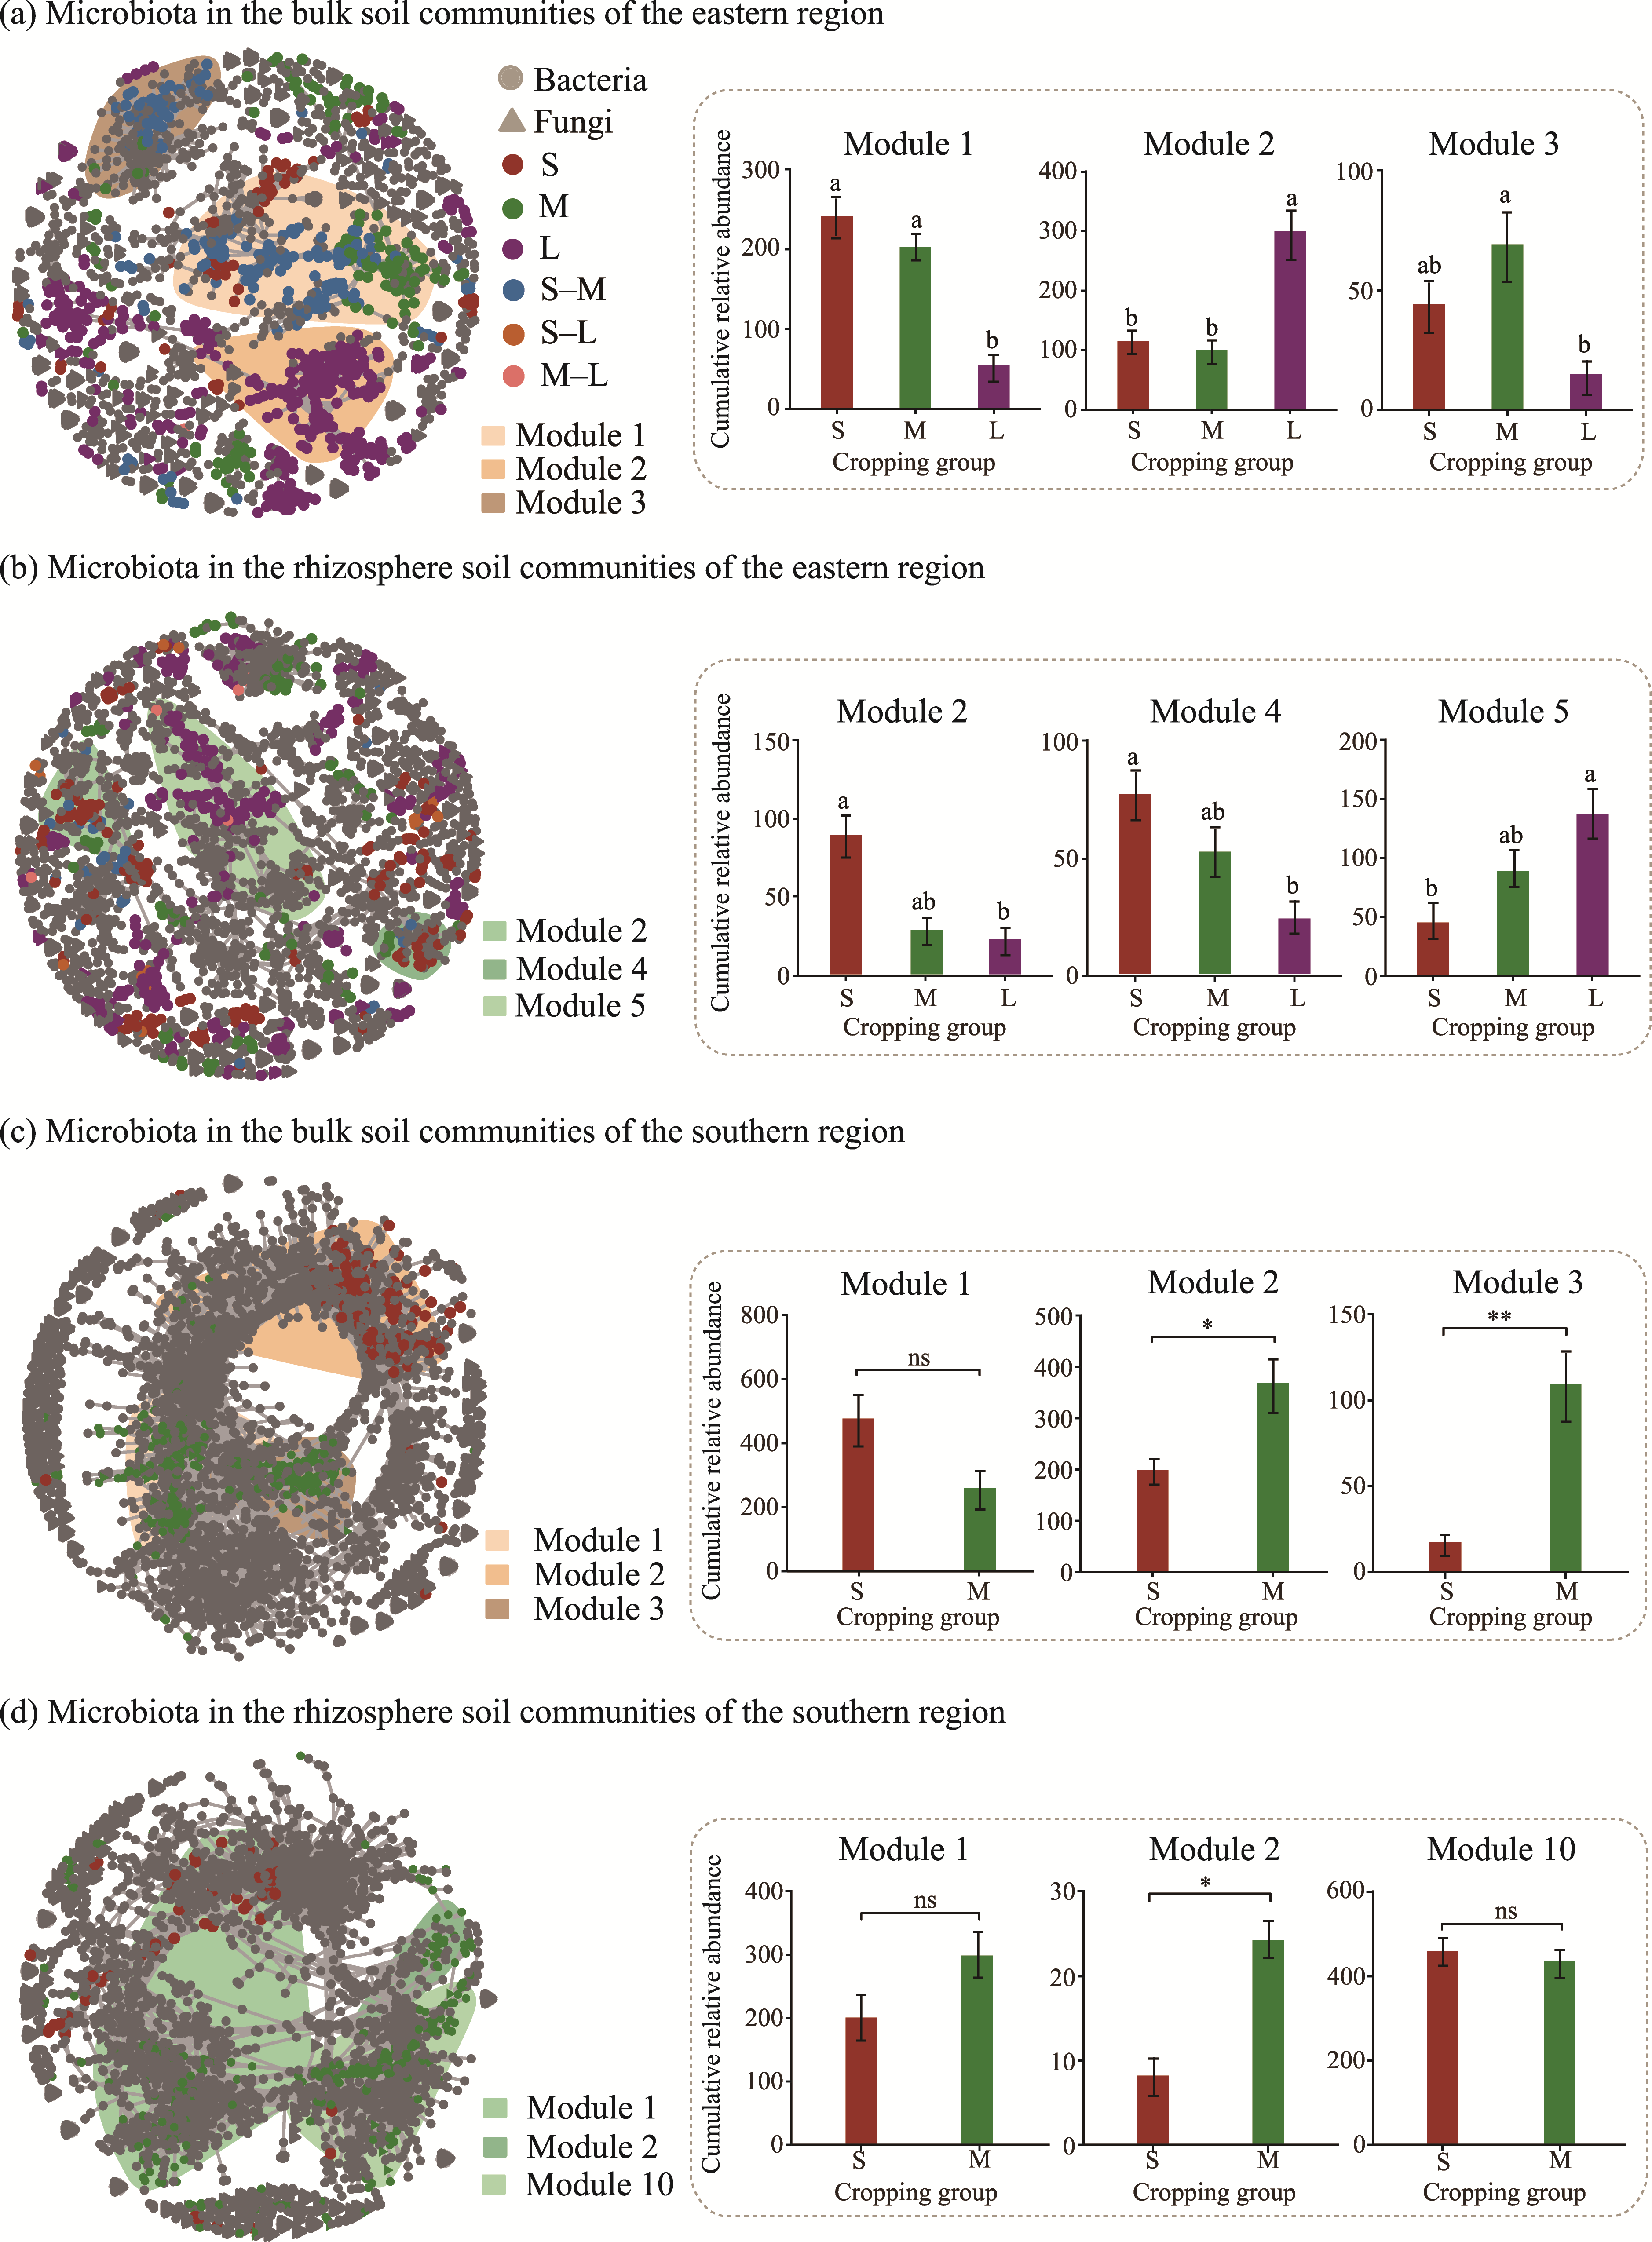
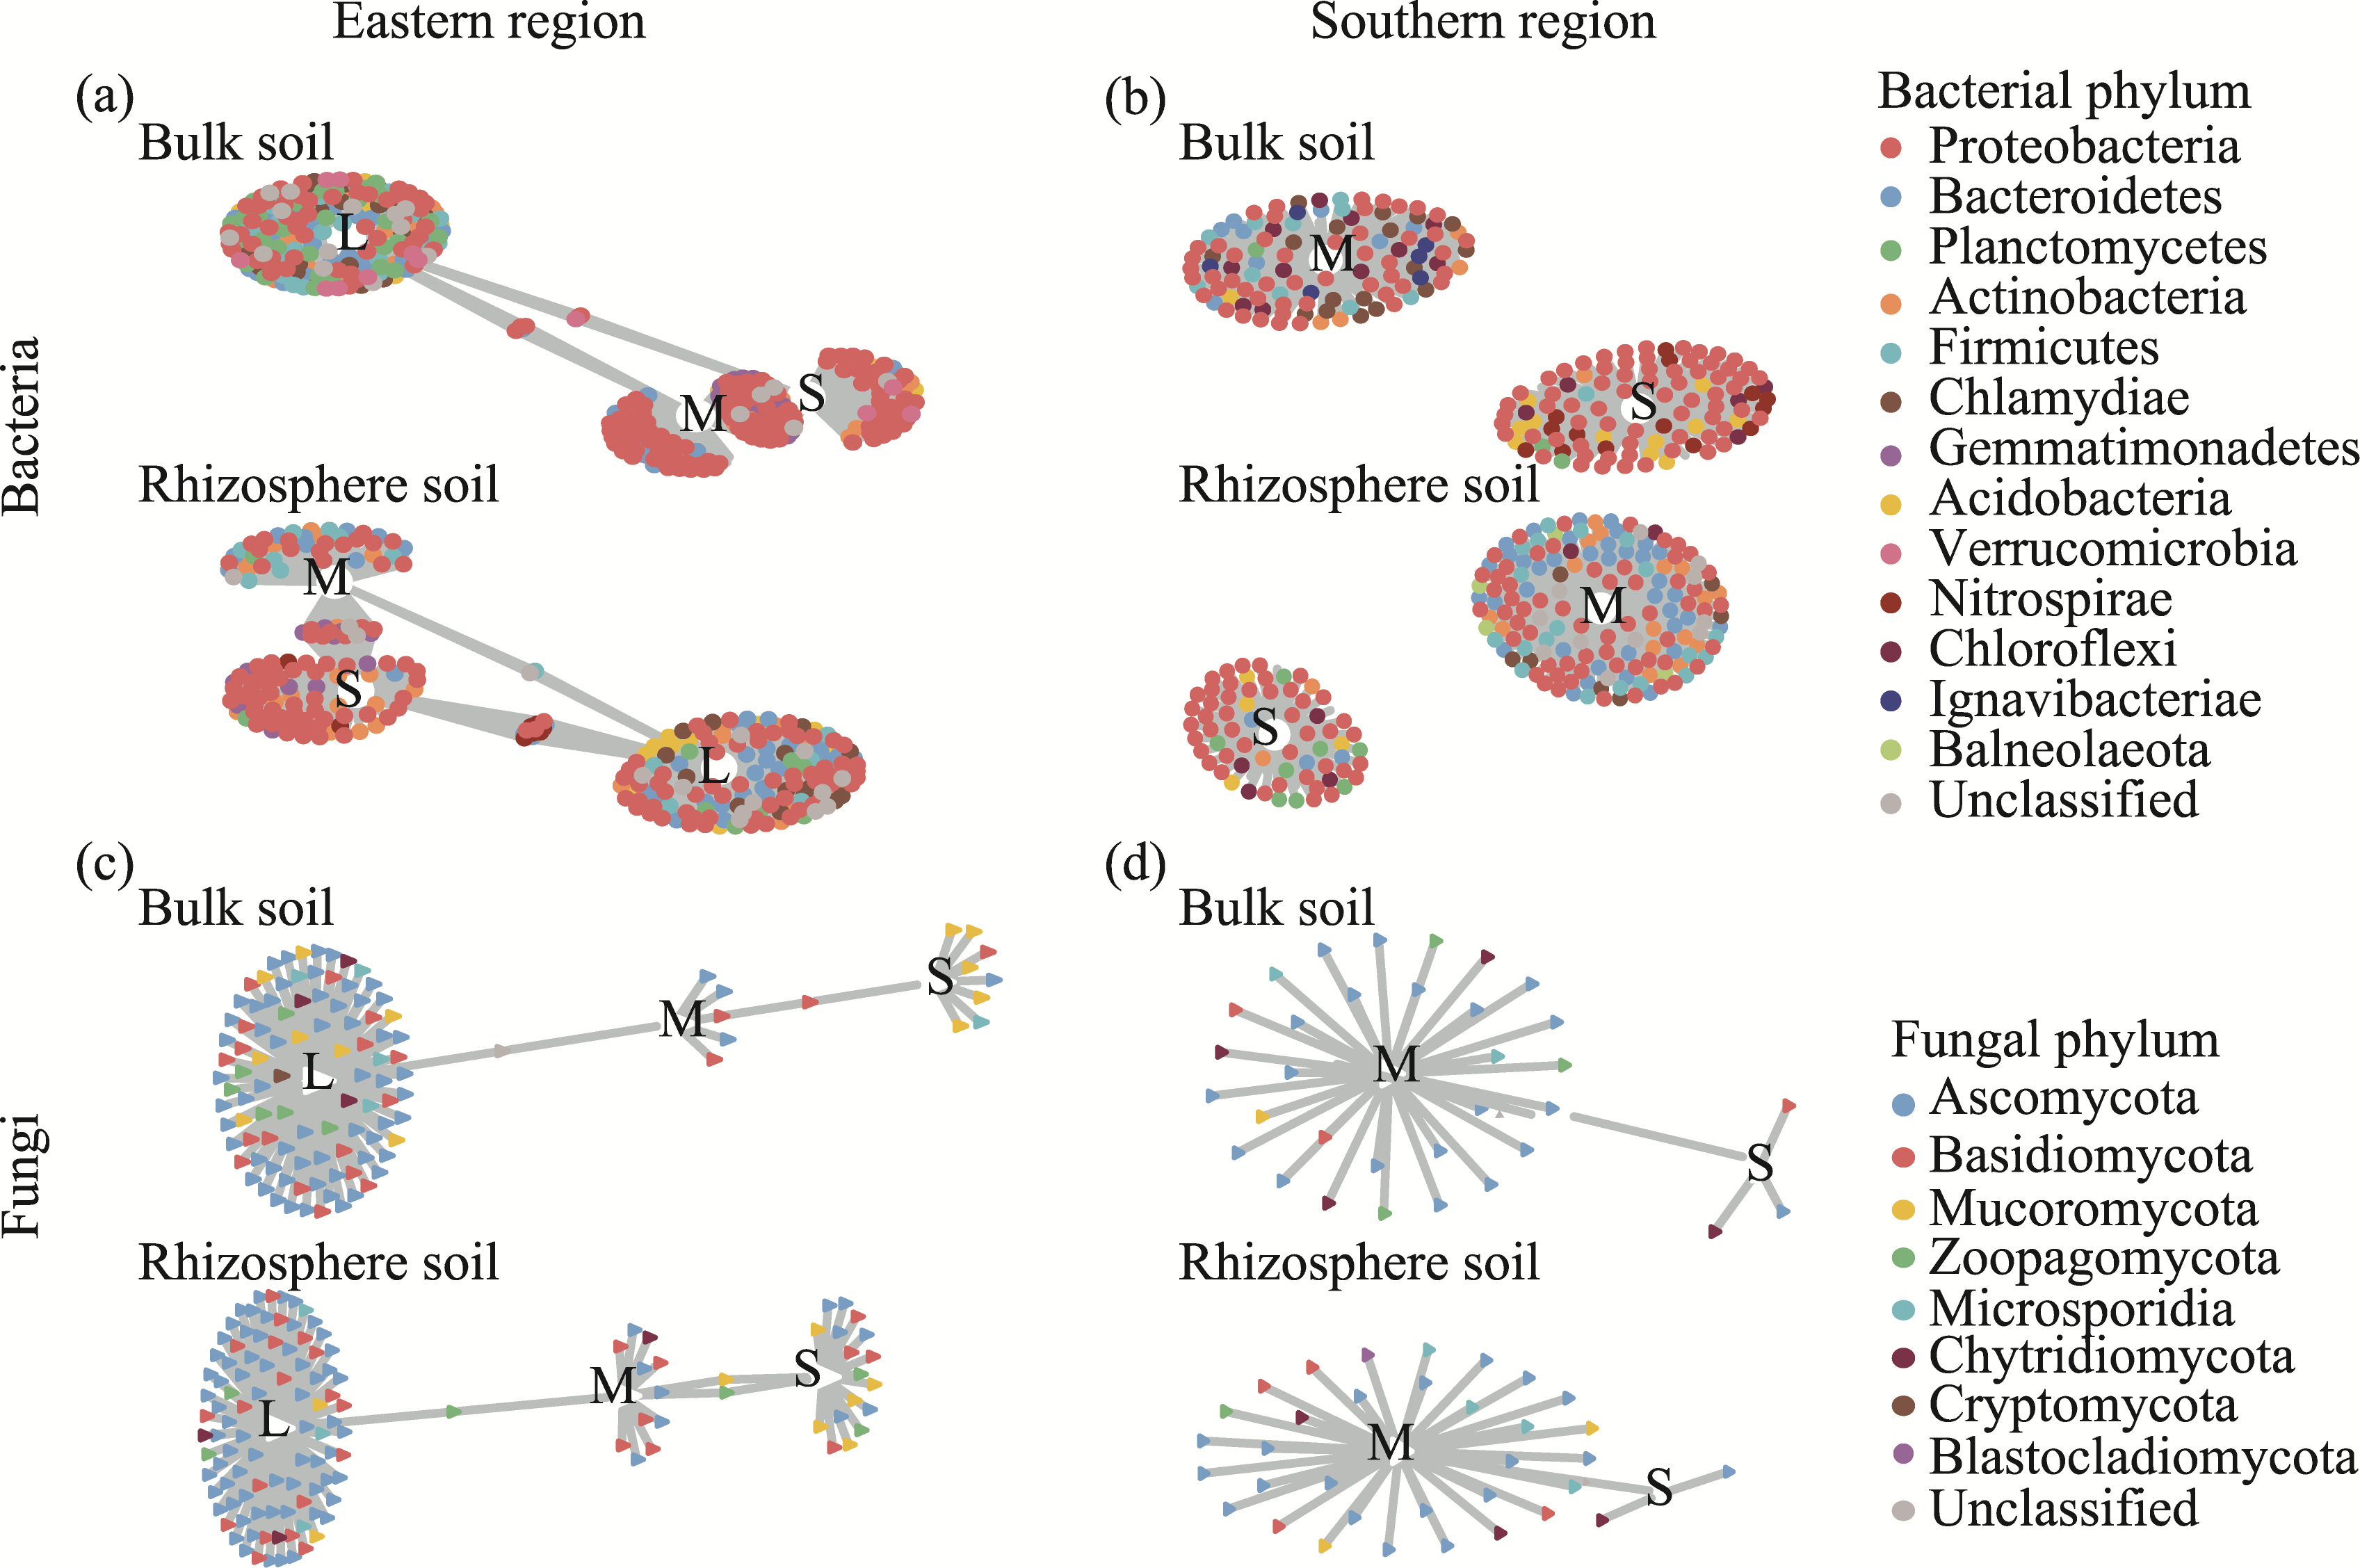
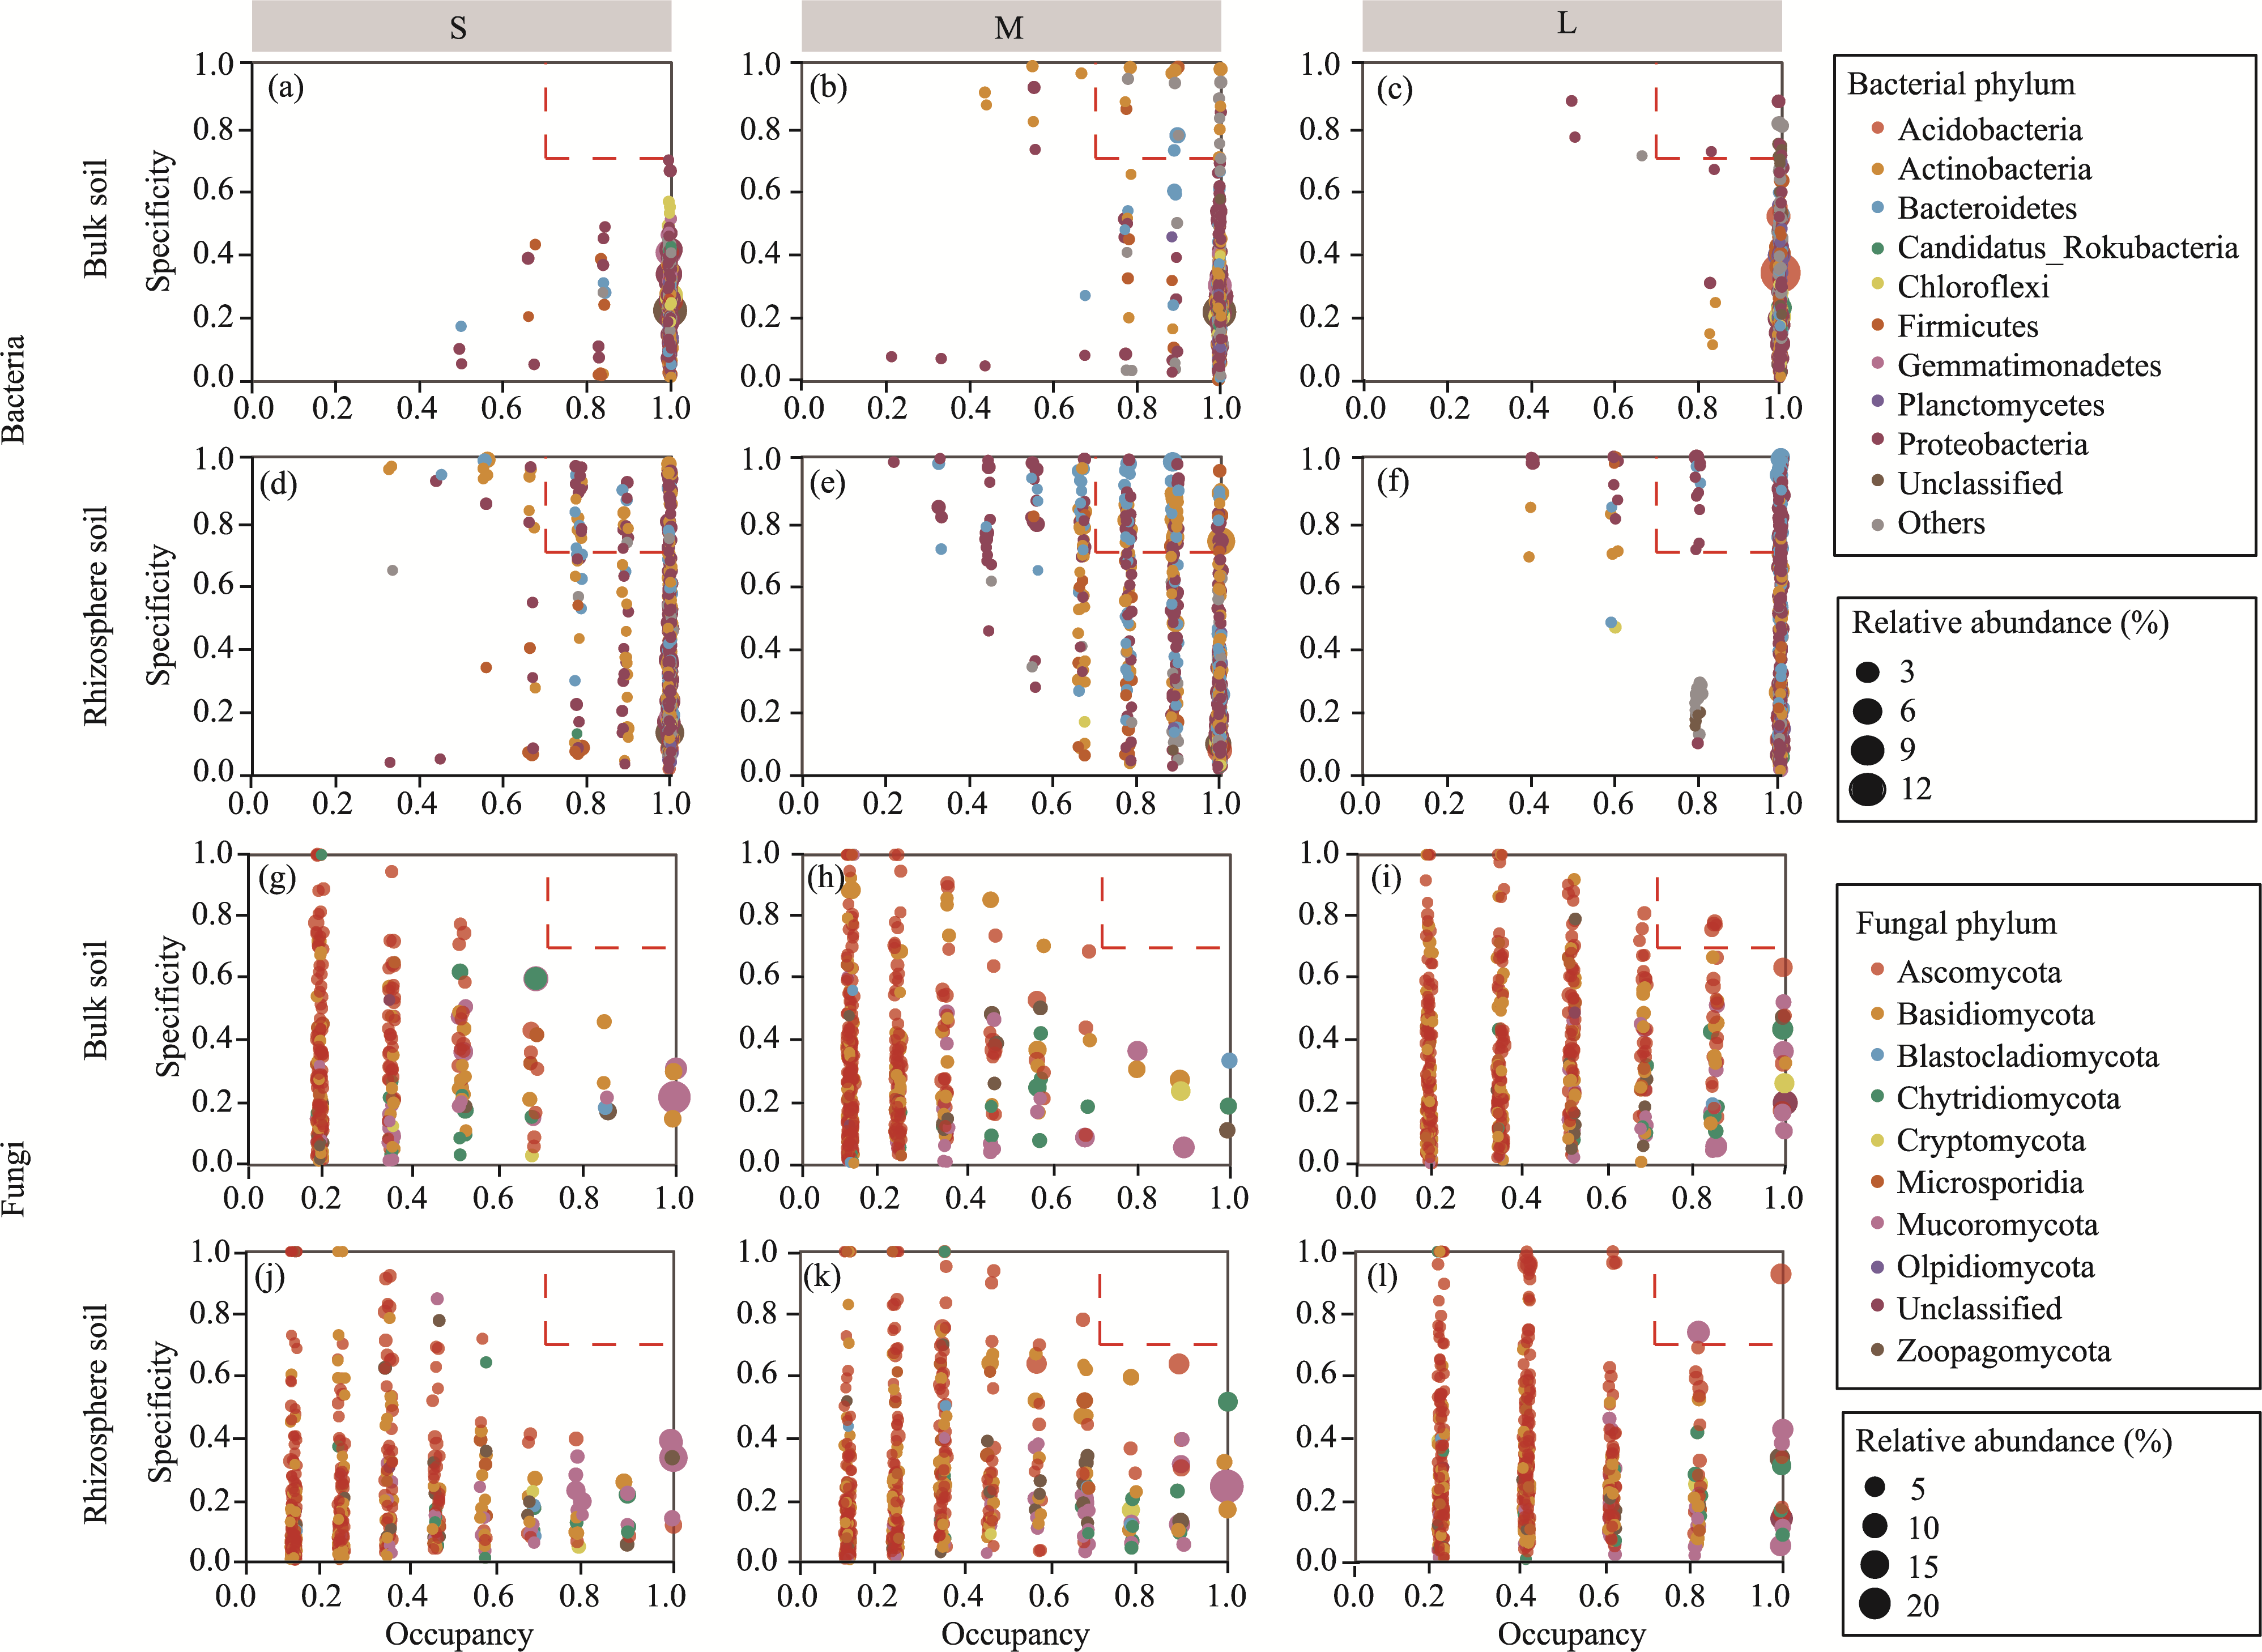
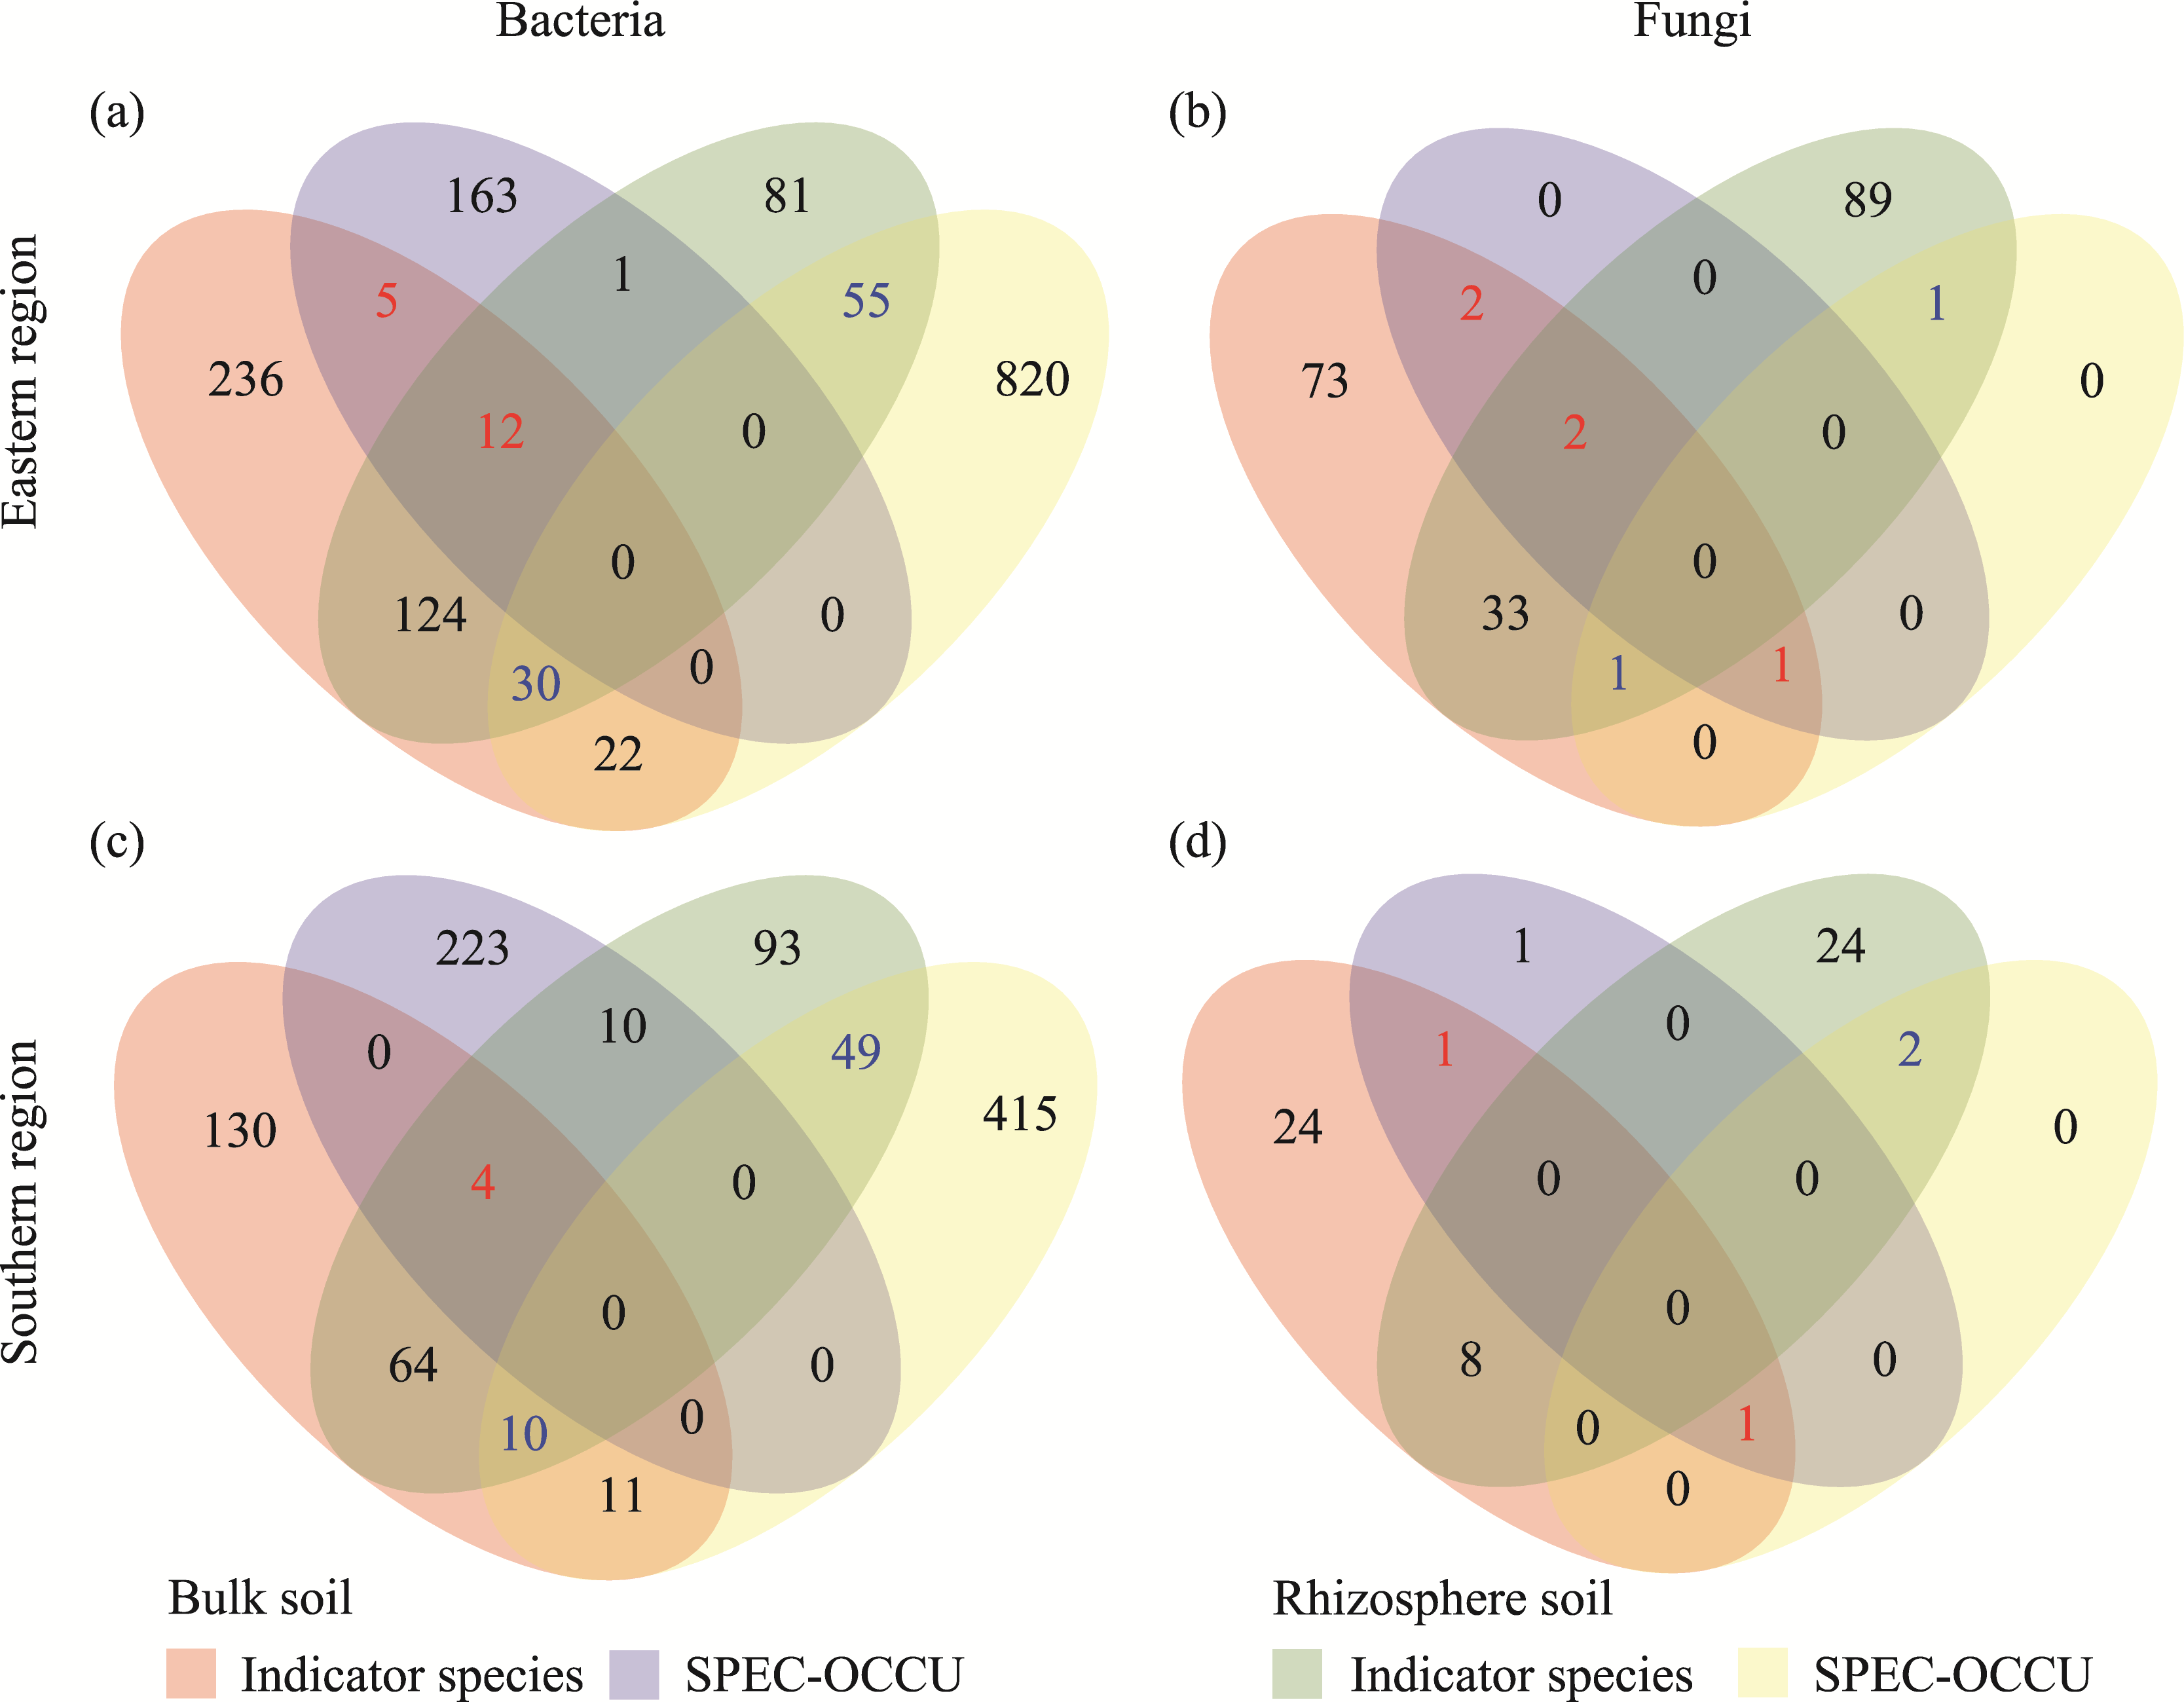
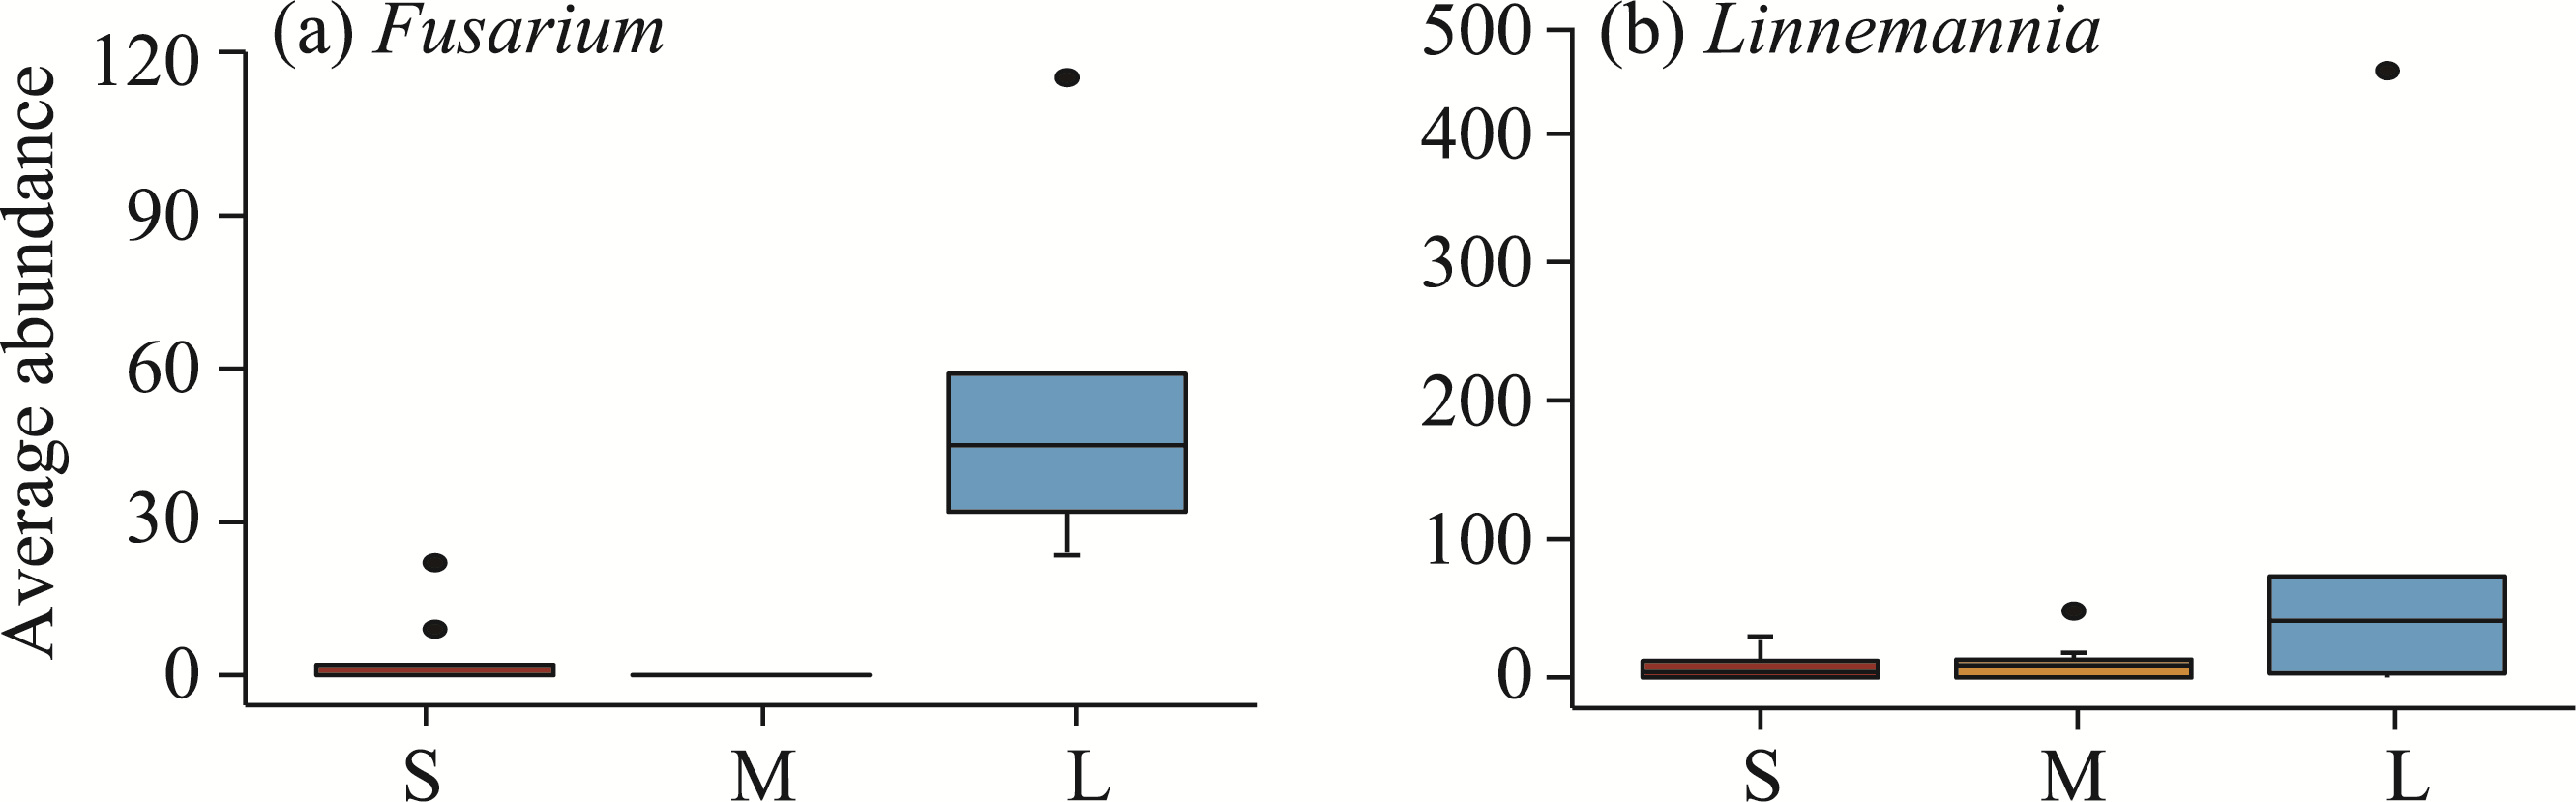
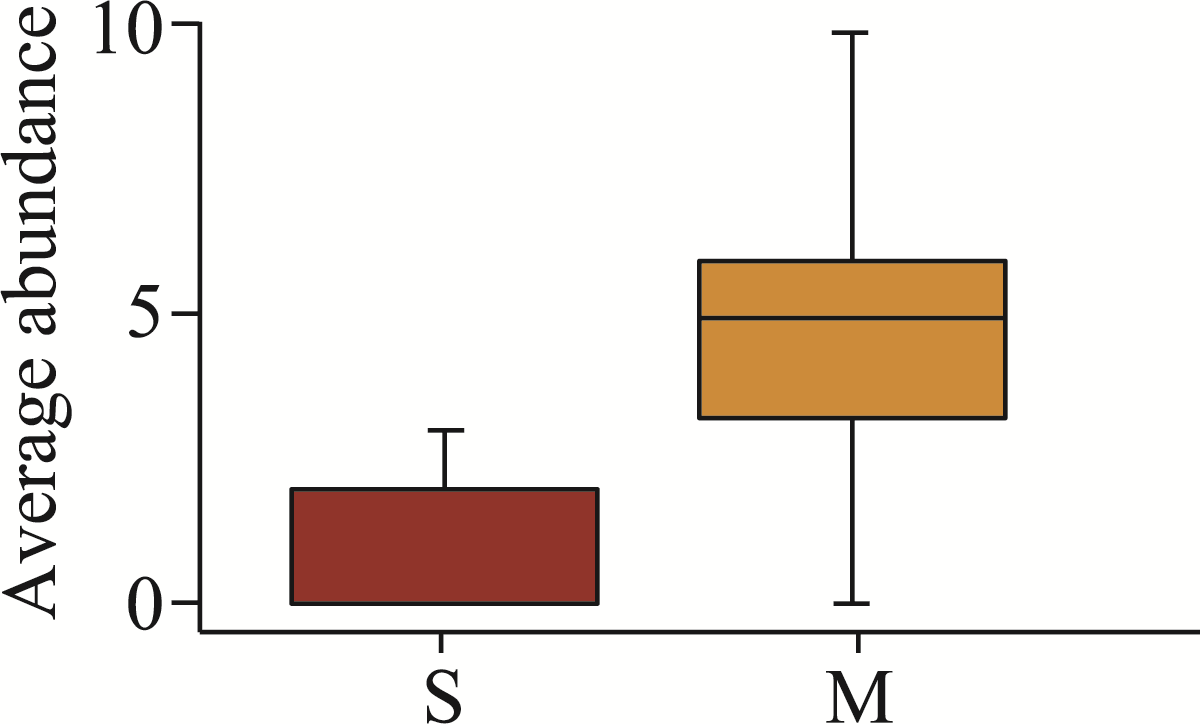
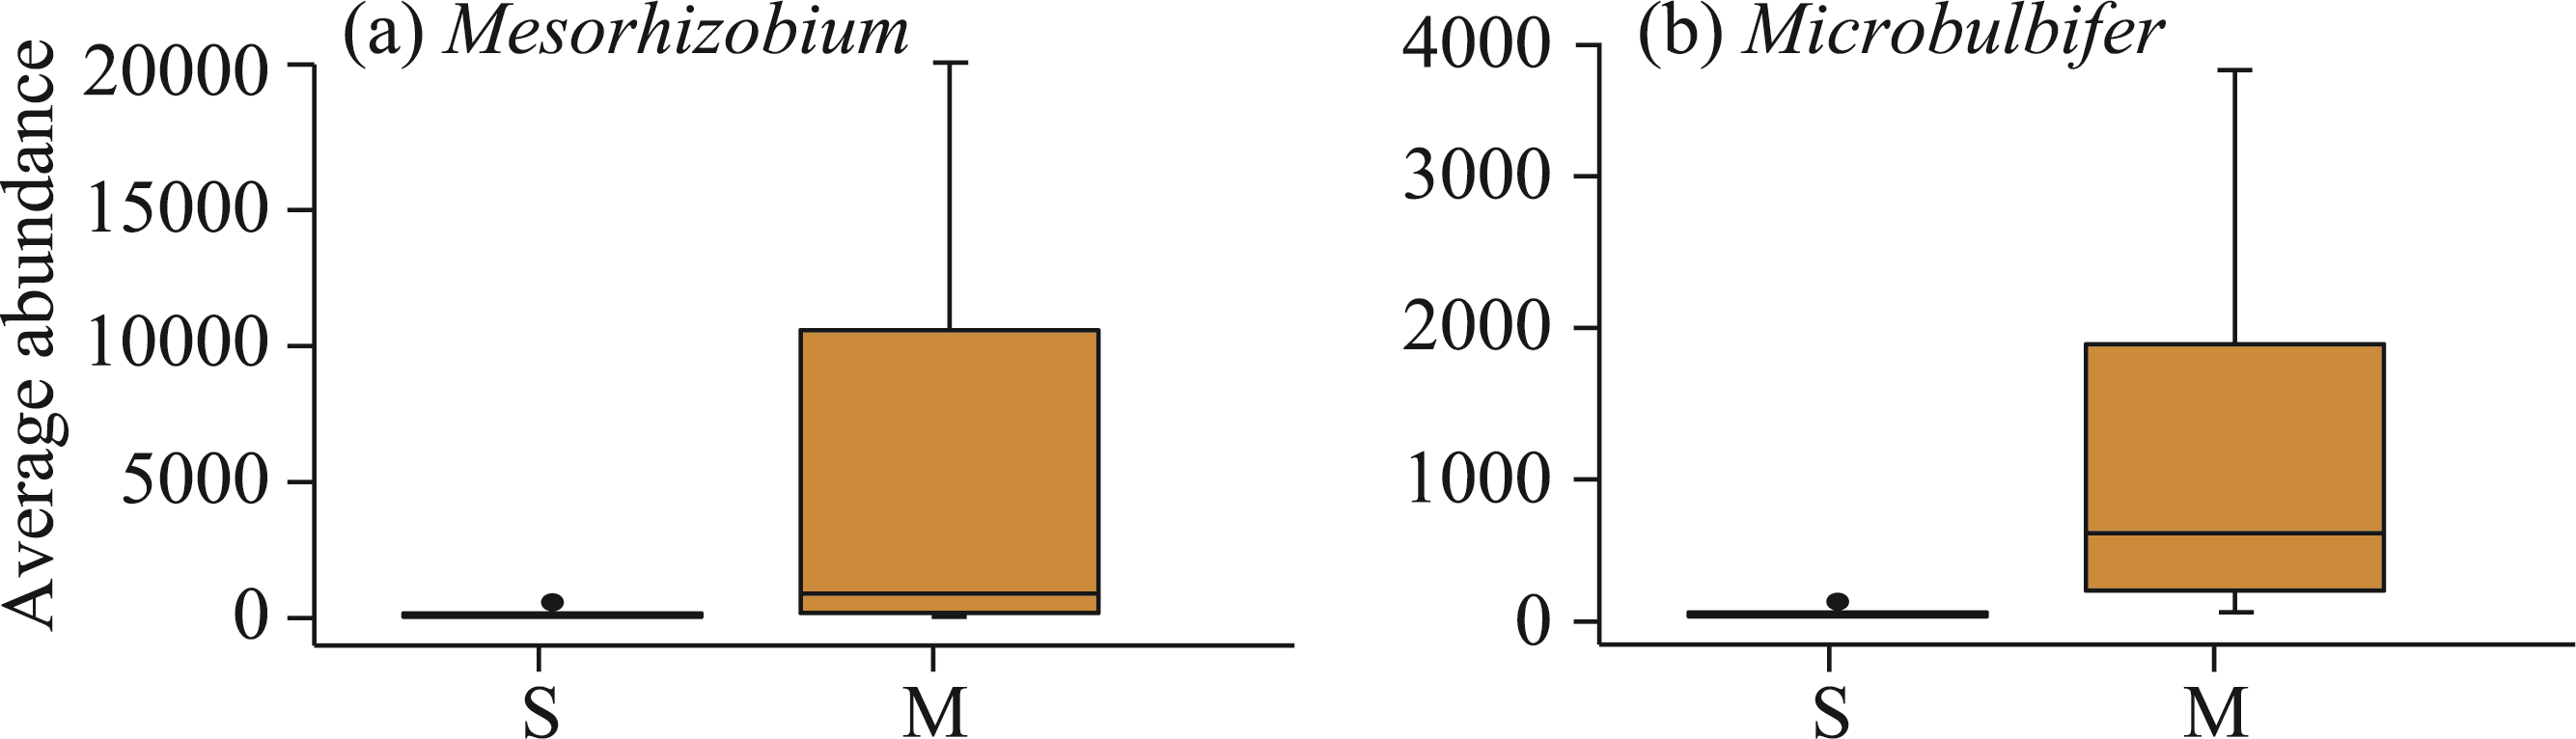
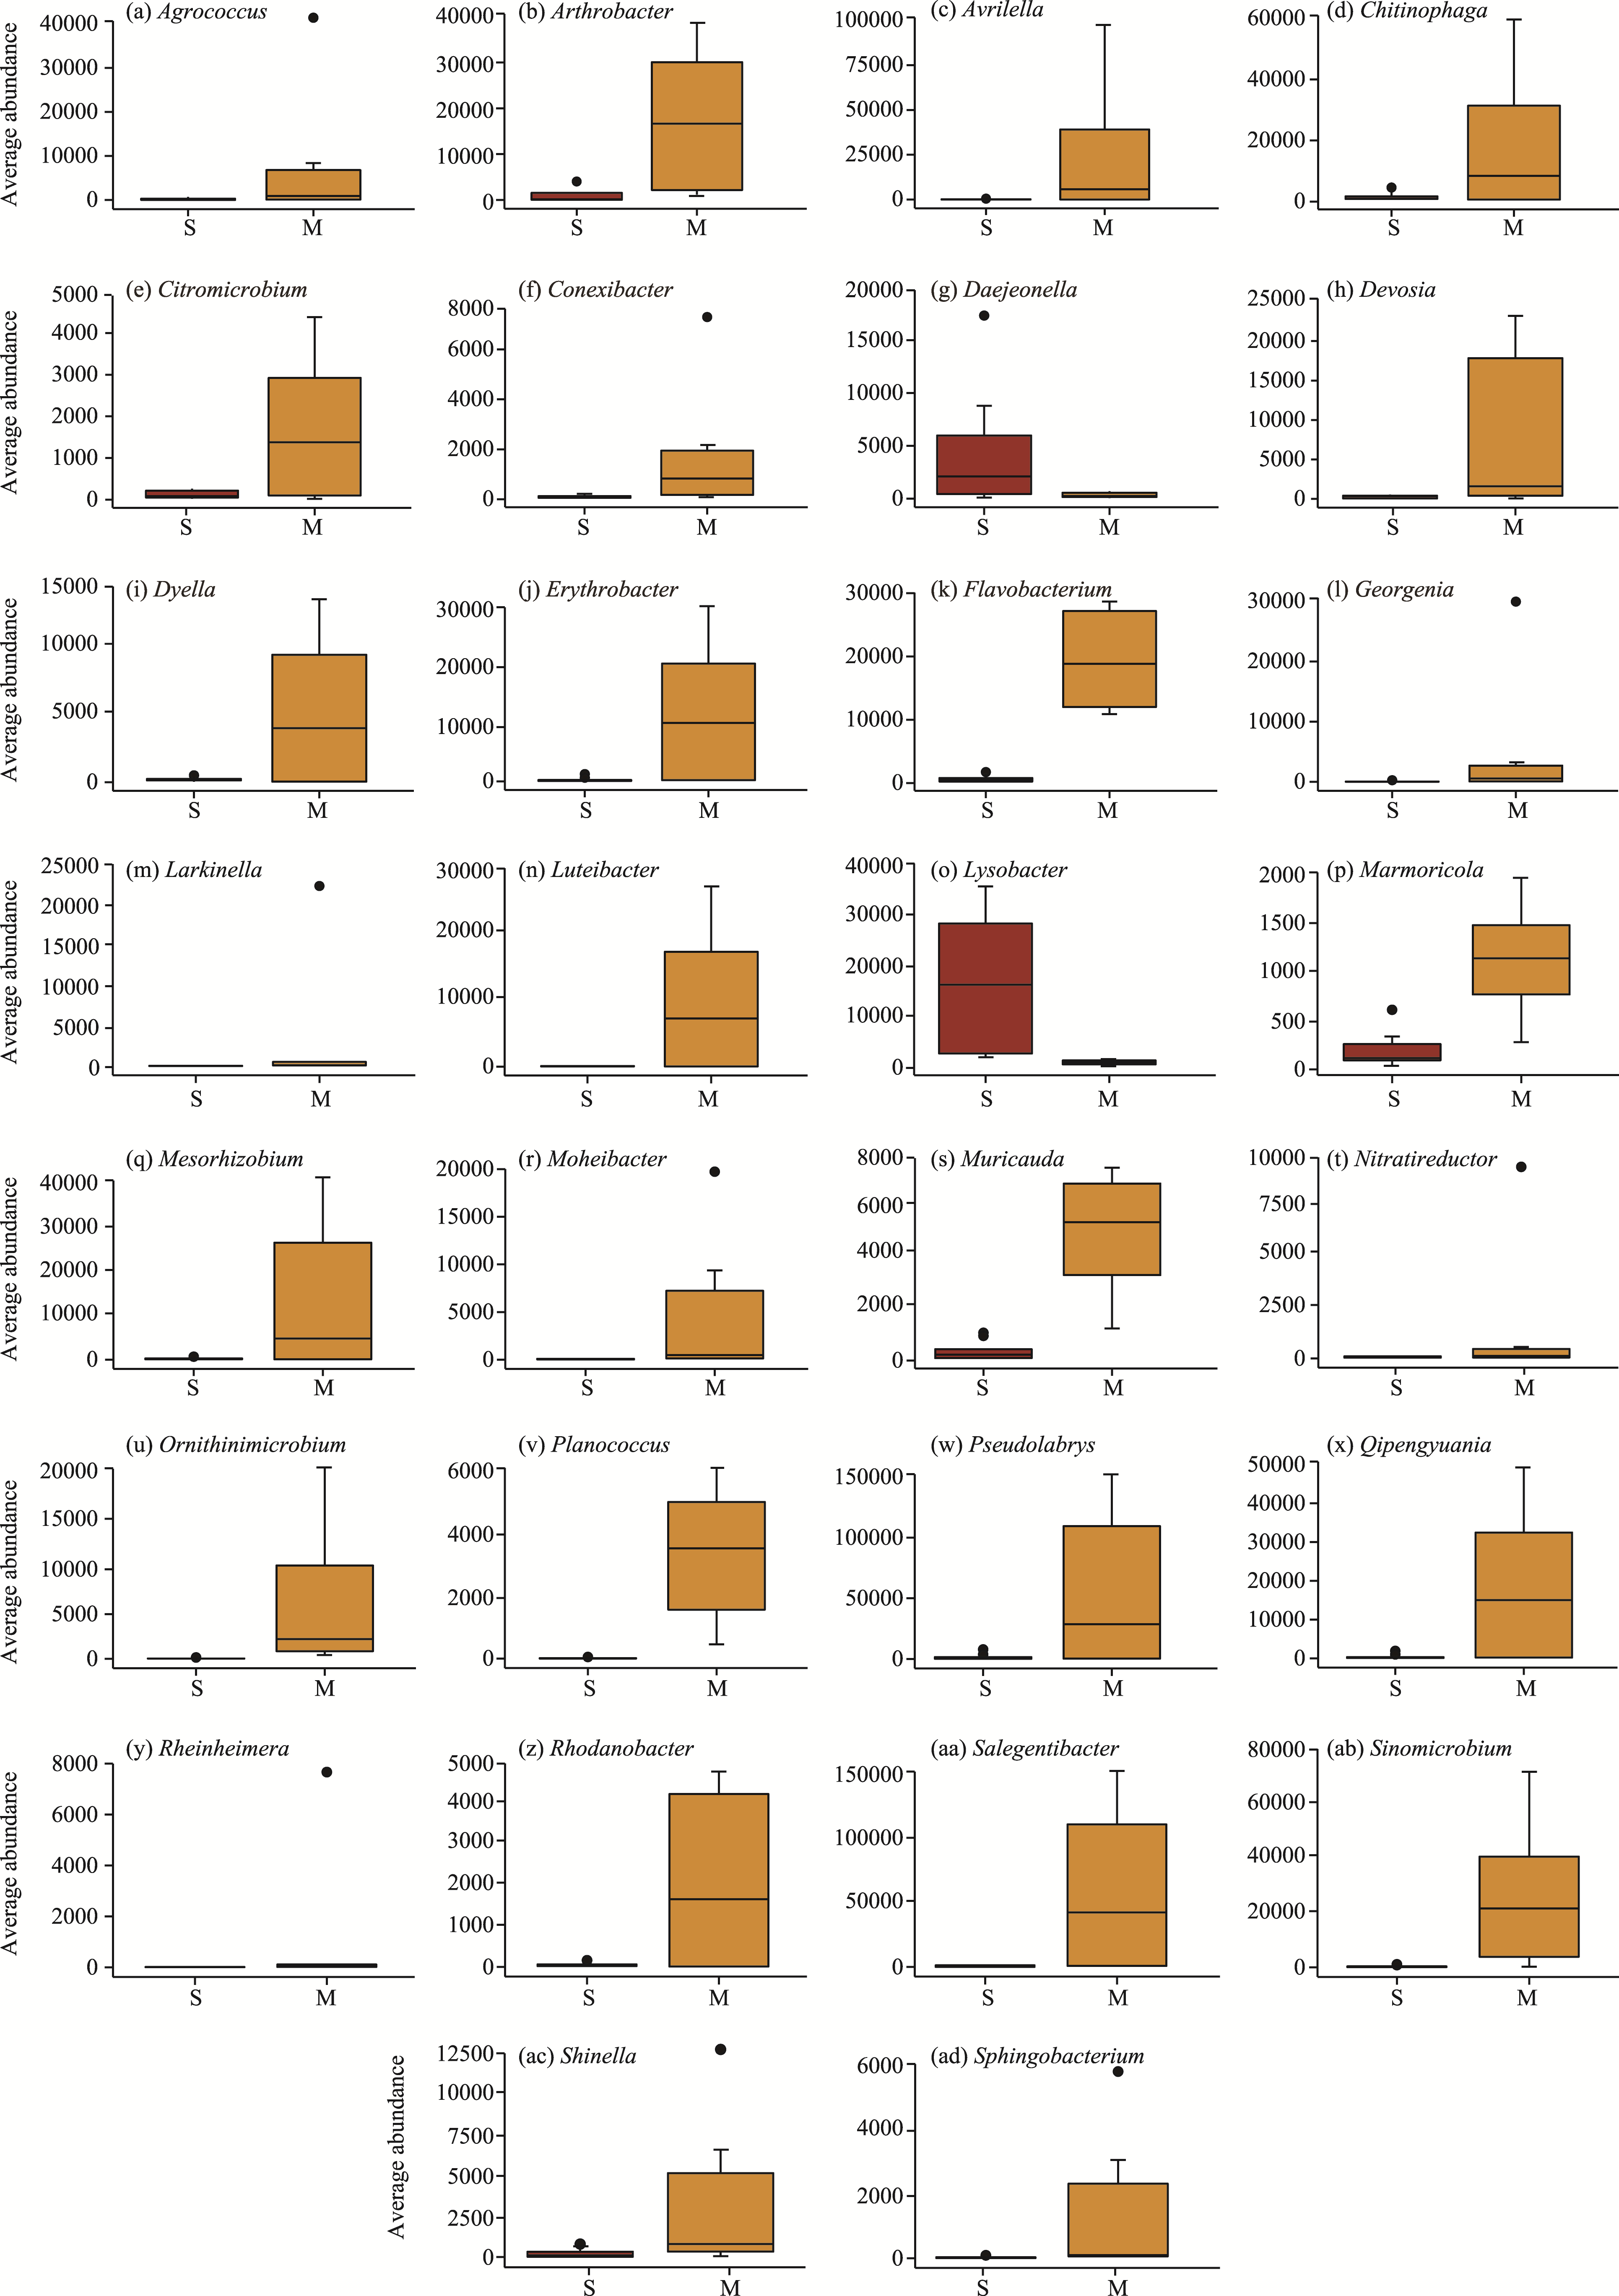
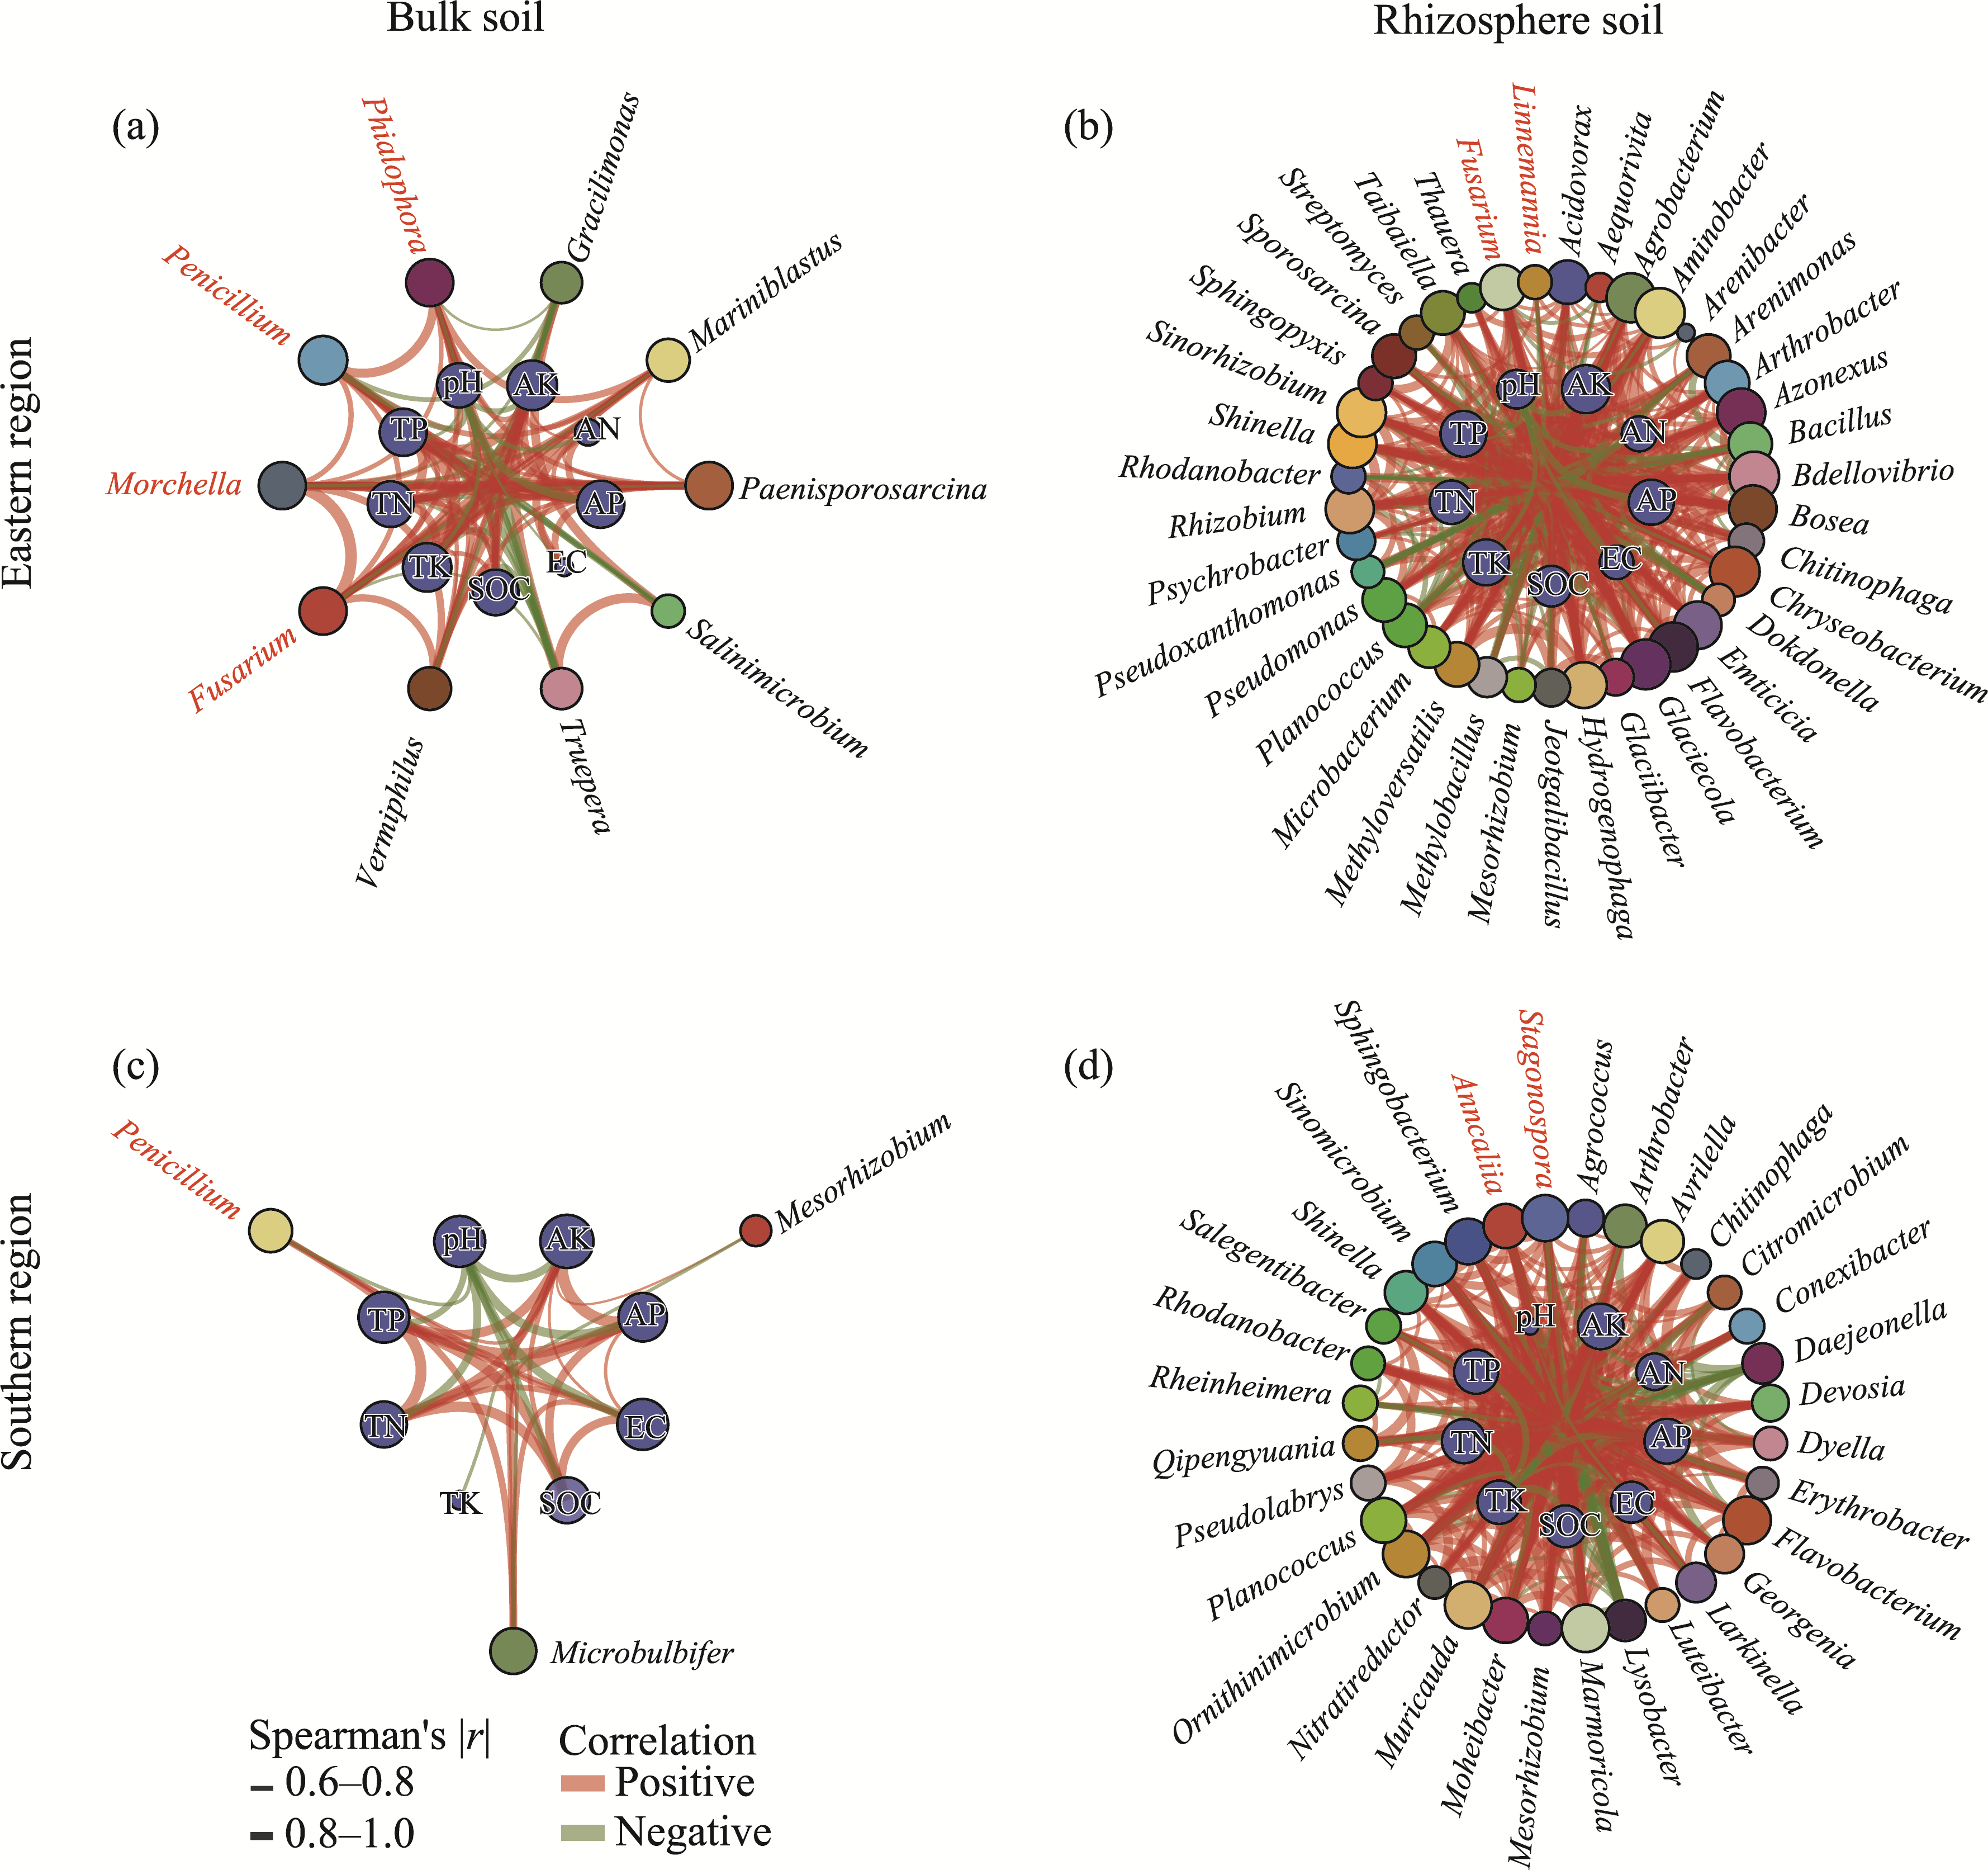
Abstract Continuous cropping can lead to soil environment deterioration, cause plant health problems, and reduce crop productivity. However, the response mechanisms of soil microbial co-occurrence patterns to the duration of continuous melon cropping remain poorly understood. Here, we employed the metagenomic techniques to comparatively investigate the bulk and rhizosphere soil microbial communities of major melon-producing regions (where the duration of continuous melon cropping ranges from 1 to 30 a) in the eastern and southern parts of Xinjiang Uygur Autonomous Region, China. The results showed that soil pH clearly decreased with increasing melon cropping duration, while soil electrical conductivity (EC) and the other soil nutrient indices increased with increasing melon cropping duration (with the exception of AN and TK in the southern melon-producing region). The most dominant bacterial phyla were Proteobacteria and Actinobacteria, and the most abundant fungal phyla were Ascomycota and Mucoromycota. Redundancy analysis (RDA) indicated that soil pH and EC had no significant effects on the bacterial communities. However, after many years of continuous melon cropping in the southern melon-producing region, fungal communities were significantly negatively correlated with soil pH and significantly positively correlated with soil EC (P<0.050). Co-occurrence network analysis showed that continuous melon cropping increased the complexity but decreased the connectivity of the cross-domain microbial networks. Moreover, the enrichment patterns of microorganisms in the main microbial network modules varied significantly with the duration of continuous melon cropping. Based on the analysis of keystone taxa, we found that continuous melon cropping increased some plant pathogens (e.g., Fusarium and Stagonospora) but decreased beneficial bacteria (e.g., Mesorhizobium and Pseudoxanthomonas). In conclusion, this study has greatly enhanced the understanding of the effects of continuous melon cropping on alterations in the microbial community structure and ecological networks in Xinjiang.
|
|
Received: 05 March 2025
Published: 31 October 2025
|
|
Corresponding Authors:
*XUE Nana (E-mail: xuenana0522@xjau.edu.cn)
|
|
|
| [1] |
Arafat Y, Tayyab M, Khan M U, et al. 2019. Long-term monoculture negatively regulates fungal community composition and abundance of tea orchards. Agronomy, 9(8): 466, doi: 10.3390/agronomy9080466.
|
|
|
| [2] |
Bastian M, Heymann S, Jacomy M. 2009. Gephi: an open source software for exploring and manipulating networks. Proceedings of the International AAAI Conference on Web and Social Media, 3(1): 361-362.
|
|
|
| [3] |
Cao W R, Zhang L Z, Hu Y H, et al. 2020. Salinimicrobium nanhaiense sp. nov. and Salinimicrobium oceani sp. nov., two novel species of the family Flavobacteriaceae isolated from the South China Sea. International Journal of Systematic and Evolutionary Microbiology, 70(10): 5263-5270.
|
|
|
| [4] |
Chen C, Lü Q, Tang Q. 2024. Impact of bio-organic fertilizer and reduced chemical fertilizer application on physical and hydraulic properties of cucumber continuous cropping soil. Biomass Conversion and Biorefinery, 14(1): 921-930.
|
|
|
| [5] |
Chen Y D, Du J F, Li Y, et al. 2022. Evolutions and managements of soil microbial community structure drove by continuous cropping. Frontiers in Microbiology, 13: 839494, doi: 10.3389/fmicb.2022.839494.
|
|
|
| [6] |
Cho Y R, Chung H W, Jang G I, et al. 2013. Gracilimonas rosea sp. nov., isolated from tropical seawater, and emended description of the genus Gracilimonas. International Journal of Systematic and Evolutionary Microbiology, 63(11): 4006-4011.
|
|
|
| [7] |
Dang K, Ma Y F, Liang H F, et al. 2024. Distinct planting patterns exert legacy effects on the networks and assembly of root-associated microbiomes in subsequent crops. Science of the Total Environment, 946: 174276, doi: 10.1016/j.scitotenv.2024.174276.
|
|
|
| [8] |
de Cáceres M, Legendre P, Moretti M. 2010. Improving indicator species analysis by combining groups of sites. Oikos, 119(10): 1674-1684.
|
|
|
| [9] |
Delgado A, Gómez J A. 2024. The soil:physical, chemical, and biological properties. In: Villalobos F J, Fereres E. Principles of Agronomy for Sustainable Agriculture. Cham: Springer International Publishing, 15-26.
|
|
|
| [10] |
Dong L L, Xu J, Feng G Q, et al. 2016. Soil bacterial and fungal community dynamics in relation to Panax notoginseng death rate in a continuous cropping system. Scientific Reports, 6(1): 31802, doi: 10.1038/srep31802.
|
|
|
| [11] |
Du J, Liu Y, Zhu H H. 2022. Genome-based analyses of the genus Acidovorax: proposal of the two novel genera Paracidovorax gen. nov., Paenacidovorax gen. nov. and the reclassification of Acidovorax antarcticus as Comamonas antarctica comb. nov. and emended description of the genus Acidovorax. Archives of Microbiology, 205(1): 42, doi: 10.1007/s00203-022-03379-7.
|
|
|
| [12] |
Ekwomadu T I, Mwanza M. 2023. Fusarium fungi pathogens, identification, adverse effects, disease management, and global food security: a review of the latest research. Agriculture, 13(9): 1810, doi: 10.3390/agriculture13091810.
|
|
|
| [13] |
Ezzedine J A, Desdevises Y, Jacquet S. 2022. Bdellovibrio and like organisms: current understanding and knowledge gaps of the smallest cellular hunters of the microbial world. Critical Reviews in Microbiology, 48(4): 428-449.
|
|
|
| [14] |
Fierer N. 2017. Embracing the unknown: disentangling the complexities of the soil microbiome. Nature Reviews Microbiology, 15(10): 579-590.
doi: 10.1038/nrmicro.2017.87
pmid: 28824177
|
|
|
| [15] |
Fu X H, Huang Y, Fu Q, et al. 2023. Critical transition of soil microbial diversity and composition triggered by plant rhizosphere effects. Frontiers in Plant Science, 14: 1252821, doi: 10.3389/fpls.2023.1252821.
|
|
|
| [16] |
Guo L, Chen X W, Li Z Y, et al. 2022. Effects of continuous cropping on bacterial community and diversity in rhizosphere soil of industrial hemp: a five-year experiment. Diversity, 14(4): 250, doi: 10.3390/d14040250.
|
|
|
| [17] |
Gweon H S, Bowes M J, Moorhouse H L, et al. 2021. Contrasting community assembly processes structure lotic bacteria metacommunities along the river continuum. Environmental Microbiology, 23(1): 484-498.
doi: 10.1111/1462-2920.15337
pmid: 33258525
|
|
|
| [18] |
Ha M S, Ryu H, Ju H J, et al. 2023. Diversity and pathogenic characteristics of the Fusarium species isolated from minor legumes in Korea. Scientific Reports, 13(1): 22516, doi: 10.1038/s41598-023-49736-4.
|
|
|
| [19] |
Hao S Y, Zhang Y Y, Li R D, et al. 2024. Agrobacterium-mediated in planta transformation of horticultural plants: current status and future prospects. Scientia Horticulturae, 325: 112693, doi: 10.1016/j.scienta.2023.112693.
|
|
|
| [20] |
Hartemink A E, Barrow N J. 2023. Soil pH-nutrient relationships: the diagram. Plant and Soil, 486(1): 209-215.
|
|
|
| [21] |
Hartman K, van der Heijden M G A, Wittwer R A, et al. 2018. Cropping practices manipulate abundance patterns of root and soil microbiome members paving the way to smart farming. Microbiome, 6(1): 14, doi: 10.1186/s40168-017-0389-9.
pmid: 29338764
|
|
|
| [22] |
He D X, Yao X D, Zhang P Y, et al. 2023. Effects of continuous cropping on fungal community diversity and soil metabolites in soybean roots. Microbiology Spectrum, 11(6): e01786-23, doi: 10.1128/spectrum.01786-23.
|
|
|
| [23] |
Huang W J, Sun D L, Fu J T, et al. 2020. Effects of continuous sugar beet cropping on rhizospheric microbial communities. Genes, 11(1): 13, doi: 10.3390/genes11010013.
|
|
|
| [24] |
Hufnagel J, Reckling M, Ewert F. 2020. Diverse approaches to crop diversification in agricultural research. A review. Agronomy for Sustainable Development, 40(2): 14, doi: 10.1007/s13593-020-00617-4.
|
|
|
| [25] |
Ji L H, Xin Y, Guo D F. 2023. Soil fungal community structure and its effect on CO2 emissions in the Yellow River Delta. International Journal of Environmental Research and Public Health, 20(5): 4190, doi: 10.3390/ijerph20054190.
|
|
|
| [26] |
Jia J Y, Hu G Z, Ni G, et al. 2024. Bacteria drive soil multifunctionality while fungi are effective only at low pathogen abundance. Science of the Total Environment, 906: 167596, doi: 10.1016/j.scitotenv.2023.167596.
|
|
|
| [27] |
Kim J M, Roh A S, Choi S C, et al. 2016. Soil pH and electrical conductivity are key edaphic factors shaping bacterial communities of greenhouse soils in Korea. Journal of Microbiology, 54(12): 838-845.
doi: 10.1007/s12275-016-6526-5
pmid: 27888456
|
|
|
| [28] |
Ku Y L, Li W Q, Mei X L, et al. 2022. Biological control of melon continuous cropping obstacles: weakening the negative effects of the vicious cycle in continuous cropping soil. Microbiology Spectrum, 10(6): e01776-22, doi: 10.1128/spectrum.01776-22.
|
|
|
| [29] |
Li H Y, Li C H, Song X, et al. 2022. Impacts of continuous and rotational cropping practices on soil chemical properties and microbial communities during peanut cultivation. Scientific Reports, 12(1): 2758, doi: 10.1038/s41598-022-06789-1.
pmid: 35177784
|
|
|
| [30] |
Li J, Cheng X Y, Chu G X, et al. 2023a. Continuous cropping of cut chrysanthemum reduces rhizospheric soil bacterial community diversity and co-occurrence network complexity. Applied Soil Ecology, 185: 104801, doi: 10.1016/j.apsoil.2022.104801.
|
|
|
| [31] |
Li M Y, Wang J L, Zhou Q, et al. 2023b. Effects of continuous melon cropping on rhizospheric fungal communities. Rhizosphere, 27: 100726, doi: 10.1016/j.rhisph.2023.100726.
|
|
|
| [32] |
Li Y, Xiao J, de Hoog G S, et al. 2017. Biodiversity and human-pathogenicity of Phialophora verrucosa and relatives in Chaetothyriales. Persoonia, 38(1): 1-19.
|
|
|
| [33] |
Li Y, Tian D S, Pan J X, et al. 2023c. Different patterns and drivers of fungal communities between phyllosphere and rhizosphere in alpine grasslands. Functional Ecology, 37(3): 523-535.
|
|
|
| [34] |
Liu L J, Sun C L, Liu S R, et al. 2015. Bioorganic fertilizer enhances soil suppressive capacity against bacterial wilt of tomato. PLoS ONE, 10(4): e0121304, doi: 10.1371/journal.pone.0121304.
|
|
|
| [35] |
Liu S, Wang Z Y, Niu J F, et al. 2021. Changes in physicochemical properties, enzymatic activities, and the microbial community of soil significantly influence the continuous cropping of Panax quinquefolius L. (American ginseng). Plant and Soil, 463(1): 427-446.
|
|
|
| [36] |
Liu Y M, Li Z Y, Zhong C, et al. 2023. Alleviating effect of melatonin on melon seed germination under autotoxicity and saline-alkali combined stress. Journal of Plant Growth Regulation, 42(4): 2474-2485.
|
|
|
| [37] |
Liu Z G, Ren H S, Li H F, et al. 2020. Effects of different nitrogen application rates on growth, nutrient absorption and utilization of muskmelon in facilities. Xinjiang Agricultural Sciences, 57(10): 1792-1801. (in Chinese)
doi: 10.6048/j.issn.1001-4330.2020.10.004
|
|
|
| [38] |
Lopes L D, Hao J J, Schachtman D P. 2021. Alkaline soil pH affects bulk soil, rhizosphere and root endosphere microbiomes of plants growing in a sandhills ecosystem. FEMS Microbiology Ecology, 97(4): fiab028, doi: 10.1093/femsec/fiab028.
|
|
|
| [39] |
Lu L L, Wang B J, Zhang Y, et al. 2019. Identification and nitrogen removal characteristics of Thauera sp. FDN-01 and application in sequencing batch biofilm reactor. Science of the Total Environment, 690: 61-69.
|
|
|
| [40] |
Lund P A, de Biase D, Liran O, et al. 2020. Understanding how microorganisms respond to acid pH is central to their control and successful exploitation. Frontiers in Microbiology, 11: 556140, doi: 10.3389/fmicb.2020.556140.
|
|
|
| [41] |
Ma Z, Li P, Yang C Z, et al. 2023. Soil bacterial community response to continuous cropping of cotton. Frontiers in Microbiology, 14: 1125564, doi: 10.3389/fmicb.2023.1125564.
|
|
|
| [42] |
Manici L M, Caputo F, de Sabata D, et al. 2024. The enzyme patterns of Ascomycota and Basidiomycota fungi reveal their different functions in soil. Applied Soil Ecology, 196: 105323, doi: 10.1016/j.apsoil.2024.105323.
|
|
|
| [43] |
Mitra D, Mondal R, Khoshru B, et al. 2022. Actinobacteria-enhanced plant growth, nutrient acquisition, and crop protection: advances in soil, plant, and microbial multifactorial interactions. Pedosphere, 32(1): 149-170.
|
|
|
| [44] |
Mukherjee A, Reddy M S. 2020. Metatranscriptomics: an approach for retrieving novel eukaryotic genes from polluted and related environments. 3 Biotech, 10(2): 71, doi: 10.1007/s13205-020-2057-1.
|
|
|
| [45] |
Oliver R P, Friesen T L, Faris J D, et al. 2012. Stagonospora nodorum: from pathology to genomics and host resistance. Annual Review of Phytopathology, 50(1): 23-43.
|
|
|
| [46] |
Pang Z Q, Dong F, Liu Q, et al. 2021. Soil metagenomics reveals effects of continuous sugarcane cropping on the structure and functional pathway of rhizospheric microbial community. Frontiers in Microbiology, 12: 627569, doi: 10.3389/fmicb.2021.627569.
|
|
|
| [47] |
Pervaiz Z H, Iqbal J, Zhang Q M, et al. 2020. Continuous cropping alters multiple biotic and abiotic indicators of soil health. Soil Systems, 4(4): 59, doi: 10.3390/soilsystems4040059.
|
|
|
| [48] |
Philippot L, Chenu C, Kappler A, et al. 2024. The interplay between microbial communities and soil properties. Nature Reviews Microbiology, 22(4): 226-239.
|
|
|
| [49] |
Robinson M D, McCarthy D J, Smyth G K. 2010. EdgeR: a bioconductor package for differential expression analysis of digital gene expression data. Bioinformatics, 26(1): 139-140.
doi: 10.1093/bioinformatics/btp616
pmid: 19910308
|
|
|
| [50] |
Rousk J, Bååth E, Brookes P C, et al. 2010. Soil bacterial and fungal communities across a pH gradient in an arable soil. The ISME Journal, 4(10): 1340-1351.
|
|
|
| [51] |
Shi G Y, Sun H Q, Calderón‐Urrea A, et al. 2021. Bacterial communities as indicators of soil health under a continuous cropping system. Land Degradation & Development, 32(7): 2393-2408.
|
|
|
| [52] |
Spain A M, Krumholz L R, Elshahed M S. 2009. Abundance, composition, diversity and novelty of soil Proteobacteria. The ISME Journal, 3(8): 992-1000.
|
|
|
| [53] |
Su J Q, Ding L J, Xue K, et al. 2015. Long-term balanced fertilization increases the soil microbial functional diversity in a phosphorus-limited paddy soil. Molecular Ecology, 24(1): 136-150.
|
|
|
| [54] |
Szabó B, Váczy‐Földi M, Vad C F, et al. 2024. Connectivity loss in experimental pond networks leads to biodiversity loss in microbial metacommunities. Global Change Biology, 30(12): e70001, doi: 10.1111/gcb.70001.
|
|
|
| [55] |
Tan G, Liu Y J, Peng S G, et al. 2021. Soil potentials to resist continuous cropping obstacle: three field cases. Environmental Research, 200: 111319, doi: 10.1016/j.envres.2021.111319.
|
|
|
| [56] |
Wagg C, Schlaeppi K, Banerjee S, et al. 2019. Fungal-bacterial diversity and microbiome complexity predict ecosystem functioning. Nature Communications, 10(1): 4841, doi: 10.1038/s41467-019-12798-y.
pmid: 31649246
|
|
|
| [57] |
Wang J L, Li M Y, Zhou Q, et al. 2023. Effects of continuous cropping Jiashi muskmelon on rhizosphere microbial community. Frontiers in Microbiology, 13: 1086334, doi: 10.3389/fmicb.2022.1086334.
|
|
|
| [58] |
Wang R Q, Li X X, Lü F J, et al. 2024a. Sesame bacterial wilt significantly alters rhizosphere soil bacterial community structure, function, and metabolites in continuous cropping systems. Microbiological Research, 282: 127649, doi: 10.1016/j.micres.2024.127649.
|
|
|
| [59] |
Wang X, Yang M H, Gao L X, et al. 2024b. Continuous cropping obstacles: insights from the community composition and the imbalance carbon fluxes within soil nematode food web. Geoderma, 451: 117060, doi: 10.1016/j.geoderma.2024.117060.
|
|
|
| [60] |
Wen T, Xie P H, Yang S D, et al. 2022. GgClusterNet: An R package for microbiome network analysis and modularity-based multiple network layouts. iMeta, 1(3): e32, doi: 10.1002/imt2.32.
|
|
|
| [61] |
Xiong W, Li Z G, Liu H J, et al. 2015. The effect of long-term continuous cropping of black pepper on soil bacterial communities as determined by 454 pyrosequencing. PLoS ONE, 10(8): e0136946, doi: 10.1371/journal.pone.0136946.
|
|
|
| [62] |
Yuan R F, Wang F H, Xia Y. 2024. Development status and countermeasures of watermelon and muskmelon industry in Xinjiang. China Food Safety Magazine, 29: 176-179. (in Chinese)
|
|
|
| [63] |
Zhang Z Z, Zhang Z D, Han X Y, et al. 2020. Specific response mechanism to autotoxicity in melon (Cucumis melo L.) root revealed by physiological analyses combined with transcriptome profiling. Ecotoxicology and Environmental Safety, 200: 110779, doi: 10.1016/j.ecoenv.2020.110779.
|
|
|
| [64] |
Zhang Z Z, Wu J H, Xi Y P, et al. 2022. Effects of autotoxicity on seed germination, gas exchange attributes and chlorophyll fluorescence in melon seedlings. Journal of Plant Growth Regulation, 41(3): 993-1003.
|
|
|
| [65] |
Zhou L J, Lai Y Z, Shao Z Y, et al. 2023. Keystone bacteria in a thiosulfate-driven autotrophic denitrification microbial community. Chemical Engineering Journal, 470: 144321, doi: 10.1016/j.cej.2023.144321.
|
|
|
| [66] |
Zhu S S, Lei Y H, Wang C, et al. 2021. Patterns of yeast diversity distribution and its drivers in rhizosphere soil of Hami melon orchards in different regions of Xinjiang. BMC Microbiology, 21(1): 170, doi: 10.1186/s12866-021-02222-1.
pmid: 34090353
|
|
|
|
Viewed |
|
|
|
Full text
|
|
|
|
|
Abstract
|
|
|
|
|
Cited |
|
|
|
|
| |
Shared |
|
|
|
|
| |
Discussed |
|
|
|
|