| Research article |
|

|
|
|
| Effects of dry soil aggregate size on organic carbon, total nitrogen, and soil texture under different land uses |
HAO Mingyang1, HE Jianuo1, HU Weiyin2, ZHAO Zhou3, LI Can1, SONG Shikai1, ZOU Xueyong4, CHANG Chunping1, GUO Zhongling1,*( ) ) |
1School of Geographical Sciences/Hebei Key Laboratory of Environmental Change and Ecological Construction/Hebei Technology Innovation Center for Remote Sensing Identification of Environmental Change, Hebei Normal University, Shijiazhuang 050024, China
2Soil and Water Conservation Station of Hebei Province, Shijiazhuang 050021, China
3Environmental Protection Technology Information Service Center at Jingxing of Shijiazhuang, Shijiazhuang 050399, China
4State Key Laboratory of Earth Surface Processes and Resource Ecology, Ministry of Education, Engineering Center of Desertification and Blown-sand Control, Faculty of Geographical Science, Beijing Normal University, Beijing 100875, China |
|
|
|
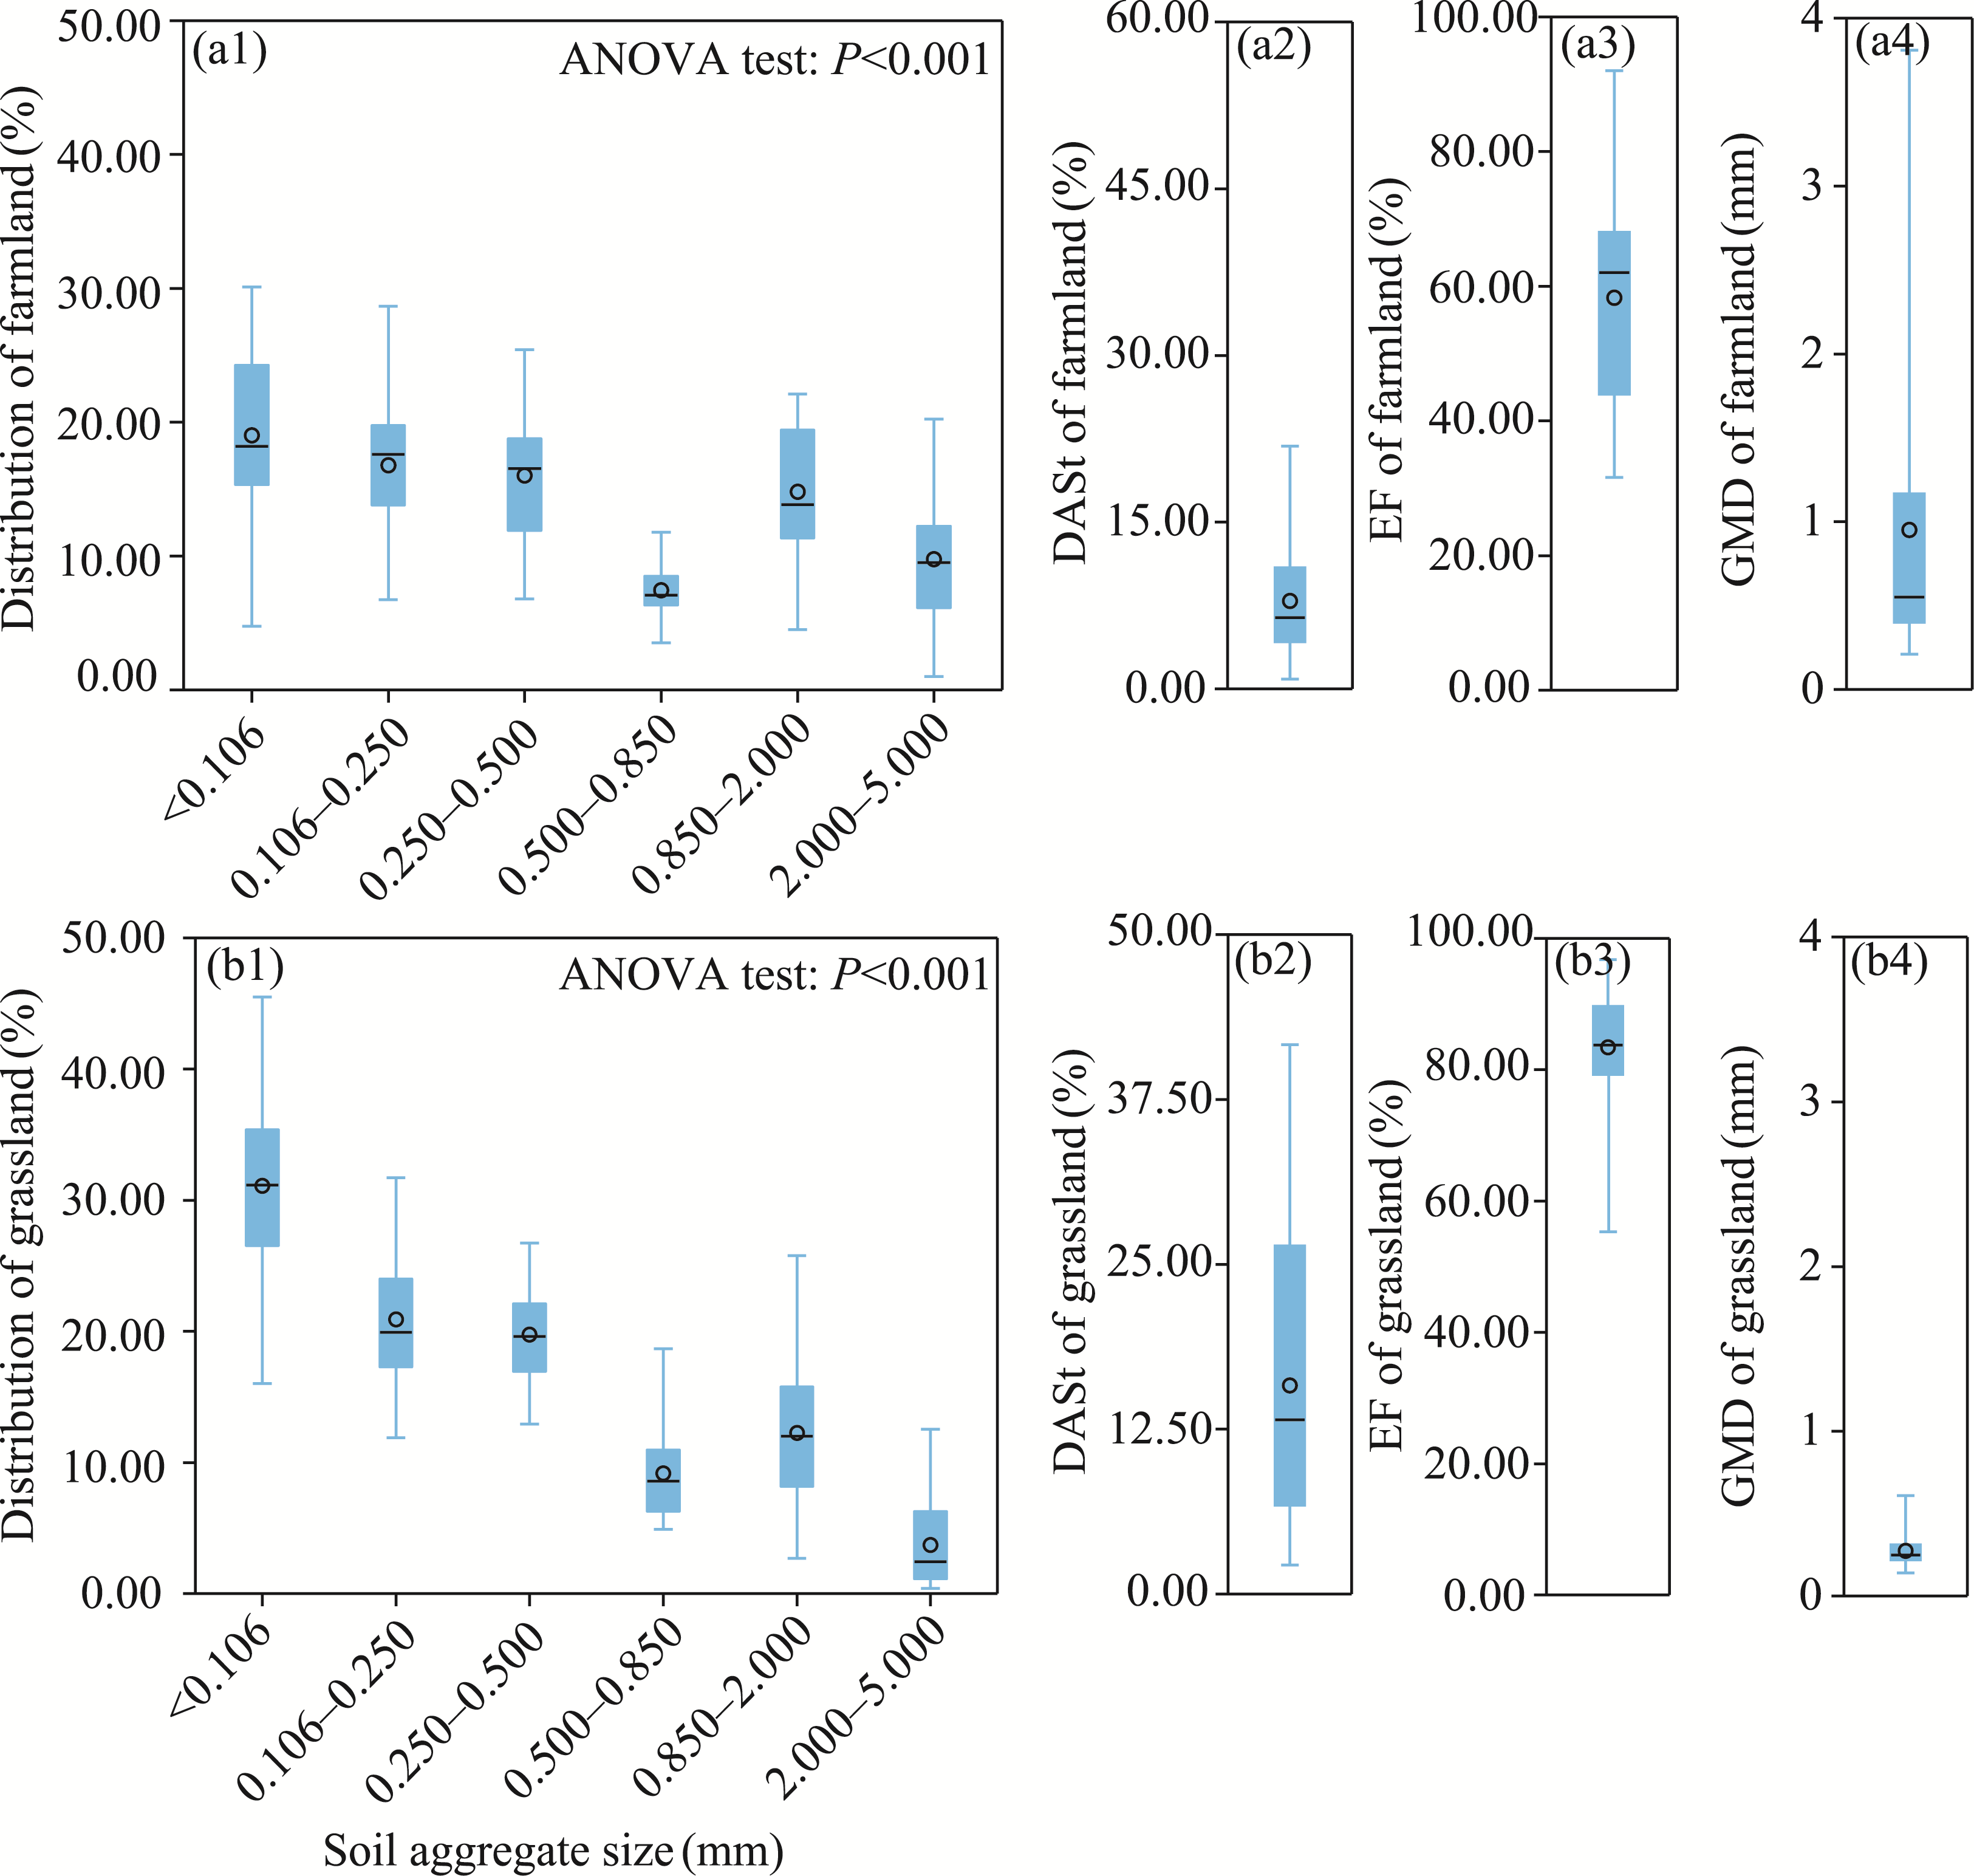
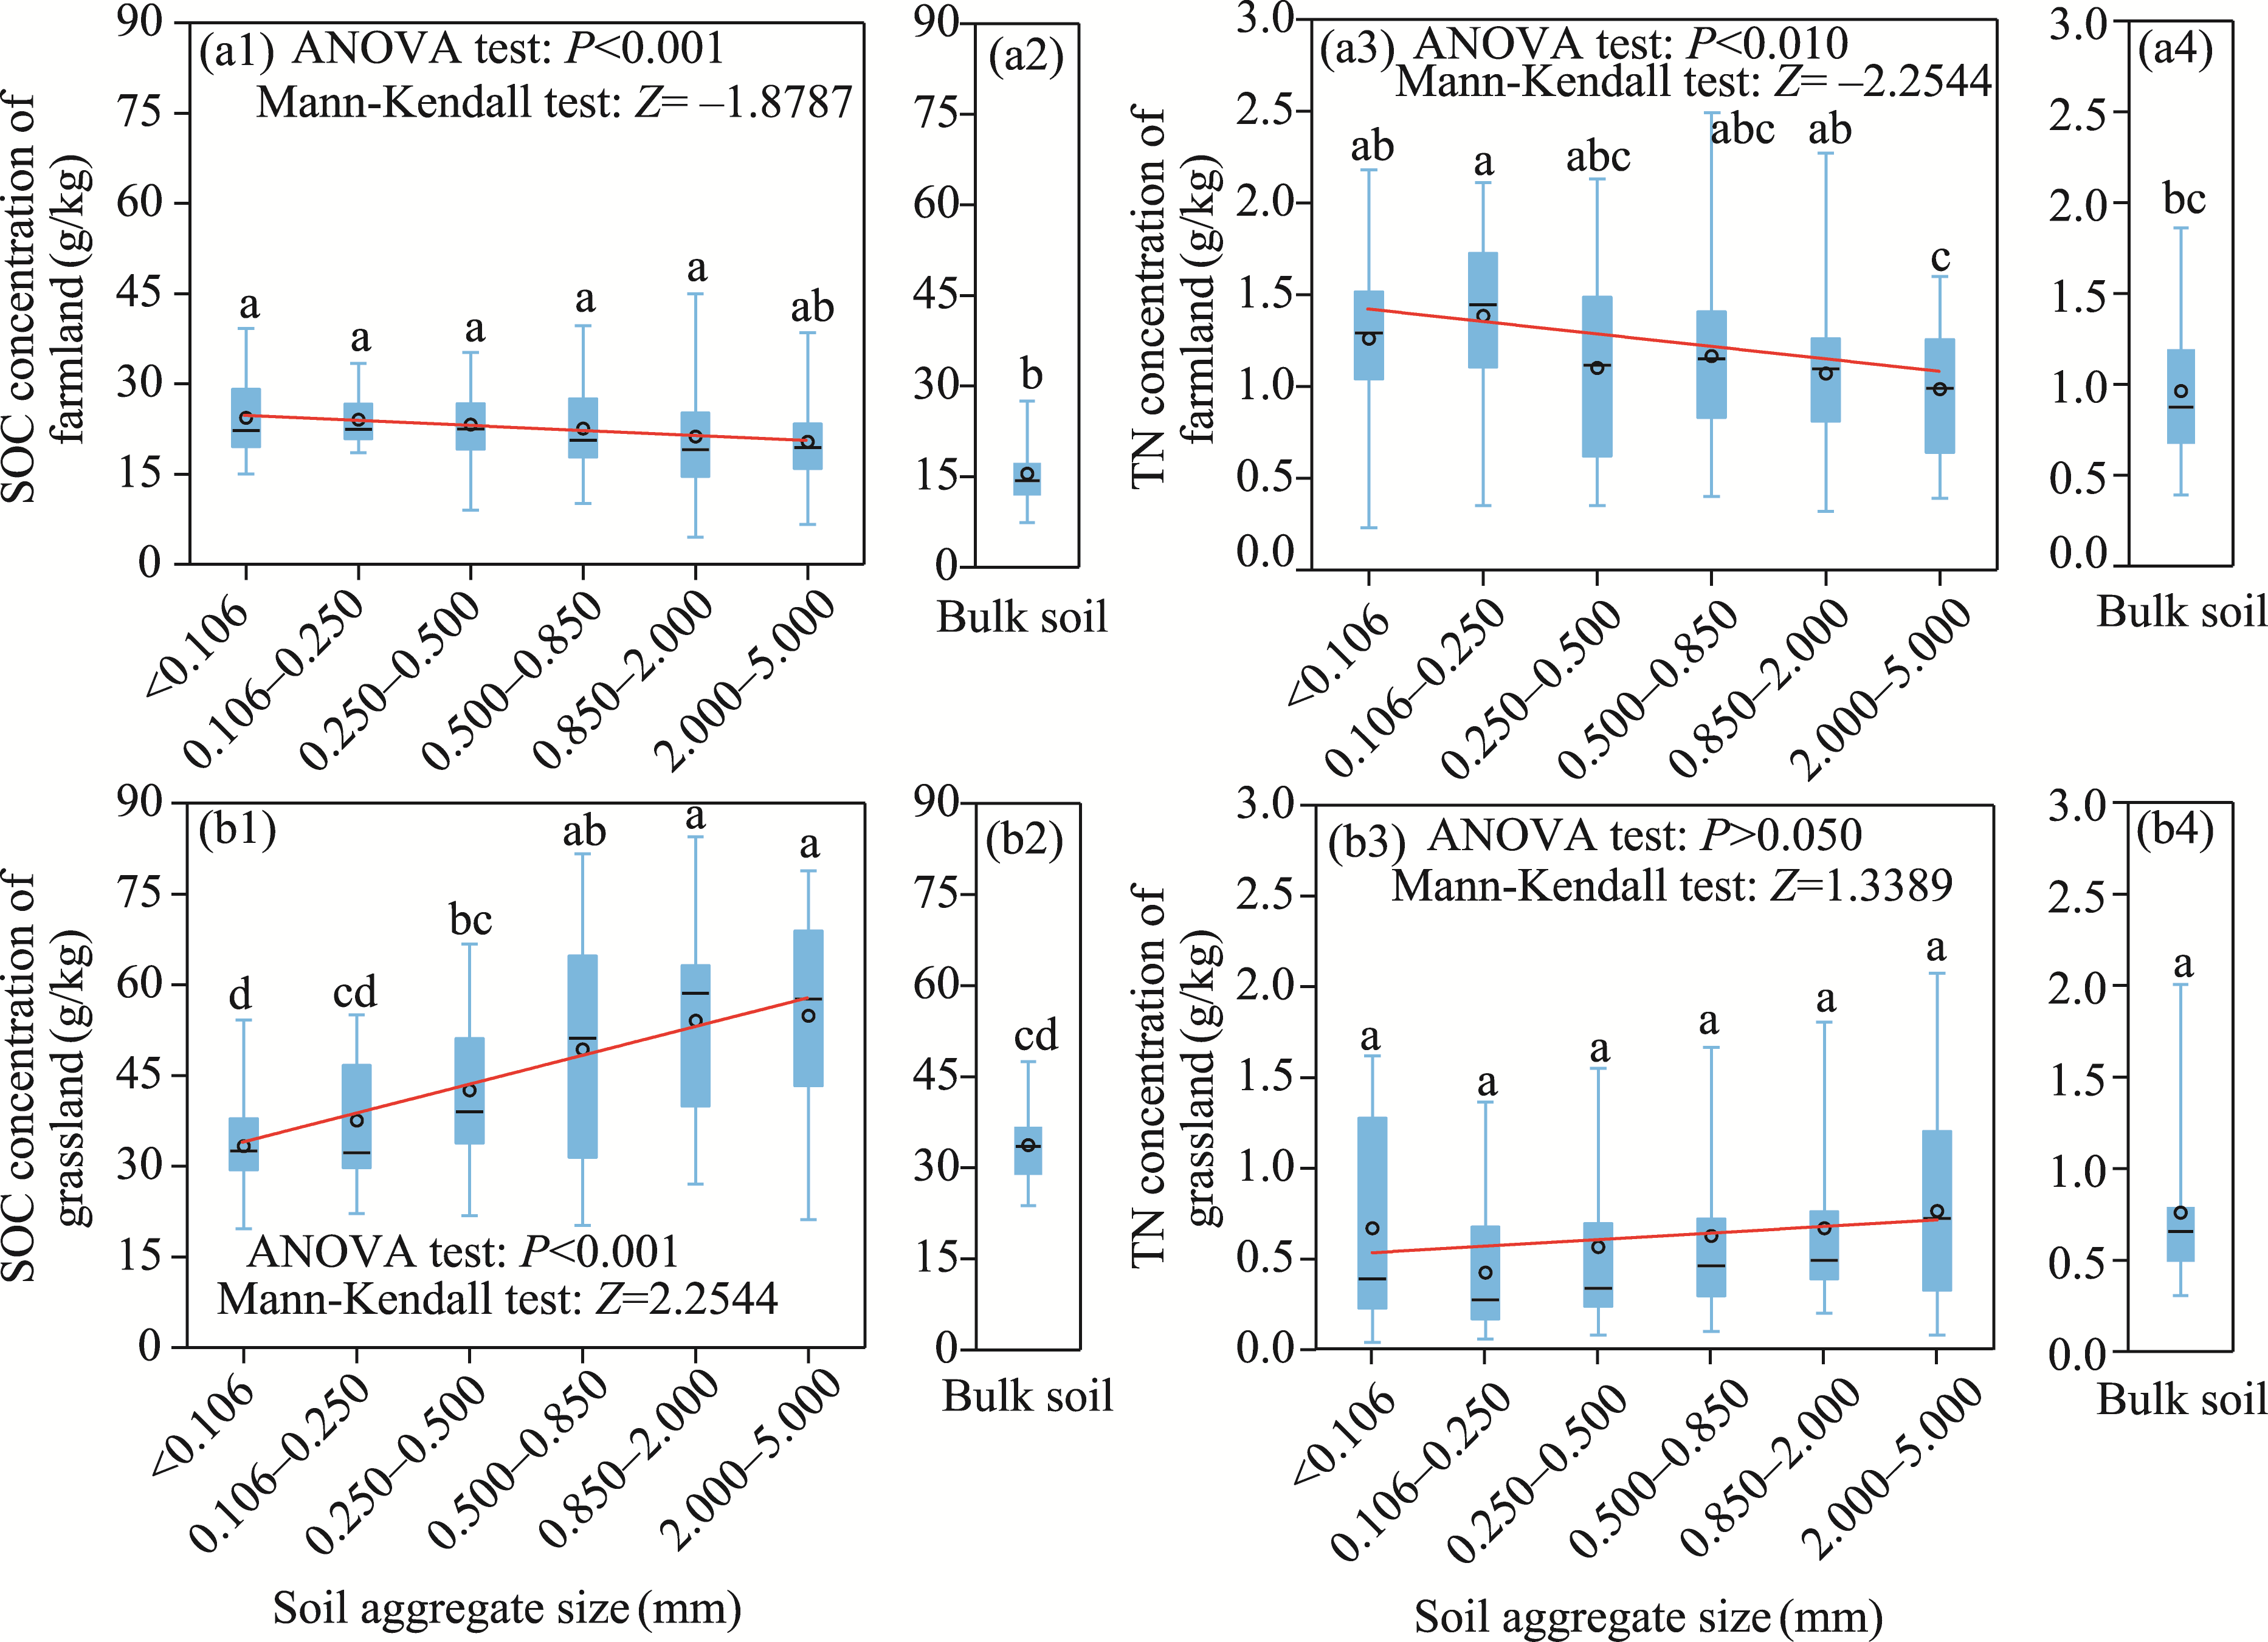
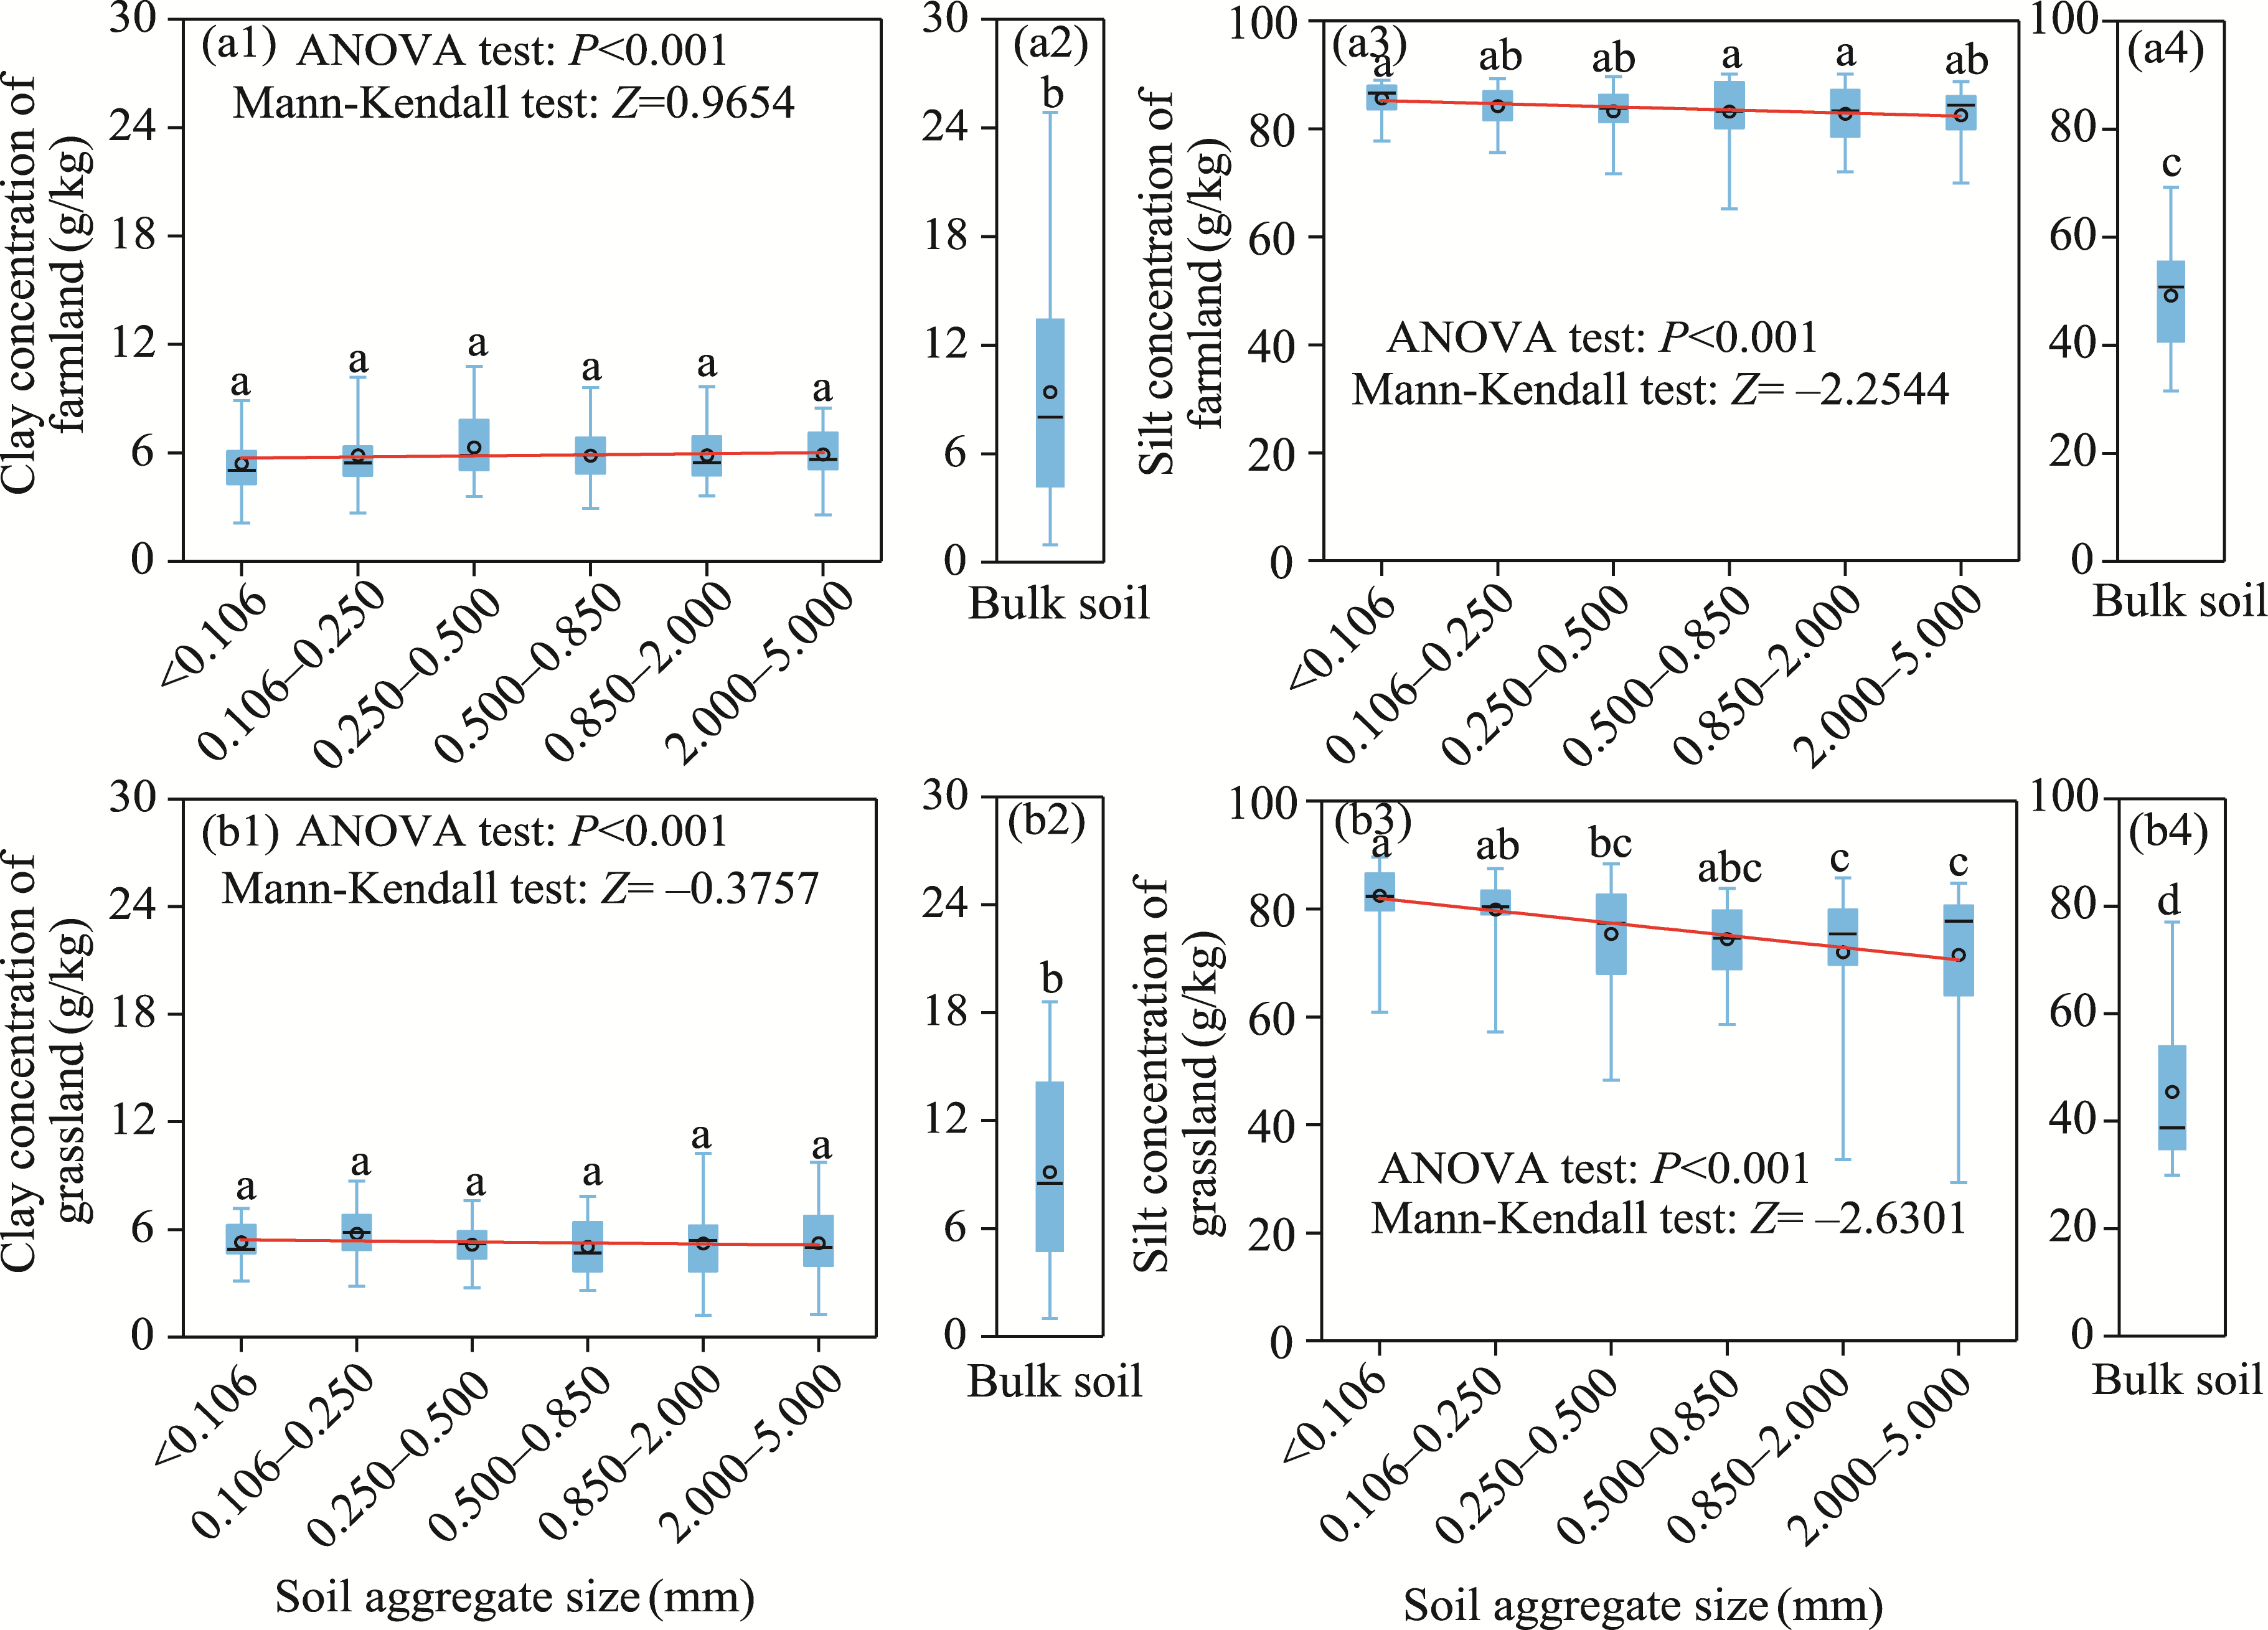
Abstract Soil organic carbon (SOC) and total nitrogen (TN) play an important role in the global carbon and nitrogen cycles. Soil aggregates are critical reservoir of SOC and TN. Therefore, in areas with severe wind erosion, the changes in the accumulation of SOC, TN, clay, silt, and sand contents within different dry aggregate size fractions can offer crucial insights into soil conservation by the control of wind erosion. In this study, surface soil samples (0-5 cm depth) were collected from farmland and grassland in the Bashang region of northern China in 2020. The bulk soil and aggregate size fractions were used to determine the concentrations of SOC, TN, clay, silt, and sand. The results showed that: (1) farmland had lower SOC and higher TN than grassland; (2) SOC in the aggregates of farmland decreased with increasing aggregate size (P<0.010), while SOC in the aggregates of grassland increased with increasing aggregate size (P<0.010), and nonsignificant variation of TN and clay was observed among different aggregate sizes; (3) the mean of aggregate silt significantly decreased with increasing aggregate size and the mean of aggregate sand increased with increasing aggregate size (P<0.001); (4) no correlations between sand or silt of aggregate and TN or texture of bulk soil was found; and (5) SOC in bulk soil was correlated with those in different aggregate sizes, and was also affected by the texture of bulk soil (P<0.010). This study highlights the role of dry soil aggregate size in the redistribution of SOC, TN, clay, silt, and sand contents under different land uses, thereby facilitating the understanding of the process of wind erosion induced SOC, TN, and mineral dust emission.
|
|
Received: 14 March 2025
Published: 31 October 2025
|
|
Corresponding Authors:
*GUO Zhongling (E-mail: gzldhr@hebtu.edu.cn)
|
| Cite this article:
HAO Mingyang, HE Jianuo, HU Weiyin, ZHAO Zhou, LI Can, SONG Shikai, ZOU Xueyong, CHANG Chunping, GUO Zhongling. Effects of dry soil aggregate size on organic carbon, total nitrogen, and soil texture under different land uses. Journal of Arid Land, 2025, 17(10): 1482-1495.
URL:
http://jal.xjegi.com/10.1007/s40333-025-0030-x OR http://jal.xjegi.com/Y2025/V17/I10/1482
|
|
|
| [1] |
Barber R G. 1995. Soil degradation in the tropical lowlands of Santa Cruz, Eastern Bolivia. Land Degradation & Development, 6(2): 95-107.
|
|
|
| [2] |
Barthes B G, Kouakoua E, Larre-Larrouy M C, et al. 2008. Texture and sesquioxide effects on water-stable aggregates and organic matter in some tropical soils. Geoderma, 143(1-2): 14-25.
|
|
|
| [3] |
Bronick C J, Lal R. 2005. Soil structure and management: A review. Geoderma, 124(1-2): 3-22.
|
|
|
| [4] |
Buschiazzo D E. 2015. Management systems in southern South America. In: Peterson G A, Unger P W, Payne W A. Agronomy Monographs. Madison: Soil Science Society of America, 395-425.
|
|
|
| [5] |
Camenzind T, Homeier J, Dietrich K, et al. 2016. Opposing effects of nitrogen versus phosphorus additions on mycorrhizal fungal abundance along an elevational gradient in tropical montane forests. Soil Biology and Biochemistry, 94: 37-47.
|
|
|
| [6] |
Carter M R. 2002. Soil quality for sustainable land management. Agronomy Journal, 94(1): 38-47.
|
|
|
| [7] |
Ciric V, Manojlovic M, Nesic L, et al. 2012. Soil dry aggregate size distribution: Effects of soil type and land use. Journal of Soil Science and Plant Nutrition, 12(4): 689-703.
|
|
|
| [8] |
Dalal R C, Bridge B J. 1995. Aggregation and organic matter storage in sub-humid and semi-arid soils. In: Carter M R, Stewart B A. Structure and Organic Matter Storage in Agricultural Soils. Boston: CRC Press, 263-307.
|
|
|
| [9] |
Du H Q, Li S, Webb N P, et al. 2021. Soil organic carbon (SOC) enrichment in aeolian sediments and SOC loss by dust emission in the desert steppe, China. Science of the Total Environment, 798: 149189, doi: 10.1016/j.scitotenv.2021.149189.
|
|
|
| [10] |
Duan L X, Sheng H, Yuan H, et al. 2021. Land use conversion and lithology impacts soil aggregate stability in subtropical China. Geoderma, 389: 114953, doi: 10.1016/j.geoderma.2021.114953.
|
|
|
| [11] |
Edwards A P, Bremner J M. 1967. Microaggregates in soils. Journal of Soil Science, 18(1): 64-73.
|
|
|
| [12] |
Eksperiandova L P, Fedorov O I, Stepanenko N A. 2011. Estimation of metrological characteristics of the element analyzer EuroVector EA-3000 and its potential in the single-reactor CHNS mode. Microchemical Journal, 99(2): 235-238.
|
|
|
| [13] |
Fang X M, Chen F S, Wan S Z, et al. 2015. Topsoil and deep soil organic carbon concentration and stability vary with aggregate size and vegetation type in subtropical China. PLoS ONE, 10(9): e0139380, doi: 10.1371/journal.pone.0139380.
|
|
|
| [14] |
Fu B J, Liu S L, Chen L D, et al. 2004. Soil quality regime in relation to land cover and slope position across a highly modified slope landscape. Ecological Research, 19(1): 111-118.
|
|
|
| [15] |
Gajic B, Dugalic G, Djurovic N. 2006. Comparison of soil organic matter content, aggregate composition and water stability of gleyic fluvisol from adjacent forest and cultivated areas. Agronomy Research, 4(2): 499-508.
|
|
|
| [16] |
Gelaw A M, Singh B R, Lal R. 2015. Organic carbon and nitrogen associated with soil aggregates and particle sizes under different land uses in Tigray, northern Ethiopia. Land Degradation & Development, 26(7): 690-700.
|
|
|
| [17] |
Gentsch N, Riechers F L, Boy J, et al. 2024. Cover crops improve soil structure and change organic carbon distribution in macroaggregate fractions. Soil, 10(1): 139-150.
|
|
|
| [18] |
Green V S, Cavigelli M A, Dao T H, et al. 2005. Soil physical properties and aggregate-associated C, N, and P distributions in organic and conventional cropping systems. Soil Science, 170(10): 822-831.
|
|
|
| [19] |
Grueneberg E, Schoening I, Hessenmoeller D, et al. 2013. Organic layer and clay content control soil organic carbon stocks in density fractions of differently managed German beech forests. Forest Ecology and Management, 303: 1-10.
|
|
|
| [20] |
Gulde S, Chung H, Amelung W, et al. 2008. Soil carbon saturation controls labile and stable carbon pool dynamics. Soil Science Society of America Journal, 72(3): 605-612.
|
|
|
| [21] |
Guo Z L, Chang C P, Wang R D, et al. 2017. Comparison of different methods to determine wind-erodible fraction of soil with rock fragments under different tillage/management. Soil and Tillage Research, 168: 42-49.
|
|
|
| [22] |
Huang R, Lan M L, Liu J, et al. 2017. Soil aggregate and organic carbon distribution at dry land soil and paddy soil: The role of different straws returning. Enviromental Science and Pollution Research, 24(36): 27942-27952.
|
|
|
| [23] |
Igwe C A, Nkemakosi J T. 2007. Nutrient element contents and cation exchange capacity in fine fractions of southeastern Nigerian soils in relation to their stability. Communications in Soil Science and Plant Analysis, 38(9-10): 1221-1242.
|
|
|
| [24] |
John B, Yamashita T, Ludwig B, et al. 2005. Storage of organic carbon in aggregate and density fractions of silty soils under different types of land use. Geoderma, 128(1-2): 63-79.
|
|
|
| [25] |
Khan F U, Khan A A, Li K, et al. 2022. Influences of long-term crop cultivation and fertilizer management on soil aggregates stability and fertility in the Loess Plateau, northern China. Journal of Soil Science and Plant Nutrition, 22(2): 1446-1457.
|
|
|
| [26] |
Kok J F, Parteli E J R, Michaels T I, et al. 2013. The physics of wind-blown sand and dust. Reports on Progress in Physics, 75(10): 106901, doi: 10.1088/0034-4885/75/10/106901.
|
|
|
| [27] |
Li G L, Pang X M. 2010. Effect of land-use conversion on C and N distribution in aggregate fractions of soils in the southern Loess Plateau, China. Land Use Policy, 27(3): 706-712.
|
|
|
| [28] |
Li G R, Yu C Y, Shen P F, et al. 2024. Crop diversification promotes soil aggregation and carbon accumulation in global agroecosystems: A meta-analysis. Journal of Environmental Management, 350: 119661, doi: 10.1016/j.jenvman.2023.119661.
|
|
|
| [29] |
Li T T, Zhang Y L, Bei S K, et al. 2020. Contrasting impacts of manure and inorganic fertilizer applications for nine years on soil organic carbon and its labile fractions in bulk soil and soil aggregates. CATENA, 194: 104739, doi: 10.1016/j.catena.2020.104739.
|
|
|
| [30] |
Lugato E, Simonetti G, Morari F, et al. 2010. Distribution of organic and humic carbon in wet-sieved aggregates of different soils under long-term fertilization experiment. Geoderma, 157(3-4): 80-85.
|
|
|
| [31] |
Lützow M V, Kögel-Knabner I, Ekschmitt K, et al. 2006. Stabilization of organic matter in temperate soils: Mechanisms and their relevance under different soil conditions: A review. European Journal of Soil Science, 57(4): 426-445.
|
|
|
| [32] |
Mayer L M. 1994. Surface area control of organic carbon accumulation in continental shelf sediments. Geochimica et Cosmochimica Acta, 58(4): 1271-1284.
|
|
|
| [33] |
McCarty G W, Lyssenko N N, Starr J L. 1998. Short-term changes in soil carbon and nitrogen pools during tillage management transition. Soil Science Society of America Journal, 62(6): 1564-1571.
|
|
|
| [34] |
Mrabet R, Saber N, El-Brahli A, et al. 2001. Total, particulate organic matter and structural stability of a Calcixeroll soil under different wheat rotations and tillage systems in a semiarid area of Morocco. Soil and Tillage Research, 57(4): 225-235.
|
|
|
| [35] |
Nie X D, Li Z W, Huang J Q, et al. 2018. Thermal stability of organic carbon in soil aggregates as affected by soil erosion and deposition. Soil and Tillage Reserch, 175: 82-90.
|
|
|
| [36] |
Okolo C C, Gebresamuel G, Zenebe A, et al. 2020. Accumulation of organic carbon in various soil aggregate sizes under different land use systems in a semi-arid environment. Agriculture, Ecosystems & Environment, 297: 106924, doi: 10.1016/j.agee.2020.106924.
|
|
|
| [37] |
Peng J, Xiao L, Xu Z Y, et al. 2024. Effects of different land use change on soil aggregate and aggregate associated organic carbon: A meta-analysis. Polish Journal of Environmental Studies, 33(5): 5263-5274.
|
|
|
| [38] |
Qiu L P, Wei X R, Zhang X C, et al. 2012. Soil organic carbon losses due to land use change in a semiarid grassland. Plant and Soil, 355(1-2): 299-309.
|
|
|
| [39] |
Qiu L P, Wei X R, Gao J L, et al. 2015. Dynamics of soil aggregate-associated organic carbon along an afforestation chronosequence. Plant and Soil, 391: 237-251.
|
|
|
| [40] |
Ramaswamy V, Gaye B, Shirodkar P V, et al. 2008. Distribution and sources of organic carbon, nitrogen and their isotopic signatures in sediments from the Ayeyarwady (Irrawaddy) continental shelf, northern Andaman Sea. Marine Chemistry, 111(3-4): 137-150.
|
|
|
| [41] |
Reeves S H, Somasundaram J, Wang W J, et al. 2019. Effect of soil aggregate size and long-term contrasting tillage, stubble and nitrogen management regimes on CO2 fluxes from a Vertisol. Geoderma, 337: 1086-1096.
doi: 10.1016/j.geoderma.2018.11.022
|
|
|
| [42] |
Schimel D S. 1986. Carbon and nitrogen turnover in adjacent grassland and cropland ecosystems. Biogeochemistry, 2(4): 345-357.
|
|
|
| [43] |
Schmidt E S, Villamil M B, Arniotti N M. 2018. Soil quality under conservation practices on farm operations of the southern semiarid pampas region of Argentina. Soil and Tillage Research, 176: 85-94.
|
|
|
| [44] |
Shao Y. 2008. Physics and Modelling of Wind Erosion. Dordrecht: Springer.
|
|
|
| [45] |
Shrestha B M, Singh B R, Sitaula B K, et al. 2007. Soil aggregate- and particle-associated organic carbon under different land uses in Nepal. Soil Science Society of America Journal, 71(4): 1194-1203.
|
|
|
| [46] |
Six J, Elliott E T, Paustian K. 2000a. Soil macroaggregate turnover and microaggregate formation: A mechanism for C sequestration under no-tillage agriculture. Soil Biology and Biochemistry, 32(14): 2099-2103.
|
|
|
| [47] |
Six J, Paustian K, Elliott E T, et al. 2000b. Soil structure and organic matter distribution of aggregate-size classes and aggregate-associated carbon. Soil Science Society of America Journal, 64(2): 681-689.
|
|
|
| [48] |
Six J, Conant R T, Paul E A, et al. 2002. Stabilization mechanisms of soil organic matter: Implications for C-saturation of soils. Plant and Soil, 241(2): 155-176.
|
|
|
| [49] |
Sokol N W, Bradford M A. 2019. Microbial formation of stable soil carbon is more efficient from belowground than aboveground input. Nature Geoscience, 12(1): 46-53.
doi: 10.1038/s41561-018-0258-6
|
|
|
| [50] |
Su Y G, Huang G, Lin S N, et al. 2023. Patterns of organic carbon and nitrogen stocks in soil particle-size fractions along an aridity gradient in northern China's deserts. CATENA, 221: 106785, doi: 10.1016/j.catena.2022.106785.
|
|
|
| [51] |
Tatarko J. 2001. Soil aggregation and wind erosion: Processes and measurements. Annals of Arid Zone, 40(3): 251-264.
|
|
|
| [52] |
Tisdall J M, Oades J. 1982. Organic matter and water-stable aggregates in soils. Journal of Soil Science, 33(2): 141-163.
|
|
|
| [53] |
Tosunoglu F, Kisi O. 2017. Trend analysis of maximum hydrologic drought variables using Mann-Kendall and Sen's innovative trend method. River Research and Applications, 33(4): 597-610.
|
|
|
| [54] |
Udom B E, Ogunwole J O. 2015. Soil organic carbon, nitrogen, and phosphorus distribution in stable aggregates of an Ultisol under contrasting land use and management history. Journal of Plant Nutrition and Soil Science, 178(3): 460-467.
|
|
|
| [55] |
Unger P W. 1997. Aggregate and organic carbon concentration interrelationships of a Torrertic Paleustoll. Soil and Tillage Research, 42(1): 95-113.
|
|
|
| [56] |
Wang R D, Guo Z L, Chang C P, et al. 2015. Quantitative estimation of farmland soil loss by wind-erosion using improved particle-size distribution comparison method (IPSDC). Aeolian Research, 19: 163-170.
|
|
|
| [57] |
Webb N P, Chappell A, Strong C L, et al. 2012. The significance of carbon-enriched dust for global carbon accounting. Global Change Biology, 18(11): 3275-3278.
|
|
|
| [58] |
Wu X T, Wang S Y, Cheng H, et al. 2024. Variation of soil organic matter with particle size in the wind erosion region of northern China. CATENA, 241: 108025, doi: 10.1016/j.catena.2024.108025.
|
|
|
| [59] |
Xiao L M, Zhang W, Hu P L, et al. 2021. The formation of large macroaggregates induces soil organic carbon sequestration in short-term cropland restoration in a typical Karst area. Science of the Total Environment, 801: 149588, doi: 10.1016/j.scitotenv.2021.149588.
|
|
|
| [60] |
Yamashita T, Flessa H, John B, et al. 2006. Organic matter in density fractions of water-stable aggregates in silty soils: Effect of land use. Soil Biology and Biochemistry, 38(11): 3222-3234.
|
|
|
| [61] |
Yang X, Shao M A, Li T C, et al. 2022. Soil macroaggregates determine soil organic carbon in the natural grasslands of the Loess Plateau. CATENA, 218: 106533, doi: 10.1016/j.catena.2022.106533.
|
|
|
| [62] |
Zhang F J, Xue B, Yao S C, et al. 2018. Organic carbon burial from multi-core records in Hulun Lake, the largest lake in northern China. Quaternary International, 475: 80-90.
|
|
|
| [63] |
Zhang Z C, Bird A, Zhang C X, et al. 2022. Not all gravel deserts in northern China are sources of regionally deposited dust. Atmospheric Environment, 273: 118984, doi: 10.1016/j.atmosenv.2022.118984.
|
|
|
| [64] |
Zinn Y L, Lal R, Resck D V S. 2005. Texture and organic carbon relations described by a profile pedotransfer function for Brazilian Cerrado soils. Geoderma, 127(1-2): 168-173.
|
|
|
| [65] |
Zobeck T M. 1991. Soil properties affecting wind erosion. Journal of Soil and Water Conservation, 46(2): 112-118.
|
|
|
| [66] |
Zobeck T M, Sterk G, Funk R, et al. 2003. Measurement and data analysis methods for field-scale wind erosion studies and model validation. Earth Surface Processes and Landforms, 28(11): 1163-1188.
|
|
|
| [67] |
Zou X Y, Zhang C L, Cheng H, et al. 2015. Cogitation on developing a dynamic model of soil wind erosion. Science China Earth Sciences, 58(3): 462-473.
|
|
|
|
Viewed |
|
|
|
Full text
|
|
|
|
|
Abstract
|
|
|
|
|
Cited |
|
|
|
|
| |
Shared |
|
|
|
|
| |
Discussed |
|
|
|
|