| Research article |
|


|
|
|
| Gross nitrogen transformations and N2O emission sources in sandy loam and silt loam soils |
LANG Man1,2, LI Ping1,2,*( ), WEI Wei1,2 ), WEI Wei1,2 |
1Jiangsu Key Laboratory of Agricultural Meteorology, Nanjing University of Information Science & Technology, Nanjing 210044, China
2Department of Agricultural Resources and Environment, Nanjing University of Information Science & Technology, Nanjing 210044, China |
|
|
|
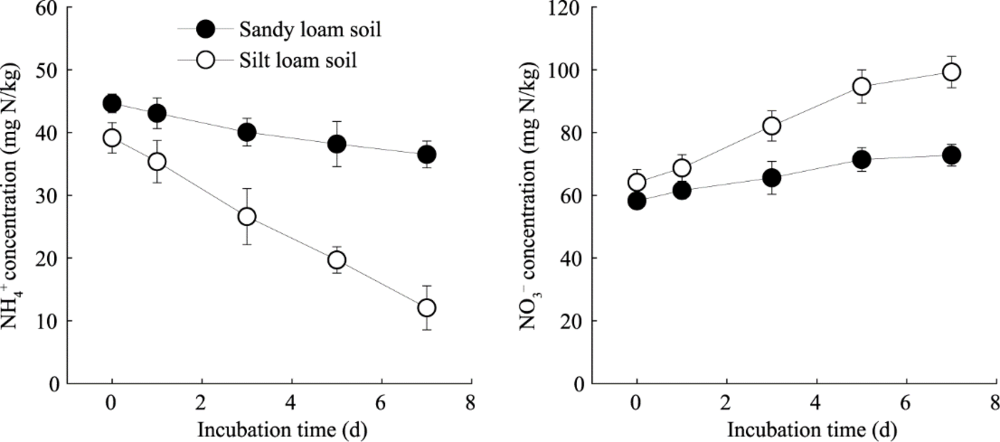
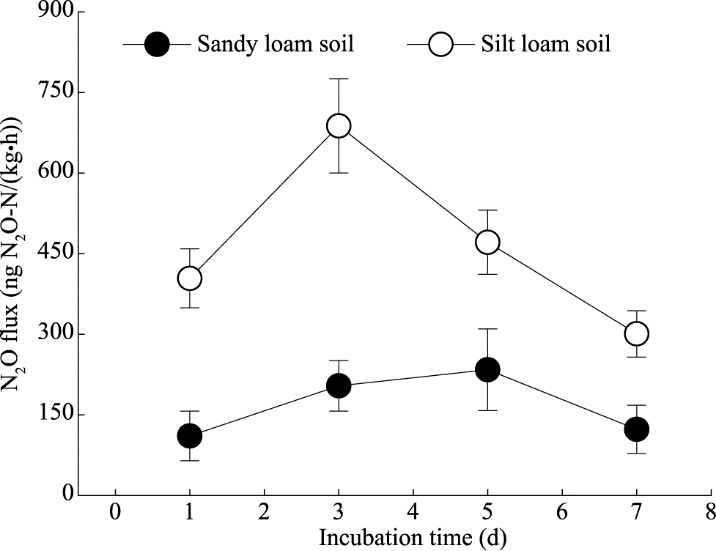
Abstract The soil type is a key factor influencing N (nitrogen) cycling in soil; however, gross N transformations and N2O emission sources are still poorly understood. In this study, a laboratory 15N tracing experiment was carried out at 60% WHC (water holding capacity) and 25oC to evaluate the gross N transformation rates and N2O emission pathways in sandy loam and silt loam soils in a semi-arid region of Heilongjiang Province, China. The results showed that the gross rates of N mineralization, immobilization, and nitrification were 3.60, 1.90, and 5.63 mg N/(kg·d) in silt loam soil, respectively, which were 3.62, 4.26, and 3.13 times those in sandy loam soil, respectively. The ratios of the gross nitrification rate to the ammonium immobilization rate (n/ia) in sandy loam soil and silt loam soil were all higher than 1.00, whereas the n/ia in sandy loam soil (4.36) was significantly higher than that in silt loam soil (3.08). This result indicated that the ability of sandy loam soil to release and conserve the available N was relatively poor in comparison with silt loam soil, and the relatively strong nitrification rate compared to the immobilization rate may lead to N loss through NO3- leaching. Under aerobic conditions, both nitrification and denitrification made contributions to N2O emissions. Nitrification was the dominant pathway leading to N2O production in soils and was responsible for 82.0% of the total emitted N2O in sandy loam soil, which was significantly higher than that in silt loam soil (71.7%). However, the average contribution of denitrification to total N2O production in sandy loam soil was 17.9%, which was significantly lower than that in silt loam soil (28.3%). These results are valuable for developing reasonable fertilization management and proposing effective greenhouse gas mitigation strategies in different soil types in semiarid regions.
|
|
Received: 28 December 2020
Published: 10 May 2021
|
|
Corresponding Authors:
|
About author: *LI Ping (E-mail: pli@nuist.edu.cn)
|
|
|
| [1] |
Aulakh M S, Kuldip S, Bijay S. 1996. Kinetics of nitrification under upland and flooded soils of varying texture. Communications in Soil Science and Plant Analysis, 27(9-10):2079-2089.
doi: 10.1080/00103629609369689
|
|
|
| [2] |
Bateman E J, Baggs E M. 2005. Contributions of nitrification and denitrification to N2O emissions from soils at different water-filled pore space. Biology and Fertility of Soils, 41(6):379-388.
doi: 10.1007/s00374-005-0858-3
|
|
|
| [3] |
Burford J R, Bremner J M. 1975. Relationships between the denitrification capacities of soils and total water soluble and readily decomposable soil organic matter. Soil Biology and Biochemistry, 7(6):389-394.
doi: 10.1016/0038-0717(75)90055-3
|
|
|
| [4] |
Byrnes B H. 1990. Environmental effects of N fertilizer use-an overview. Fertilizer Research, 26:209-215.
doi: 10.1007/BF01048758
|
|
|
| [5] |
Castellano-Hinojosa A, Charteris A F, Müller C, et al. 2020. Occurrence and 15N-quantification of simultaneous nitrification and denitrification in N-fertilized soils incubated under oxygen-limiting conditions. Soil Biology and Biochemistry, 143:107757, doi: 10.1016/j.soilbio.2020.107757.
doi: 10.1016/j.soilbio.2020.107757
|
|
|
| [6] |
Cookson W R, Osman M, Marschner P, et al. 2007. Controls on soil nitrogen cycling and microbial community composition across land use and incubation temperature. Soil Biology and Biochemistry, 39(3):744-756.
doi: 10.1016/j.soilbio.2006.09.022
|
|
|
| [7] |
Dobbie K E, Smith K A. 2001. The effects of temperature, water-filled pore space and land use on N2O emissions from an imperfectly drained gleysol. European Journal of Soil Science, 52(4):667-673.
doi: 10.1046/j.1365-2389.2001.00395.x
|
|
|
| [8] |
Du M G, Li Y F, Qiu Z Y, et al. 1994. The improvement approaches and utilization of sand-drift soil in semiarid area in the west part of Heilongjiang Province. Agricultural Research in the Arid Areas, 12(1):68-73. (in Chinese)
|
|
|
| [9] |
Elrys A S, Raza S, Elnahal A S M, et al. 2020. Do soil property variations affect dicyandiamide efficiency in inhibiting nitrification and minimizing carbon dioxide emissions? Ecotoxicology and Environmental Safety, 202:110875, doi: 10.1016/j.ecoenv.2020.110875.
doi: 10.1016/j.ecoenv.2020.110875
|
|
|
| [10] |
Fierer N, Schimel J P. 2002. Effects of drying-rewetting frequency on soil carbon and nitrogen transformations. Soil Biology and Biochemistry, 34(6):777-787.
doi: 10.1016/S0038-0717(02)00007-X
|
|
|
| [11] |
Garrido F, Hénault C, Gaillard H, et al. 2002. N2O and NO emissions by agricultural soils with low hydraulic potentials. Soil Biology and Biochemistry, 34(5):559-575.
doi: 10.1016/S0038-0717(01)00172-9
|
|
|
| [12] |
Gibbs P, Barraclough D. 1998. Gross mineralisation of nitrogen during the decomposition of leaf protein I (ribulose 1, 5-diphosphate carboxylase) in the presence or absence of sucrose. Soil Biology and Biochemistry, 30(13):1821-1827.
doi: 10.1016/S0038-0717(98)00056-X
|
|
|
| [13] |
Grünzweig J M, Sparrow S D, Chapin F S. 2003. Impact of forest conversion to agriculture on carbon and nitrogen mineralization in subarctic Alaska. Biogeochemistry, 64:271-296.
doi: 10.1023/A:1024976713243
|
|
|
| [14] |
Hart S C, Nason G E, Myrold D D, et al. 1994. Dynamics of gross nitrogen transformations in an old-growth forest: the carbon connection. Ecology, 75(4):880-891.
doi: 10.2307/1939413
|
|
|
| [15] |
Hosny L. 1979. Biological oxidation of ammoniacal fertilizers as affected by the physical properties of soil. Zentralbl Bakteriol Naturwiss, 134(6):513-527.
|
|
|
| [16] |
Hoyle F C, Murphy D V, Fillery I R P. 2006. Temperature and stubble management influence microbial CO2-C evolution and gross N transformation rates. Soil Biology and Biochemistry, 38(1):71-80.
doi: 10.1016/j.soilbio.2005.04.020
|
|
|
| [17] |
Jiang H T, Liu W H, Fang Y F, et al. 2014. Study on soil types and utilization in Qiqihar City. Protection Forest Science and Technology, 5:95-96. (in Chinese)
|
|
|
| [18] |
Khalil K, Mary B, Renault P. 2004. Nitrous oxide production by nitrification and denitrification in soil aggregates as affected by O2 concentration. Soil Biology and Biochemistry, 36(4):687-699.
doi: 10.1016/j.soilbio.2004.01.004
|
|
|
| [19] |
Kroeze C, Mosier A, Bouwman L. 1999. Closing the global N2O budget: A retrospective analysis 1500-1994. Global Biogeochemical Cycles, 13(1):1-8.
doi: 10.1029/1998GB900020
|
|
|
| [20] |
Kuroiwa M, Koba K, Isobe K, et al. 2011. Gross nitrification rates in four Japanese forest soils: heterotrophic versus autotrophic and the regulation factors for the nitrification. Journal of Forest Research, 16(5):363-373.
doi: 10.1007/s10310-011-0287-0
|
|
|
| [21] |
Lam S K, Sutera H, Daviesb R, et al. 2018. Direct and indirect greenhouse gas emissions from two intensive vegetable farms applied with a nitrification inhibitor. Soil Biology and Biochemistry, 116:48-51.
doi: 10.1016/j.soilbio.2017.10.008
|
|
|
| [22] |
Lan T, Han Y, Roelcke M, et al. 2013. Processes leading to N2O and NO emissions from two different Chinese soils under different soil moisture contents. Plant and Soil, 371(1-2):611-627.
doi: 10.1007/s11104-013-1721-1
|
|
|
| [23] |
Lan T, Han Y, Roelcke M, et al. 2014. Sources of nitrous and nitric oxides in paddy soils: Nitrification and denitrification. Journal of Environmental Sciences, 26(3):581-592.
doi: 10.1016/S1001-0742(13)60453-2
|
|
|
| [24] |
Lang M, Cai Z C, Mary B, et al. 2010. Land-use type and temperature affect gross nitrogen transformation rates in Chinese and Canadian soils. Plant and Soil, 334:377-389.
doi: 10.1007/s11104-010-0389-z
|
|
|
| [25] |
Lang M, Cai Z C, Chang S X. 2011. Effects of land use type and incubation temperature on greenhouse gas emissions from Chinese and Canadian soils. Journal of Soils and Sediments, 11(1):15-24.
doi: 10.1007/s11368-010-0260-0
|
|
|
| [26] |
Laughlin R J, Stevens R J. 2002. Evidence for fungal dominance of denitrification and code nitrification in grassland soil. Soil Science Society of America Journal, 66(5):1540-1548.
doi: 10.2136/sssaj2002.1540
|
|
|
| [27] |
Li P, Lang M. 2014. Gross nitrogen transformations and related N2O emissions in uncultivated and cultivated black soil. Biology and Fertility of Soils, 50(2):197-206.
doi: 10.1007/s00374-013-0848-9
|
|
|
| [28] |
Li X X, Sørensen P, Olesen J E, et al. 2016. Evidence for denitrification as main source of N2O emission from residue-amended soil. Soil Biology and Biochemistry, 92:153-160.
doi: 10.1016/j.soilbio.2015.10.008
|
|
|
| [29] |
Li Z G, Xia S J, Zhang R H, et al. 2020. N2O emissions and product ratios of nitrification and denitrification are altered by K fertilizer in acidic agricultural soils. Environmental Pollution, 265:115065, doi: 10.1016/j.envpol.2020.115065.
doi: 10.1016/j.envpol.2020.115065
|
|
|
| [30] |
Mary B, Recous S, Robin D. 1998. A model for calculating nitrogen fluxes in soil using 15N tracing. Soil Biology and Biochemistry, 30(14):1963-1979.
doi: 10.1016/S0038-0717(98)00068-6
|
|
|
| [31] |
Müller C, Rütting T, Kattge J, et al. 2007. Estimation of parameters in complex 15N tracing models by Monte Carlo sampling. Soil Biology and Biochemistry, 39(3):715-726.
doi: 10.1016/j.soilbio.2006.09.021
|
|
|
| [32] |
Murphy D V, Recous S, Stockdale E A, et al. 2003. Gross nitrogen fluxes in soil: theory, measurement and application of 15N pool dilution techniques. Advances in Agronomy, 79:69-118.
|
|
|
| [33] |
Pereira e Silva M C, Poly F, Guillaumaud N, et al. 2012. Fluctuations in ammonia oxidizing communities across agricultural soils are driven by soil structure and pH. Frontiers in Microbiology, 3:1-22.
|
|
|
| [34] |
Pihlatie M, Syväsalo E, Simojoki A, et al. 2004. Contribution of nitrification and denitrification to N2O production in peat, clay and loamy sand soils under different soil moisture conditions. Nutrient Cycling in Agroecosystems, 70:135-141.
doi: 10.1023/B:FRES.0000048475.81211.3c
|
|
|
| [35] |
Renault P, Stengel P. 1994. Modeling oxygen diffusion in aggregated soils: I. Anaerobiosis inside the aggregates. Soil Science Society of America Journal, 58(4):1017-1023.
doi: 10.2136/sssaj1994.03615995005800040004x
|
|
|
| [36] |
Simojoki A, Jaakkola A. 2000. Effect of nitrogen fertilization, cropping and irrigation on soil air composition and nitrous oxide emission in a loamy clay. European Journal of Soil Science, 51(3):413-424.
doi: 10.1046/j.1365-2389.2000.00308.x
|
|
|
| [37] |
Smith K A. 1980. A model of the extent of anaerobic zones in aggregated soils, and its potential application to estimates of denitrification. Journal of Soil Science, 31(2):263-277.
doi: 10.1111/j.1365-2389.1980.tb02080.x
|
|
|
| [38] |
Stevens R J, Laughlin R J, Burns L C, et al. 1997. Measuring the contributions of nitrification and denitrification to the flux of nitrous oxide from soil. Soil Biology and Biochemistry, 29(2):139-151.
doi: 10.1016/S0038-0717(96)00303-3
|
|
|
| [39] |
Stockdale E A, Hatch D J, Murphy D V, et al. 2002. Verifying the nitrification to immobilisation ratio (N/I) as a key determinant of potential nitrate loss in grassland and arable soils. Agronomie, 22:831-838.
doi: 10.1051/agro:2002060
|
|
|
| [40] |
Syväsalo E, Regina K, Pihlatie M, et al. 2004. Emissions of nitrous oxide from boreal agricultural clay and sandy loam soils. Nutrient Cycling in Agroecosystems, 69:155-165.
doi: 10.1023/B:FRES.0000029675.24465.fc
|
|
|
| [41] |
Tripathi N, Singh R S. 2009. Influence of different land uses on soil nitrogen transformations after conversion from an Indian dry tropical forest. Catena, 77(3):216-223.
doi: 10.1016/j.catena.2009.01.002
|
|
|
| [42] |
Wang M X, Zhang Y X. 2013. Effects of different tillage measures on maize growth and yield in aeolian sandy soil area in Heilongjiang province. Bulletin of Soil and Water Conservation, 33:59-63. (in Chinese)
|
|
|
| [43] |
Well R, Flessa H, Lu X, et al. 2008. Isotopologue ratios of N2O emitted from microcosms with NH4+ fertilized arable soils under conditions favoring nitrification. Soil Biology and Biochemistry, 40(9):2416-2426.
doi: 10.1016/j.soilbio.2008.06.003
|
|
|
| [44] |
Wolf I, Russow R. 2000. Different pathways of formation of N2O, N2 and NO in black earth soil. Soil Biology and Biochemistry, 32(2):229-239.
doi: 10.1016/S0038-0717(99)00151-0
|
|
|
| [45] |
Yang L L, Zhang F S, Gao Q, et al. 2010. Impact of land-use types on soil nitrogen net mineralization in the sandstorm and water source area of Beijing, China. CATENA, 82(1):15-22.
doi: 10.1016/j.catena.2010.04.004
|
|
|
| [46] |
Zhang J B, Cai Z C, Zhu T B. 2011. N2O production pathways in the subtropical acid forest soils in China. Environmental Research, 111(5):643-649.
doi: 10.1016/j.envres.2011.04.005
|
|
|
| [47] |
Zhang J B, Zhu T B, Meng T Z, et al. 2013. Agricultural land use affects nitrate production and conservation in humid subtropical soils in China. Soil Biology and Biochemistry, 62:107-114.
doi: 10.1016/j.soilbio.2013.03.006
|
|
|
| [48] |
Zhang Y, Wang J, Dai S Y, et al. 2019. Temperature effects on N2O production pathways in temperate forest soils. Science of the Total Environment, 691:1127-1136.
doi: 10.1016/j.scitotenv.2019.07.208
|
|
|
| [49] |
Zhu G D, Song X T, Ju X T, et al. 2019. Gross N transformation rates and related N2O emissions in Chinese and UK agricultural soils. Science of the Total Environment, 666:176-186.
doi: 10.1016/j.scitotenv.2019.02.241
|
|
|
| [50] |
Zhu T B, Zhang J B, Cai Z C. 2011. The contribution of nitrogen transformation processes to total N2O emissions from soils used for intensive vegetable cultivation. Plant and Soil, 343:313-327.
doi: 10.1007/s11104-011-0720-3
|
|
|
|
Viewed |
|
|
|
Full text
|
|
|
|
|
Abstract
|
|
|
|
|
Cited |
|
|
|
|
| |
Shared |
|
|
|
|
| |
Discussed |
|
|
|
|