| Research article |
|


|
|
|
| Influence of non-stationarity and auto-correlation of climatic records on spatio-temporal trend and seasonality analysis in a region with prevailing arid and semi-arid climate, Iran |
Mahsa MIRDASHTVAN*( ), Mohsen MOHSENI SARAVI ), Mohsen MOHSENI SARAVI |
| Department of Range and Watershed Management, Faculty of Natural Resources, College of Agriculture and Natural Resources, University of Tehran, Karaj 3158777871, Iran |
|
|
|
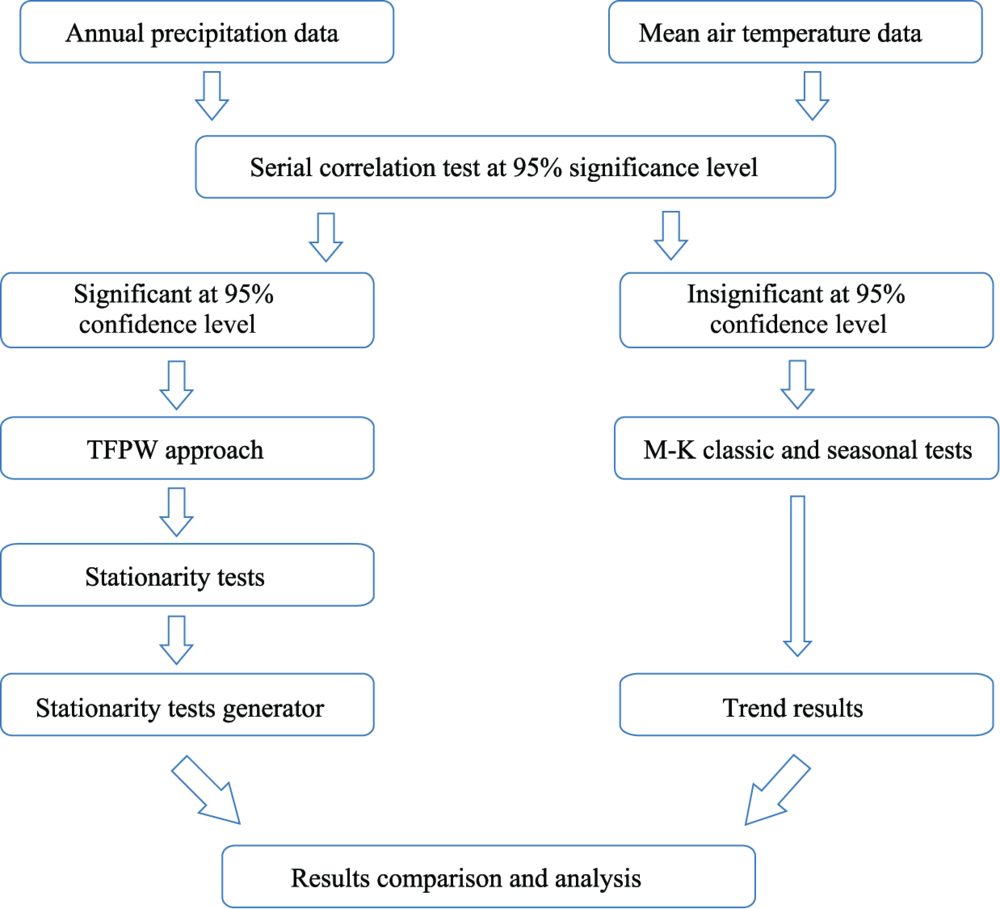
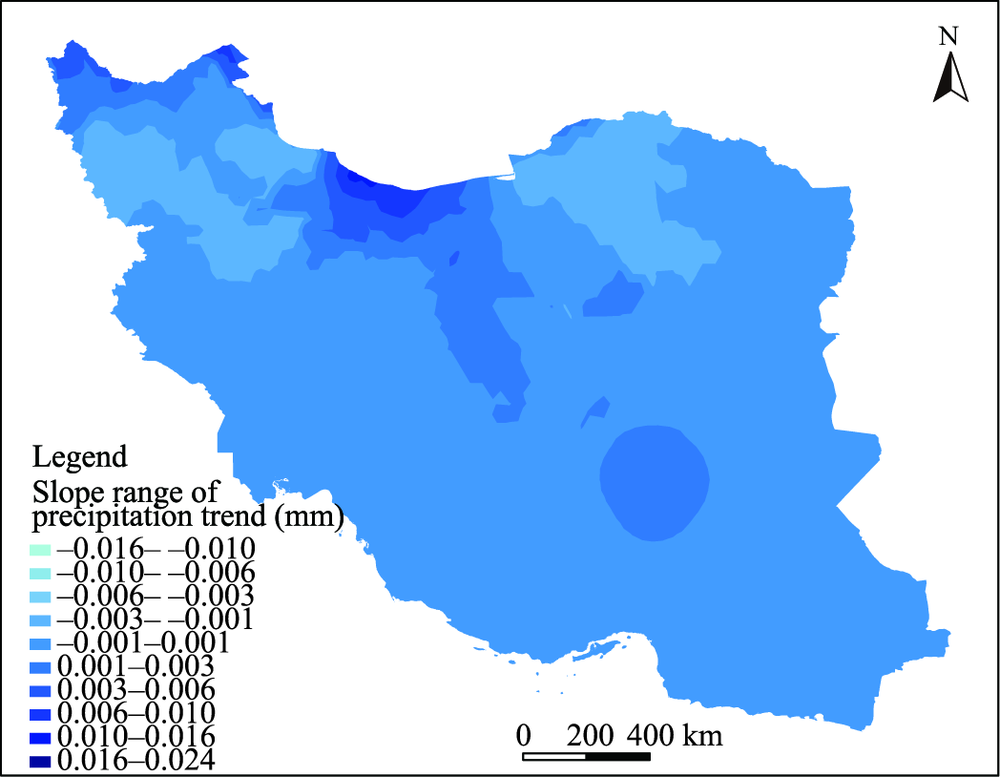
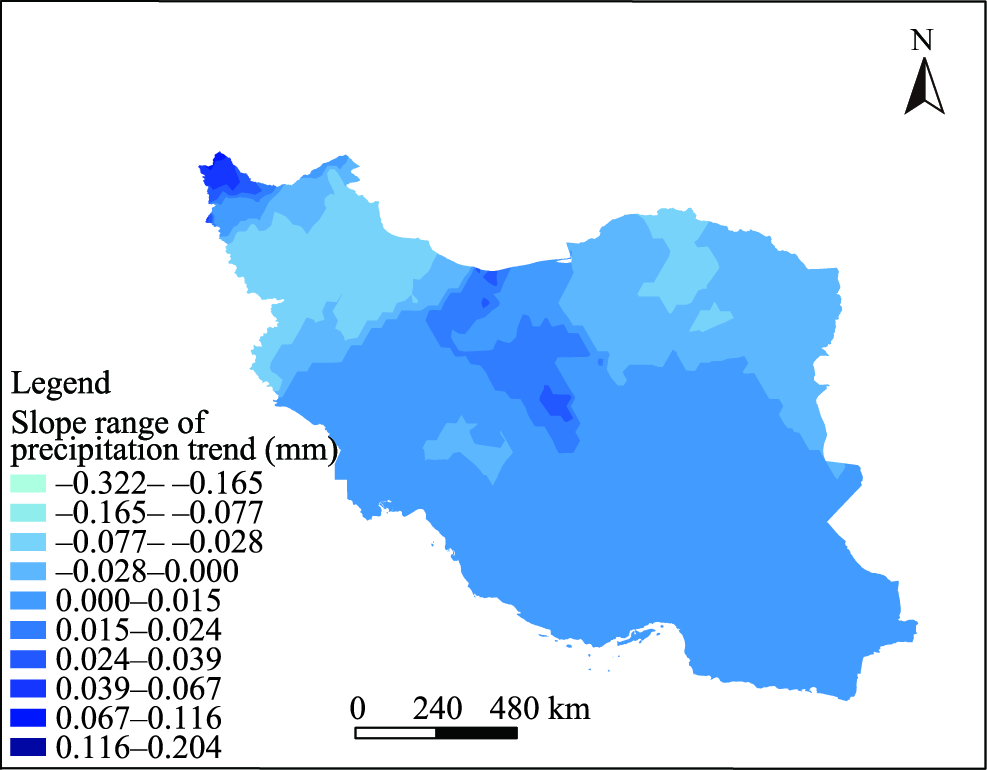
Abstract Trend and stationarity analysis of climatic variables are essential for understanding climate variability and provide useful information about the vulnerability and future changes, especially in arid and semi-arid regions. In this study, various climatic zones of Iran were investigated to assess the relationship between the trend and the stationarity of the climatic variables. The Mann-Kendall test was considered to identify the trend, while the trend free pre-whitening approach was applied for eliminating serial correlation from the time-series. Meanwhile, time series stationarity was tested by Dickey-Fuller and Kwiatkowski-Phillips-Schmidt-Shin tests. The results indicated an increasing trend for mean air temperature series at most of the stations over various climatic zones, however, after eliminating the serial correlation factor, this increasing trend changes to an insignificant decreasing trend at a 95% confidence level. The seasonal mean air temperature trend suggested a significant increase in the majority of the stations. The mean air temperature increased more in northwest towards central parts of Iran that mostly located in arid and semi-arid climatic zones. Precipitation trend reveals an insignificant downward trend in most of the series over various climatic zones; furthermore, most of the stations follow a decreasing trend for seasonal precipitation. Furthermore, spatial patterns of trend and seasonality of precipitation and mean air temperature showed that the northwest parts of Iran and margin areas of the Caspian Sea are more vulnerable to the changing climate with respect to the precipitation shortfalls and warming. Stationarity analysis indicated that the stationarity of climatic series influences on their trend; so that, the series which have significant trends are not static. The findings of this investigation can help planners and policy-makers in various fields related to climatic issues, implementing better management and planning strategies to adapt to climate change and variability over Iran.
|
|
Received: 23 August 2019
Published: 10 November 2020
|
|
Corresponding Authors:
|
About author: *Mahsa MIRDASHTVAN (E-mail: mirdashtevan@ut.ac.ir)
|
|
|
| [1] |
Abbaspour M, Sabetraftar A . 2005. Review of cycles and indices of drought and their effect on water resources, ecological, biological, agricultural, social and economical issues in Iran. International Journal of Environmental Studies, 62(6):709-724.
|
|
|
| [2] |
Ahmad I, Tang D, Wang T, et al. 2015. Precipitation trends over time using Mann-Kendall and Spearman’s rho tests in Swat River Basin, Pakistan. Advances in Meteorology, 2015(2):1-15.
|
|
|
| [3] |
Alijani B. 1995. Climate of Iran. Tehran: Piame Noor University, 21-35.
|
|
|
| [4] |
Amiri M, Eslamian S. 2010. Investigation of climate change in Iran. Journal of Environmental Sciences and Technology, 3:208-216.
|
|
|
| [5] |
Aziz O I A, Burn D H. 2006. Trends and variability in the hydrological regime of the Mackenzie River Basin. Journal of Hydrology, 319(1-4):282-294.
|
|
|
| [6] |
Blain G C. 2015. The influence of nonlinear trends on the power of the trend-free pre-whitening approach. Acta Scientiarum Agronomy, 37(1):21-28.
|
|
|
| [7] |
Brockwell P J, Davis R A. 1991. Time Series: Theory and Methods. New York: Springer Science and Business Media.
|
|
|
| [8] |
Burn D H, Elnur M A H. 2002. Detection of hydrologic trends and variability. Journal of Hydrology, 255(1-4):107-122.
doi: 10.1016/S0022-1694(01)00514-5
|
|
|
| [9] |
Burn D H, Cunderlik J M, Pietroniro A. 2004. Hydrological trends and variability in the Liard River basin. Hydrological Sciences Journal, 49(1):53-67.
doi: 10.1623/hysj.49.1.53.53994
|
|
|
| [10] |
Delju A, Ceylan A, Piguet E, et al. 2013. Observed climate variability and change in Urmia Lake Basin, Iran. Theoretical and Applied Climatology, 111:285-296.
|
|
|
| [11] |
Duan W, He B, Sahu N, et al. 2017. Spatiotemporal variability of Hokkaido's seasonal precipitation in recent decades and connection to water vapour flux. International Journal of Climatology, 37(9):3660-3673.
|
|
|
| [12] |
Duan W, Hanasaki N, Shiogama H, et al. 2019. Evaluation and future projection of Chinese precipitation extremes using large ensemble high-resolution climate simulations. Journal of Climate, 32(8):2169-2183.
|
|
|
| [13] |
El-Nesr M N, Abu-Zreig M M, Alazba A A. 2010. Temperature trends and distribution in the Arabian Peninsula. American Journal of Environmental Sciences, 6(2):191-203.
doi: 10.3844/ajessp.2010.191.203
|
|
|
| [14] |
Fathian F, Morid S, Kahya E. 2015. Identification of trends in hydrological and climatic variables in Urmia Lake basin, Iran. Theoretical and Applied Climatology, 119:443-464.
doi: 10.1007/s00704-014-1120-4
|
|
|
| [15] |
Feizi V, Mollashahi M, Farajzadeh M, et al. 2014. Spatial and temporal trend analysis of temperature and precipitation in Iran. Ecopersia, 2:727-742.
|
|
|
| [16] |
Field C B, Barros V R. 2014. Climate Change 2014: Impacts, Adaptation, and Vulnerability. Part A: Global and Sectoral Aspects. Working Group II Contribution to the Fifth Assessment Report of the Intergovernmental Panel on Climate Change. Cambridge: Cambridge University Press.
|
|
|
| [17] |
Gocic M, Trajkovic S. 2013. Analysis of changes in meteorological variables using Mann-Kendall and Sen's slope estimator statistical tests in Serbia. Global and Planetary Change, 100:172-182.
doi: 10.1016/j.gloplacha.2012.10.014
|
|
|
| [18] |
Golian S, Mazdiyasni O, AghaKouchak A. 2015. Trends in meteorological and agricultural droughts in Iran. Theoretical and Applied Climatology, 119:679-688.
doi: 10.1007/s00704-014-1139-6
|
|
|
| [19] |
Hamed K. 2009. Enhancing the effectiveness of prewhitening in trend analysis of hydrologic data. Journal of Hydrology, 368(1-4):143-155.
doi: 10.1016/j.jhydrol.2009.01.040
|
|
|
| [20] |
Hirsch R M, Alexander R B, Smith R A. 1991. Selection of methods for the detection and estimation of trends in water quality. Water Resources Research, 27(5):803-813.
doi: 10.1029/91WR00259
|
|
|
| [21] |
Hirsch R M, Slack J R, Smith R A. 1982. Techniques of trend analysis for monthly water quality data. Water Resources Research, 18(1):107-121.
doi: 10.1029/WR018i001p00107
|
|
|
| [22] |
Hosseinzadeh T P. 2014. Iranian rainfall series analysis by means of nonparametric tests. Theoretical and applied climatology, 116:597-607.
doi: 10.1007/s00704-013-0981-2
|
|
|
| [23] |
Houghton J T, Albritton D L, Meira F, et al. 2001. Technical summary of working group 1. Cambridge: Cambridge University Press.
|
|
|
| [24] |
Kahya E, Kalaycı S. 2004. Trend analysis of streamflow in Turkey. Journal of Hydrology, 289(1-4):128-144.
doi: 10.1016/j.jhydrol.2003.11.006
|
|
|
| [25] |
Kendall M. 1975. Multivariate analysis. Charles Griffin.
|
|
|
| [26] |
Kumar S, Merwade V, Kam J, et al. 2009. Streamflow trends in Indiana: effects of long term persistence, precipitation and subsurface drains. Journal of Hydrology, 374(1-2):171-183.
doi: 10.1016/j.jhydrol.2009.06.012
|
|
|
| [27] |
Kwiatkowski D, Phillips P C, Schmidt P, et al. 1992. Testing the null hypothesis of stationarity against the alternative of a unit root: How sure are we that economic time series have a unit root? Journal of Econometrics, 54(1-3):159-178.
doi: 10.1016/0304-4076(92)90104-Y
|
|
|
| [28] |
Libanda B, Zheng M, Ngonga C. 2019. Spatial and temporal patterns of drought in Zambia. Journal of Arid Land, 11(2):180-191.
doi: 10.1007/s40333-019-0053-2
|
|
|
| [29] |
Mann H B. 1945. Nonparametric tests against trend. Econometrica: Journal of the Econometric Society, 13:245-259.
doi: 10.2307/1907187
|
|
|
| [30] |
Masih I, Uhlenbrook S, Maskey S, et al. 2011. Streamflow trends and climate linkages in the Zagros Mountains, Iran. Climatic Change, 104:317-338.
doi: 10.1007/s10584-009-9793-x
|
|
|
| [31] |
Modarres R, da Silva V. 2007. Rainfall trends in arid and semi-arid regions of Iran. Journal of Arid Environments, 70(2):344-355.
doi: 10.1016/j.jaridenv.2006.12.024
|
|
|
| [32] |
Parey S, Hoang T, Dacunha-Castelle D. 2019. Future high-temperature extremes and stationarity. Natural Hazards, 98:1115-1134.
|
|
|
| [33] |
Peel M C, Finlayson B L, McMahon T A. 2007. Updated world map of the Köppen-Geiger climate classification. Hydrology and Earth System Sciences Discussions, 4:439-473.
doi: 10.5194/hessd-4-439-2007
|
|
|
| [34] |
Raziei T, Arasteh P D, Saghafian B. 2005a. Annual rainfall trend in arid and semi-arid regions of central and eastern Iran. Water and Wastewater, 54:73-81.
|
|
|
| [35] |
Raziei T, Arasteh P D, Saghafian B. 2005b. Annual rainfall trend in arid and semi-arid regions of Iran. In: ICID 21st European regional conference, 15-19.
|
|
|
| [36] |
Sahoo D, Smith P. 2009. Hydroclimatic trend detection in a rapidly urbanizing semi-arid and coastal river basin. Journal of Hydrology, 367(3-4):217-227.
doi: 10.1016/j.jhydrol.2009.01.014
|
|
|
| [37] |
Samadi S, Carbone G J, Mahdavi M, et al. 2013. Statistical downscaling of river runoff in a semi-arid catchment. Water Resources Management, 27:117-136.
doi: 10.1007/s11269-012-0170-6
|
|
|
| [38] |
Shadmani M, Marofi S, Roknian M. 2012. Trend analysis in reference evapotranspiration using Mann-Kendall and Spearman's Rho tests in arid regions of Iran. Water Resources Management, 26:211-224.
doi: 10.1007/s11269-011-9913-z
|
|
|
| [39] |
Shao Q, Li M. 2011. A new trend analysis for seasonal time series with consideration of data dependence. Journal of Hydrology, 396(1-2):104-112.
doi: 10.1016/j.jhydrol.2010.10.040
|
|
|
| [40] |
Solomon S, Qing D, Manning M, et al. 2007. Climate change 2007: The Physical Science Basis. Working group I Contribution to the Fourth Assessment Report of the Intergovernmental Panel on Climate Change. Cambridge: Cambridge University Press.
|
|
|
| [41] |
Some'e B S, Ezani A, Tabari H. 2012. Spatiotemporal trends and change point of precipitation in Iran. Atmospheric Research, 113:1-12.
doi: 10.1016/j.atmosres.2012.04.016
|
|
|
| [42] |
Stocker T F, Qin D, Plattner G-K, et al. 2013. Climate Change 2013: The Physical Science Basis. Contribution of Working Group I to the Fifth Assessment Report of the Intergovernmental Panel on Climate Change. Cambridge: Cambridge University Press, 1535.
|
|
|
| [43] |
Sun F, Roderick M L, Farquhar G D. 2018. Rainfall statistics, stationarity, and climate change. Proceedings of the National Academy of Sciences, 115(10):2305-2310.
|
|
|
| [44] |
Tabari H, Marofi S. 2011. Changes of pan evaporation in the west of Iran. Water Resources Management, 25:97-111.
doi: 10.1007/s11269-010-9689-6
|
|
|
| [45] |
Tabari H, Marofi S, Aeini A, et al. 2011. Trend analysis of reference evapotranspiration in the western half of Iran. Agricultural and Forest Meteorology, 151(2):128-136.
doi: 10.1016/j.agrformet.2010.09.009
|
|
|
| [46] |
Toller M, Santos T, Kern R. 2019. SAZED: parameter-free domain-agnostic season length estimation in time series data. Data Mining and Knowledge Discovery, 33:1775-1798.
doi: 10.1007/s10618-019-00645-z
|
|
|
| [47] |
Um M-J, Heo J-H, Markus M, et al. 2018. Performance evaluation of four statistical tests for trend and non-stationarity and assessment of observed and projected annual maximum precipitation series in Major United States cities. Water Resources Management, 32:913-933.
doi: 10.1007/s11269-017-1846-8
|
|
|
| [48] |
Unal Y S, Deniz A, Toros H, et al. 2012. Temporal and spatial patterns of precipitation variability for annual, wet, and dry seasons in Turkey. International Journal of Climatology, 32(3):392-405.
doi: 10.1002/joc.2274
|
|
|
| [49] |
Wang W, van Gelder P, Vrijling J. 2005. Trend and stationarity analysis for streamflow processes of rivers in Western Europe in the 20th century. In: Proceedings: IWA International Conference on Water Economics, Statistics, and Finance Rethymno, Greece, 8-10.
|
|
|
| [50] |
Webb B W, Nobilis F. 2007. Long-term changes in river temperature and the influence of climatic and hydrological factors. Hydrological Sciences Journal, 52(1):74-85.
|
|
|
| [51] |
Wu Z, Huang N E, Long S R, et al. 2007. On the trend, detrending, and variability of nonlinear and nonstationary time series. Proceedings of the National Academy of Sciences, 104(38):14889-14894.
|
|
|
| [52] |
Xu Z, Takeuchi K, Ishidaira H. 2003. Monotonic trend and step changes in Japanese precipitation. Journal of Hydrology, 279(1-4):144-150.
doi: 10.1016/S0022-1694(03)00178-1
|
|
|
| [53] |
Yue S, Pilon P, Phinney B, et al. 2002. The influence of autocorrelation on the ability to detect trend in hydrological series. Hydrological Processes, 16(9):1807-1829.
|
|
|
| [54] |
Yue S, Wang C Y. 2002. Applicability of prewhitening to eliminate the influence of serial correlation on the Mann-Kendall test. Water Resources Research, 38(6): 4-1-4-7, doi: 10.1029/2001WR000861.
|
|
|
| [55] |
Zhang Q, Liu C, Xu C Y, et al. 2006. Observed trends of annual maximum water level and streamflow during past 130 years in the Yangtze River basin, China. Journal of Hydrology, 324(1-4):255-265.
|
|
|
| [56] |
Zhao J, Huang Q, Chang J, et al. 2015. Analysis of temporal and spatial trends of hydro-climatic variables in the Wei River Basin. Environmental Research, 139:55-64.
doi: 10.1016/j.envres.2014.12.028
pmid: 25619963
|
|
|
| [57] |
Zhou J, Liang Z, Liu Y, et al. 2015. Six-decade temporal change and seasonal decomposition of climate variables in Lake Dianchi watershed (China): stable trend or abrupt shift? Theoretical and Applied Climatology, 119:181-191.
|
|
|
| [58] |
Zohrabi N, Bavani A M, Goodarzi E, et al. 2014. Attribution of temperature and precipitation changes to greenhouse gases in northwest Iran. Quaternary International, 345:130-137.
doi: 10.1016/j.quaint.2014.01.026
|
|
|
|
Viewed |
|
|
|
Full text
|
|
|
|
|
Abstract
|
|
|
|
|
Cited |
|
|
|
|
| |
Shared |
|
|
|
|
| |
Discussed |
|
|
|
|