| Research article |
|


|
|
|
| Remote sensing monitoring of the recent rapid increase in cultivation activities and its effects on desertification in the Mu Us Desert, China |
ZHAO Hongyan1,2,3, YAN Changzhen1,3,*( ), LI Sen1,3, WANG Yahui1,2,3 ), LI Sen1,3, WANG Yahui1,2,3 |
1Key Laboratory of Desert and Desertification, Northwest Institute of Eco-Environment and Resources, Chinese Academy of Sciences, Lanzhou 730000, China
2University of Chinese Academy of Sciences, Beijing 100049, China
3National Earth System Science Data Center, Beijing 100020, China |
|
|
|
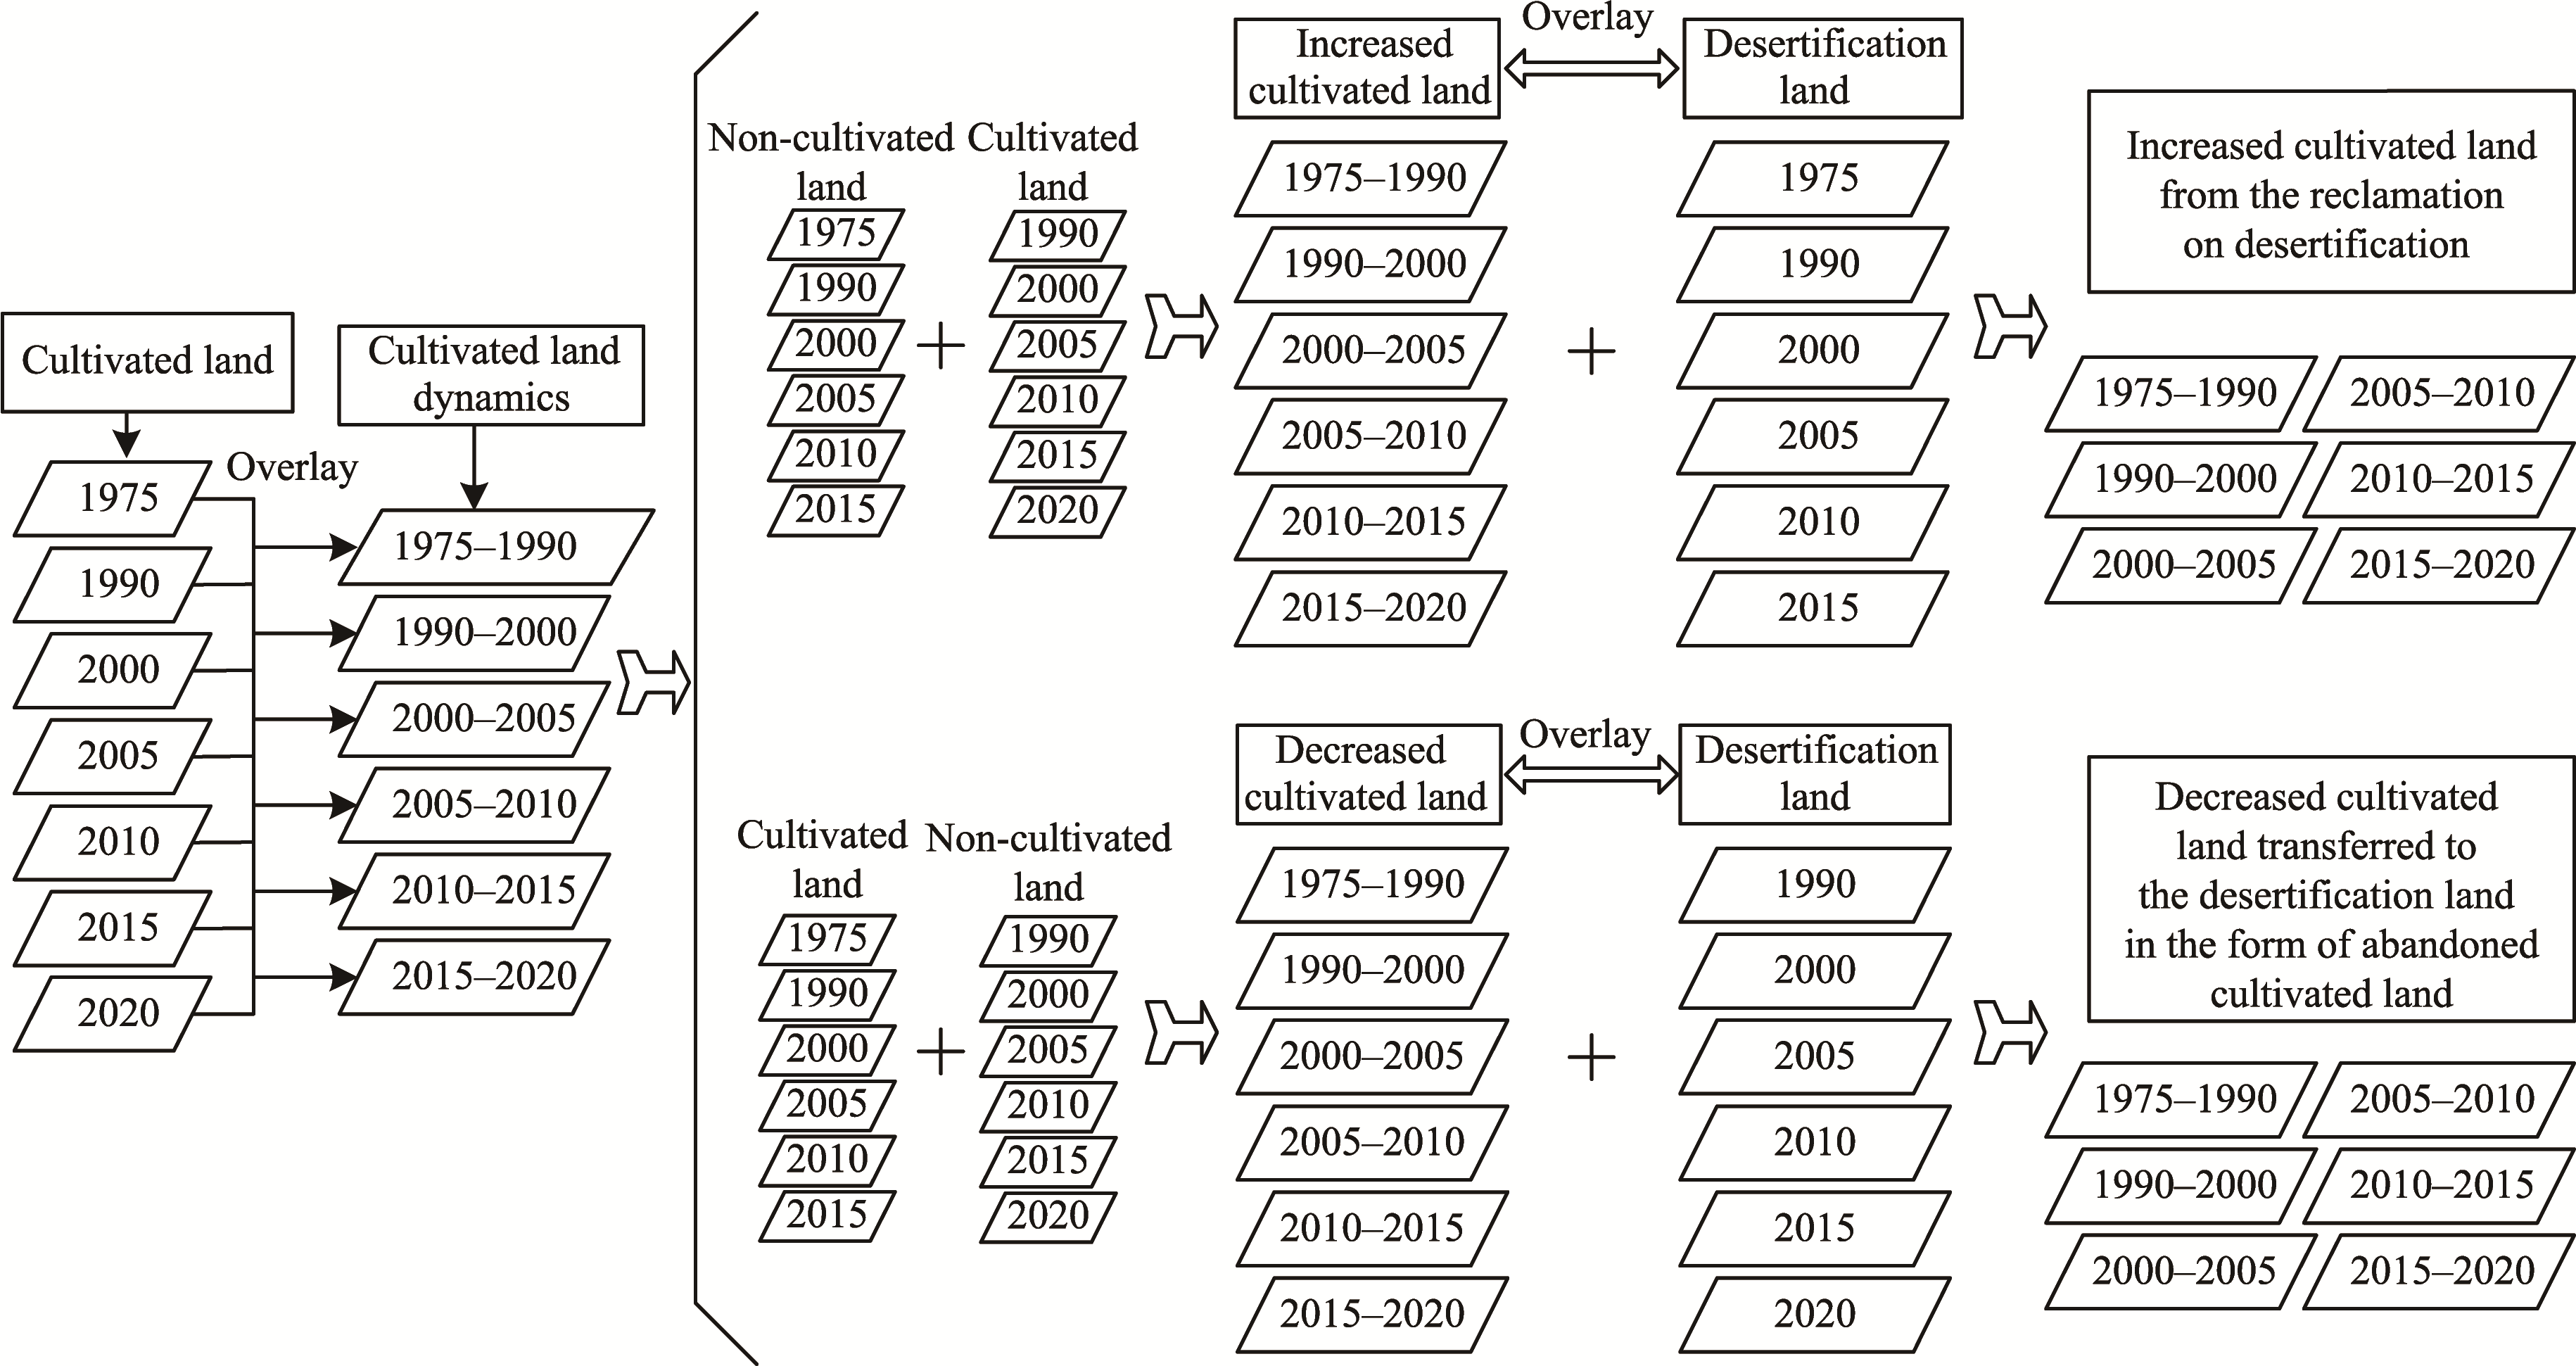
Abstract The recent ecological improvement in the Mu Us Desert of China, largely attributed to large-scale afforestation projects, has created new opportunities for cultivation activities. However, the subsequent rapid increase in reclamation on desertification land and its impact on desertification have raised concerns. In this study, we first extracted data on cultivated land and desertification land in 1975, 1990, 2000, 2005, 2010, 2015, and 2020 through the human-computer interaction visual interpretation method. By overlaying the cultivated land dynamics and desertification land, we subsequently explored the effect of cultivation activities on desertification in the Mu Us Desert during the six periods from 1975 to 2020 (1975-1990, 1990-2000, 2000-2005, 2005-2010, 2010-2015, and 2015-2020). The results showed that cultivated land in the Mu Us Desert showed a fluctuating and increasing trend from 3769.26 km2 in 1975 to 4865.73 km2 in 2020, with 2010 as the turning point for the recent rapid increase. The main contributors included the large and regular patches distributed in Yuyang District and Shenmu of Shaanxi Province, and relatively smaller patches concentrated in Inner Mongolia Autonomous Region. The increased cultivated land from the reclamation on desertification land was dominated by moderate and severe desertification lands, and the decreased cultivated land that was transferred into desertification land as abandoned cultivated land was dominated by slight and moderate desertification lands. The effect of cultivation activities on desertification reversal (average area proportion of 10.61% for reversed desertification land) was greater than that of the development of desertification (average area proportion of 5.82% for developed desertification land). Nevertheless, compared to reversed desertification land, both the significant increase of developed desertification land during the periods of 2000-2005 and 2005-2010 and the insignificant decrease during the periods of 2005-2010, 2010-2015, and 2015-2020 implied a potential remobilization risk. Therefore, this study provides a significant theoretical reference for the formulation of ecological restoration projects and regional macroeconomic development policies by considering the influence of cultivation activities, to ensure the overall environmental stability and sustainability in desertification land where reclamation and abandonment activities have taken place.
|
|
Received: 30 November 2022
Published: 31 July 2023
|
|
Corresponding Authors:
*YAN Changzhen (E-mail: yancz@lzb.ac.cn)
|
|
|
| [1] |
Abdulslam D, Abliz A, Zhou X D, et al. 2015. Study on the expansion of cultivated land and its human driving forces in typical arid area oasis: A case study of Charchan oasis in Xinjiang. Areal Research and Development, 34(2): 131-136, 176. (in Chinese)
|
|
|
| [2] |
Alexander S, Orr B J, Thust A, et al. 2018. Where do we stand on achieving land degradation neutrality? In: Nicklin S, Cornwell B, Trowbridge L. A Better World. Volume 4. Ceredigion: Gomer Press Ltd.,4-9.
|
|
|
| [3] |
Amin A, Nasim W, Mubeen M, et al. 2018. Regional climate assessment of precipitation and temperature in Southern Punjab (Pakistan) using SimCLIM climate model for different temporal scales. Theoretical and Applied Climatology, 131: 121-131.
doi: 10.1007/s00704-016-1960-1
|
|
|
| [4] |
Bakr N, Weindorf D C, Bahnassy M H, et al. 2012. Multi-temporal assessment of land sensitivity to desertification in a fragile agro-ecosystem: Environmental indicators. Ecological Indicators, 15: 271-280.
doi: 10.1016/j.ecolind.2011.09.034
|
|
|
| [5] |
Bao H, Zhang G B, Hou L Z, et al. 2018. Field water dynamics in Mu Us Sand Land with shallow groundwater table. Journal of Earth Environment, 9(4): 372-382. (in Chinese)
|
|
|
| [6] |
Bhattachan A, D'Odorico P, Baddock M C, et al. 2012. The Southern Kalahari: a potential new dust source in the Southern Hemisphere? Environmental Research Letters, 7(2): 024001, doi: 10.1088/1748-9326/7/2/024001.
doi: 10.1088/1748-9326/7/2/024001
|
|
|
| [7] |
Chen H, Marter-Kenyon J, López-Carr D, et al. 2015. Land cover and landscape changes in Shaanxi Province during China's Grain for Green Program (2000-2010). Environmental Monitoring and Assessment, 187: 644, doi: 10.1007/s10661-015-4881-z.
doi: 10.1007/s10661-015-4881-z
|
|
|
| [8] |
Ding Z K, Zhu M L, Wu Z Z, et al. 2018. Combining AHP-entropy approach with GIS for construction waste landfill selection-a case study of Shenzhen. International Journal of Environmental Research and Public Health, 15(10): 2254, doi: 10.3390/ijerph15102254.
doi: 10.3390/ijerph15102254
|
|
|
| [9] |
Du H Q, Wang T, Xue X, et al. 2018. Modelling of sand/dust emission in Northern China from 2001 to 2014. Geoderma, 330: 162-176.
doi: 10.1016/j.geoderma.2018.05.038
|
|
|
| [10] |
Fan J Q, Wang L, Qin J X, et al. 2020. Evaluating cultivated land stability during the growing season based on precipitation in the Horqin Sandy Land, China. Journal of Environmental Management, 276: 111269, doi: 10.1016/j.jenvman.2020.111269.
doi: 10.1016/j.jenvman.2020.111269
|
|
|
| [11] |
Fen K, Yan C Z, Xie J L, et al. 2018. Spatial-temporal evolution of aeolian desertification process in Ordos City during 1975-2015. Journal of Desert Research, 38(2): 233-242. (in Chinese)
doi: 10.7522/j.issn.1000-694X.2018.00002
|
|
|
| [12] |
Feng X M, Fu B J, Piao S L, et al. 2016. Revegetation in China's Loess Plateau is approaching sustainable water resource limits. Nature Climate Change, 6(11): 1019-1022.
doi: 10.1038/nclimate3092
|
|
|
| [13] |
Guo Z C, Wei W, Shi P J, et al. 2020. Spatiotemporal changes of land desertification sensitivity in the arid region of Northwest China. Acta Geographica Sinica, 75(9): 1948-1965. (in Chinese)
doi: 10.11821/dlxb202009010
|
|
|
| [14] |
Hao C Y, Wu S H. 2006. The effects of land-use types and conversions on desertification in Mu Us Sandy Land of China. Journal of Geographical Sciences, 16(1): 57-68.
doi: 10.1007/s11442-006-0106-2
|
|
|
| [15] |
Hoffmann C, Funk R, Reiche M, et al. 2011. Assessment of extreme wind erosion and its impacts in Inner Mongolia, China. Aeolian Research, 3(3): 343-351.
doi: 10.1016/j.aeolia.2011.07.007
|
|
|
| [16] |
Jiang Y, Pu L J, Zhu M, et al. 2019. Progress and review of the research of farmland requisition-compensation balance in China. Resources Science, 41(12): 2342-2355. (in Chinese)
doi: 10.18402/resci.2019.12.17
|
|
|
| [17] |
Jiapaer G, Chen X, Bao A M. 2011. A comparison of methods for estimating fractional vegetation cover in arid regions. Agricultural and Forest Meteorology, 151(12): 1698-1710.
doi: 10.1016/j.agrformet.2011.07.004
|
|
|
| [18] |
Li F R, Liu J L, Sun T S, et al. 2014. Converting natural vegetation to farmland alters functional structure of ground-dwelling beetles and spiders in a desert oasis. Journal of Insect Conservation, 18(1): 57-67.
doi: 10.1007/s10841-014-9614-z
|
|
|
| [19] |
Li S, Wang T, Yan C Z. 2017. Assessing the role of policies on land-use/cover change from 1965 to 2015 in the Mu Us Sandy Land, northern China. Sustainability, 9(7): 1164, doi: 10.3390/su9071164.
doi: 10.3390/su9071164
|
|
|
| [20] |
Li S, Yan C Z, Wang T, et al. 2019. Monitoring grassland reclamation in the MUD using remote sensing from 2010 to 2015. Environmental Earth Sciences, 78(10): 311, doi: 10.1007/s12665-019-8317-x.
doi: 10.1007/s12665-019-8317-x
|
|
|
| [21] |
Liu L Y, Xu X, Wu J R, et al. 2022. Comprehensive evaluation and scenario simulation of carrying capacity of water resources in Mu Us Sandy Land, China. Water Supply, 22(9): 7256-7271.
doi: 10.2166/ws.2022.304
|
|
|
| [22] |
Liu S Z, Chang Z F, Zhu S J, et al. 2016. Ecological significance of photovoltaic power plants in the desert and Gobi. Ecological Economy, 32(2): 177-181. (in Chinese)
|
|
|
| [23] |
Liu X F, Du H Q, Li S, et al. 2022. Effects of different cropland reclamation periods on soil particle size and nutrients from the perspective of wind erosion in the Mu Us Sandy Land. Frontiers in Environmental Science, 10: 861273, doi: 10.3389/fenvs.2022.861273.
doi: 10.3389/fenvs.2022.861273
|
|
|
| [24] |
Lu Q. 2022. Early prevention of the risk of "secondary desertification" in the Mu Us Sandy Land. Beijing: CPPCC DAILY, 005. [2022-07-16]. http://dzb.rmzxb.com//rmzxbPaper/pc/con/202204/28/content_23805.html. (in Chinese)
|
|
|
| [25] |
Lyu Y L, Shi P J, Han G Y, et al. 2020. Desertification control practices in China. Sustainability, 12(8): 3258, doi: 10.3390/su12083258.
doi: 10.3390/su12083258
|
|
|
| [26] |
Ministry of Natural Resources of the People's Public of China. 2014. National technical plan for survey and evaluation of reserve resources of cultivated land. [2022-10-11]. https://www.mnr.gov.cn/gk/tzgg/201404/t20140429_1991255.html. (in Chinese)
|
|
|
| [27] |
Ngabire M, Wang T, Xue X, et al. 2022. Synergic effects of land-use management systems towards the reclamation of aeolian desertified land in the Shiyang River Basin. Ecological Indicators, 139: 108882, doi: 10.1016/j.ecolind.2022.108882.
doi: 10.1016/j.ecolind.2022.108882
|
|
|
| [28] |
Sadeghravesh M H, Khosravi H, Ghasemian S. 2014. Application of fuzzy analytical hierarchy process for assessment of combating-desertification alternatives in central Iran. Natural Hazards, 75(1): 653-667.
doi: 10.1007/s11069-014-1345-7
|
|
|
| [29] |
Shang Z H, Cao J J, Degen A A, et al. 2019. A four year study in a desert land area on the effect of irrigated, cultivated land and abandoned cropland on soil biological, chemical and physical properties. CATENA, 175: 1-8.
doi: 10.1016/j.catena.2018.12.002
|
|
|
| [30] |
Shi H, Liu X H, Chen Z F, et al. 2019. Eco-environmental problems and their solution strategy for large-scale land consolidation and development in Mu Us Sandy Land of Yulin in North Shaanxi. Chinese Journal of Ecology, 38(7): 2228-2235. (in Chinese)
|
|
|
| [31] |
Tu Z F, Li M X, Sun T. 2016. The status and trend analysis of desertification and sandification. Forest Resources Management, (1): 1-5. (in Chinese)
|
|
|
| [32] |
Wang S H, Zhang Y G, Ju W M, et al. 2020. Recent global decline of CO2 fertilization effects on vegetation photosynthesis. Science, 370(6522): 1295-1300.
doi: 10.1126/science.abb7772
|
|
|
| [33] |
Wang T. 2013. Atlas of Sandy Desert and Aeolian Desertification in Northern China. Beijing: Science Press, 10. (in Chinese)
|
|
|
| [34] |
Wang X, Song J L, Xiao Z Q, et al. 2022. Desertification in the Mu Us Sandy Land in China: Response to climate change and human activity from 2000 to 2020. Geography and Sustainability, 3(2): 177-189.
doi: 10.1016/j.geosus.2022.06.001
|
|
|
| [35] |
Wang X M, Ge Q S, Geng X, et al. 2023. Unintended consequences of combating desertification in China. Nature Communications, 14: 1139, doi: 10.1038/s41467-023-36835-z.
doi: 10.1038/s41467-023-36835-z
pmid: 36854712
|
|
|
| [36] |
Wei L J, Yan D. 2022. Yulin launches five-year action to prevent secondary desertification and land greening. Yulin: Yulin Daily, 004. [2022-07-16]. http://szb.ylrb.com/ylrb/html/2022/20220301/20220301_004/20220301_004_01_7882.html. (in Chinese)
|
|
|
| [37] |
Xie J L, Lu Z X, Feng K. 2022. Effects of climate change and human activities on aeolian desertification reversal in Mu Us Sandy Land, China. Sustainability, 14(3): 1669, doi: 10.3390/su14031669.
doi: 10.3390/su14031669
|
|
|
| [38] |
Xu Z W, Hu R, Wang K X, et al. 2018. Recent greening (1981-2013) in the Mu Us dune field, north-central China, and its potential causes. Land Degradation and Development, 29(5): 1509-1520.
doi: 10.1002/ldr.v29.5
|
|
|
| [39] |
Yan C Z, Wang T, Song X, et al. 2017. Temporal and spatial changes in the pattern of sandy desert and sandy land in northern China from 1975 to 2010 based on an analysis of Landsat images. International Journal of Remote Sensing, 38: 3551-3563.
doi: 10.1080/01431161.2017.1302105
|
|
|
| [40] |
Yuan W P, Zheng Y, Piao S L, et al. 2019. Increased atmospheric vapor pressure deficit reduces global vegetation growth. Science Advances, 5(8): eaax1396, doi: 10.1126/sciadv.aax1396.
doi: 10.1126/sciadv.aax1396
|
|
|
| [41] |
Zhai X H, Yan C Z, Xing X G, et al. 2020. Spatial-temporal changes and driving forces of aeolian desertification of grassland in the Sanjiangyuan region from 1975 to 2015 based on the analysis of Landsat images. Environmental Monitoring and Assessment, 193(1): 2, doi: 10.1007/s10661-020-08763-8.
doi: 10.1007/s10661-020-08763-8
pmid: 33296023
|
|
|
| [42] |
Zhang H Y, Fan J W, Cao W, et al. 2018. Changes in multiple ecosystem services between 2000 and 2013 and their driving factors in the Grazing Withdrawal Program, China. Ecological Engineering, 116: 67-69.
doi: 10.1016/j.ecoleng.2018.02.028
|
|
|
| [43] |
Zhang L, Wu B F, Li X S, et al. 2014. Classification system of China land cover for carbon budget. Acta Ecologica Sinica, 34(24): 7158-7166.
|
|
|
| [44] |
Zhang M M, Wu X Q. 2020. The rebound effects of recent vegetation restoration projects in Mu Us Sandy Land of China. Ecological Indicators, 113: 106228, doi: 10.1016/j.ecolind.2020.106228.
doi: 10.1016/j.ecolind.2020.106228
|
|
|
| [45] |
Zhao M L, Wang Y, Liu S Y, et al. 2022. Correlation assessment of NDVI and land use dynamics with water resources for the southern margin of Mu Us Sandy Land, China. Environmental Science and Pollution Research, 29: 17049-17061.
doi: 10.1007/s11356-021-16757-3
|
|
|
| [46] |
Zhou Y G, Wu Z F, Hu R N, et al. 2020. Characteristics of soil wind erosion in new reclaimation land of Mu Us Sandy Land, China. Transactions of the Chinese Society of Agricultural Engineering, 36(1): 138-147. (in Chinese)
|
|
|
| [47] |
Zhu T J, Ringler C, Iqbal M M, et al. 2013. Climate change impacts and adaptation options for water and food in Pakistan: scenario analysis using an integrated global water and food projections model. Water International, 38(5): 651-669.
doi: 10.1080/02508060.2013.830682
|
|
|
|
Viewed |
|
|
|
Full text
|
|
|
|
|
Abstract
|
|
|
|
|
Cited |
|
|
|
|
| |
Shared |
|
|
|
|
| |
Discussed |
|
|
|
|