| Research article |
|


|
|
|
| Assessment of water resources in Yarmouk River Basin using geospatial technique during the period 1980-2020 |
Noor M AL-KHARABSHEH*( ) ) |
| Department of Water Resources and Environmental Management, Al-Balqa Applied University, Al-Salt 19117, Jordan |
|
|
|
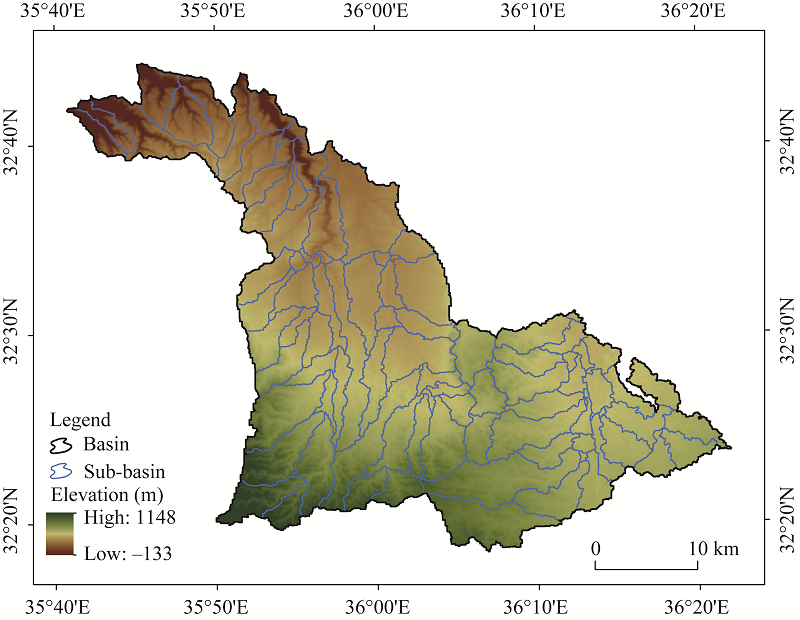
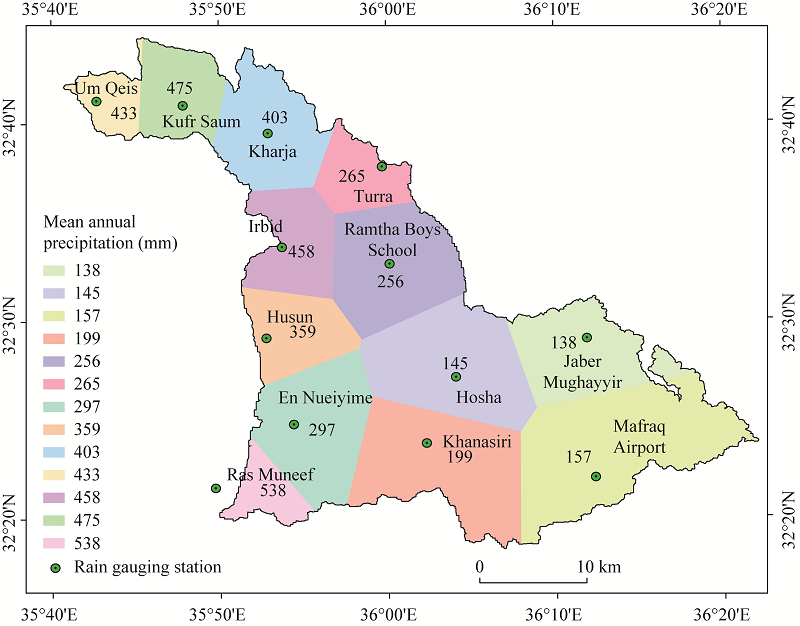
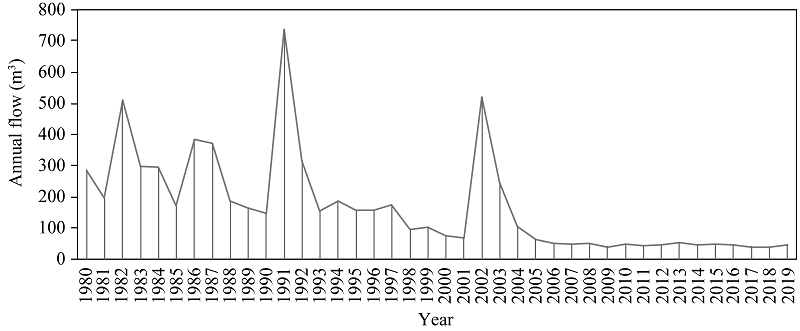
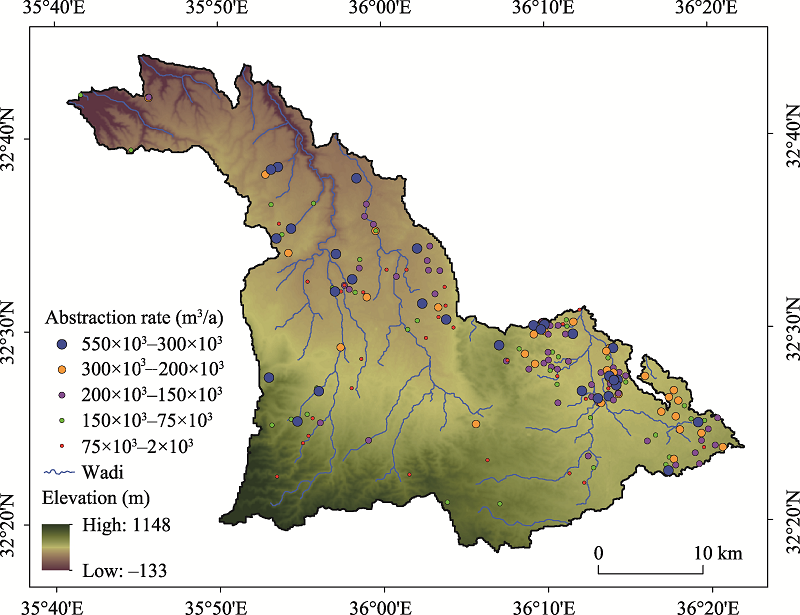
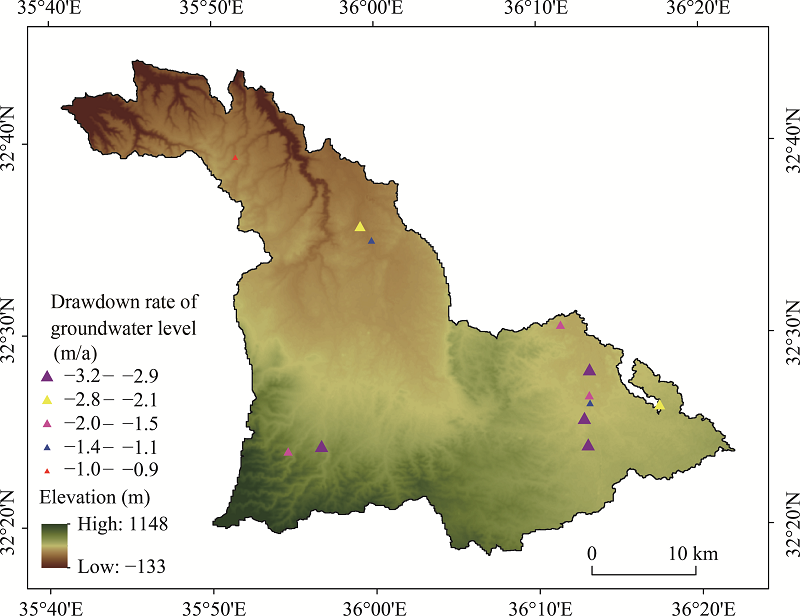
Abstract It is common knowledge that Yarmouk River Basin (YRB) is shared between Jordan and Syria. Management of YRB trans-boundary water resources is attracting increasing interest because it is a strategic water resource for the riparian countries. Actually, lack of sharing information regarding hydrological flows and basin's water management between partners' countries makes it difficult to distinguish between natural and man-made factors affecting the water body. Therefore, this study seeks to address and assess the main on-site changes that exert on YRB. Geospatial technique and arithmetic equations were combined to carry out an assessment of the changes on water resources in YRB. Data, information and field measurements of the basin were aggregated, compiled and presented to determine the extent of changes during the period 1980-2020. Remarkable findings showed that precipitation amount in the basin significantly declined during the period 1980-2020 in particularly after the year 1992. Pumping rate of groundwater was 550×103 m3/a, exceeding the basin's safe yield. Draw down of static groundwater level over time approached the value of -3.2 m/a due to the over abstraction in the aquifer body. Additionally, the evaporation rate reached more than 99% in some regions in the basin. Moreover, the number of private wells has increased from 98 wells in 1980 to 126 wells in 2020, showing the excessive extraction of groundwater. These findings indicate that the study area is subjected to a considerable groundwater depletion in the near future due to extensive abstraction, continuous drilling of illegal wells and decreased annual precipitation under the shadow of the rapid population growth and continuous influx of refugees. Therefore, decision makers-informed scenarios are suggested in the development of water resource portfolios, which involves the combination of management and infrastructural actions that enhance the water productivity of the basin. Further studies are recommended to evaluate the on-site changes on water resources in YRB in collaboration with riparian countries and to establish monitoring system for continuous and accurate measurements of the basin.
|
|
Received: 30 September 2021
Published: 28 February 2022
|
|
Corresponding Authors:
*Noor M AL-KHARABSHEH (E-mail: noormkh@bau.edu.jo)
|
|
|
| [1] |
Abdulla F, Al-Shurafat A. 2020. Rainfall-runoff modelling for semi-arid and trans-boundary Yarmouk river basin. Procedia Manufacturing, 44:180-188.
doi: 10.1016/j.promfg.2020.02.220
|
|
|
| [2] |
Adamovic M, Braud I, Branger F, et al. 2015. Assessing the simple dynamical systems approach in a Mediterranean context: application to the Ardèche catchment (France). Hydrology and Earth System Sciences, 19(5):2427-2449.
doi: 10.5194/hess-19-2427-2015
|
|
|
| [3] |
Avisse N, Tilmant A, Rosenberg D, et al. 2020. Quantitative assessment of contested water uses and management in the conflict-torn Yarmouk River Basin. Journal of Water Resources Planning and Management, 146(7):1-41.
|
|
|
| [4] |
Awawdeh M, Jaradat R, Al Qudah K, et al. 2019. GIS-based analysis of potential water infiltration in the upper Yarmouk River basin, north Jordan. The Jordan Journal of Earth and Environmental Sciences, 10(3):136-144.
|
|
|
| [5] |
Awawdeh M, Al-Kharbsheh N, Obeidat M, et al. 2020. Groundwater vulnerability assessment using modified SINTACS model in WadiShueib, Jordan. Annals of GIS, 26(4):377-394.
doi: 10.1080/19475683.2020.1773535
|
|
|
| [6] |
Bunning S, McDonagh J, Rioux J. 2016. Manual for local level assessment of land degradation and sustainable land management: Water resources assessment-LADA project, 139-153. [2021-07-30]. http://www.fao.org/3/a-i6362e.pdf .
|
|
|
| [7] |
Courcier R, Venot J, Molle F. 2005. Historical transformations of the Lower Jordan River Basin (in Jordan): Changes in water use and projections (1950-2025), Comprehensive assessment of water management in agriculture research report 9, 32-60. [2021-08-03]. https://horizon.documentation.ird.fr/exl-doc/pleins_textes/divers15-08/010039160.pdf .
|
|
|
| [8] |
Duan W, Zou S, Chen Y, et al. 2020. Sustainable water management for cross-border resources: The Balkhash Lake Basin of Central Asia, 1931-2015. Journal of Cleaner Production, 263(2020):121614, doi: 10.1016/j.jclepro.2020.121614.
doi: 10.1016/j.jclepro.2020.121614
|
|
|
| [9] |
Duan W, Maskey S, Chaffe P, et al. 2021. Recent advancement in remote sensing technology for hydrology analysis and water resources management. Remote Sensing, 13(6):1097, doi: 10.3390/rs13061097.
doi: 10.3390/rs13061097
|
|
|
| [10] |
ESRI (Environmental Systems Research Institute). 2021. How to: Create contour lines based on values other than elevation points. [2021-07-31]. https://support.esri.com/en/technical-article/00001427 .
|
|
|
| [11] |
Hoff H, Bonzi C, Joyce B, et al. 2011. A water resources planning tool for the Jordan River Basin. Water, 3:718-736.
doi: 10.3390/w3030718
|
|
|
| [12] |
Kunstmann H, Suppan P, Heckl A, et al. 2007. 2007. Regional climate change in the Middle East and impact in hydrology in the upper Jordan catchment. In: Quantification and Reduction of Predictive Uncertainty for Sustainable Water Resources Management, Symposium HS2004 at IUGG2007. Perugia: IAHS Publication, 313:141-148.
|
|
|
| [13] |
Meran G, Siehlow M, von Hirschhausen C. 2021 Integrated water resource management: Principles and applications. In: Andrey G K. Springer Water. Switzerland: Springer International Publishing, 23-121.
|
|
|
| [14] |
MWI (Ministry of Water and Irrigation). 2016a. Water Reallocation Policy. Amman: MWI, 1-17.
|
|
|
| [15] |
MWI (Ministry of Water and Irrigation). 2016b. National Water Strategy 2016-2025. Amman: MWI, 7-61.
|
|
|
| [16] |
MWI (Ministry of Water and Irrigation). 2016c. Surface Water Policy 2015-2025. Amman: MWI, 1-6.
|
|
|
| [17] |
MWI (Ministry of Water and Irrigation). 2019. Water Budget. Amman: MWI, 1-12.
|
|
|
| [18] |
Obeidat M, Awawdeh M, Lababneh A. 2019. Assessment of land use/land cover change and its environmental impacts using remote sensing and GIS techniques, Yarmouk River Basin, north Jordan. Arabian Journal of Geosciences, 12:685.
doi: 10.1007/s12517-019-4905-z
|
|
|
| [19] |
Obeidat M, Awawdeh M, Al-Kharabsheh N, et al. 2020. Source identification of nitrate in the upper aquifer system of the Wadi Shueib catchment area in Jordan based on stable isotope composition. Journal of Arid Land, 13(4):350-374.
doi: 10.1007/s40333-021-0055-8
|
|
|
| [20] |
Salameh E. 2004. Using environmental isotopes in the study of the recharge-discharge mechanisms of the Yarmouk catchment area in Jordan. Hydrogeology Journal, 12(4):451-463.
|
|
|
| [21] |
Turc L. 1951. New formulas for the water balance according to the average annual values of precipitation and temperature. The Academy of Science (Paris), 233:633-635.
|
|
|
| [22] |
UNICEF (The United Nations International Children's Emergency Fund). 2021. Water, sanitation and hygiene. UNICEF, Amman, Jordan. [2021-05-20]. https://www.unicef.org/jordan/water-sanitation-and-hygiene .
|
|
|
| [23] |
US Geological Survey. 2021. Earth explorer, data sets. [2021-04-15]. http://earthexplorer.usgs.gov .
|
|
|
| [24] |
WAJ (Water Authority of Jordan). 2019. Open Files of WA[J]. Amman: WAJ, 1-6.
|
|
|
|
Viewed |
|
|
|
Full text
|
|
|
|
|
Abstract
|
|
|
|
|
Cited |
|
|
|
|
| |
Shared |
|
|
|
|
| |
Discussed |
|
|
|
|