| Research article |
|

|
|
|
| Attribution analysis and multi-scenario prediction of NDVI drivers in the Xilin Gol grassland, China |
XU Mengran, ZHANG Jing( ), LI Zhenghai, MO Yu ), LI Zhenghai, MO Yu |
| College of Enoironment and Bioresources, Dalian Minzu University, Dalian 116600, China |
|
|
|
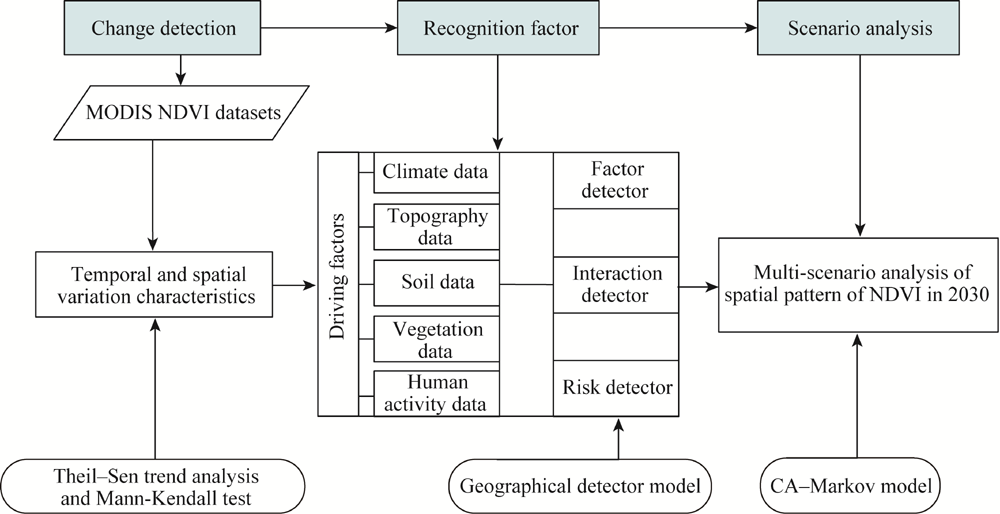
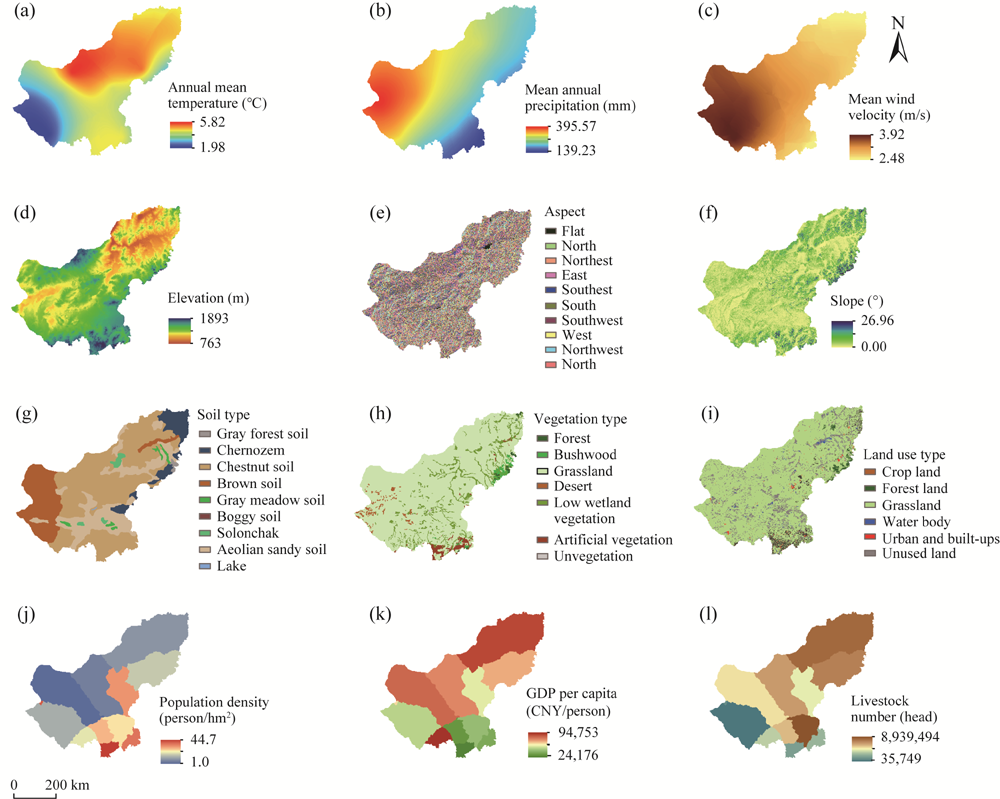
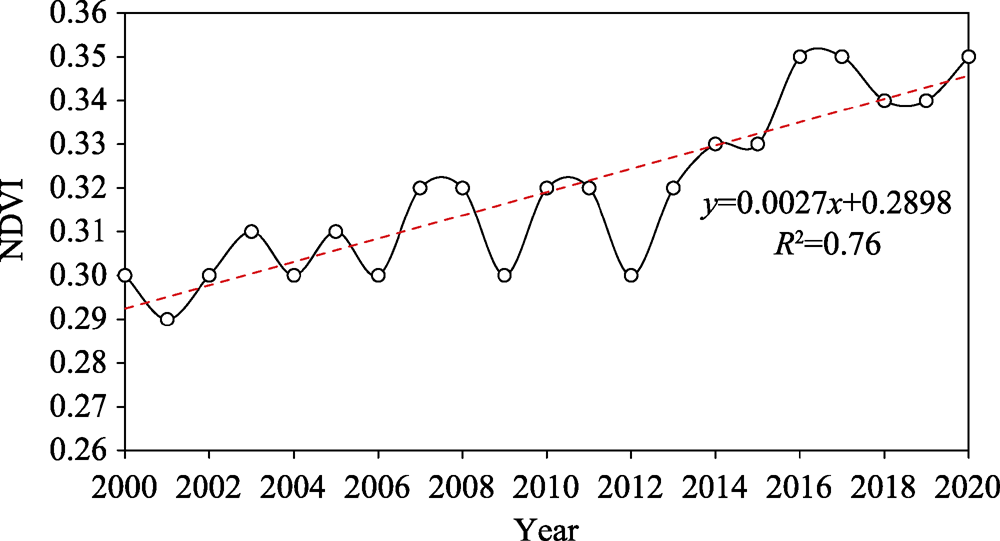
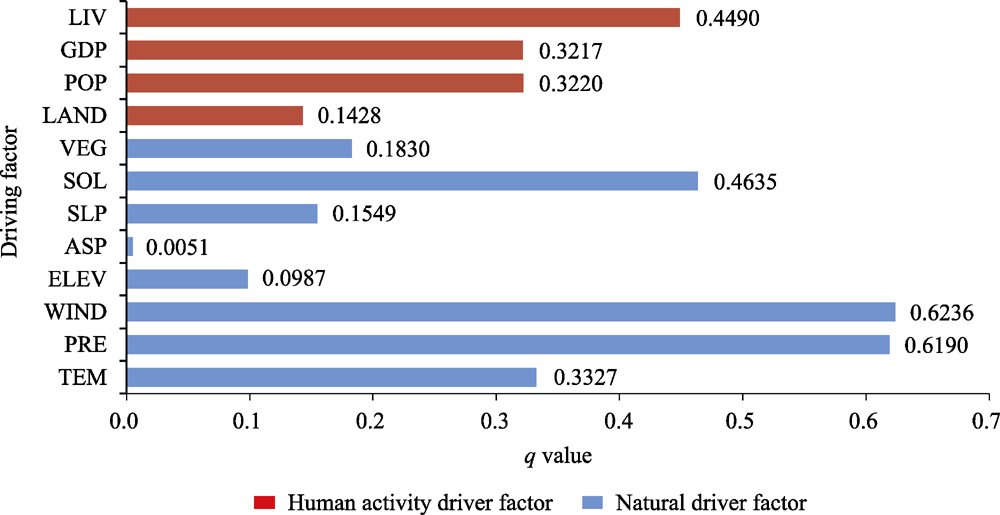
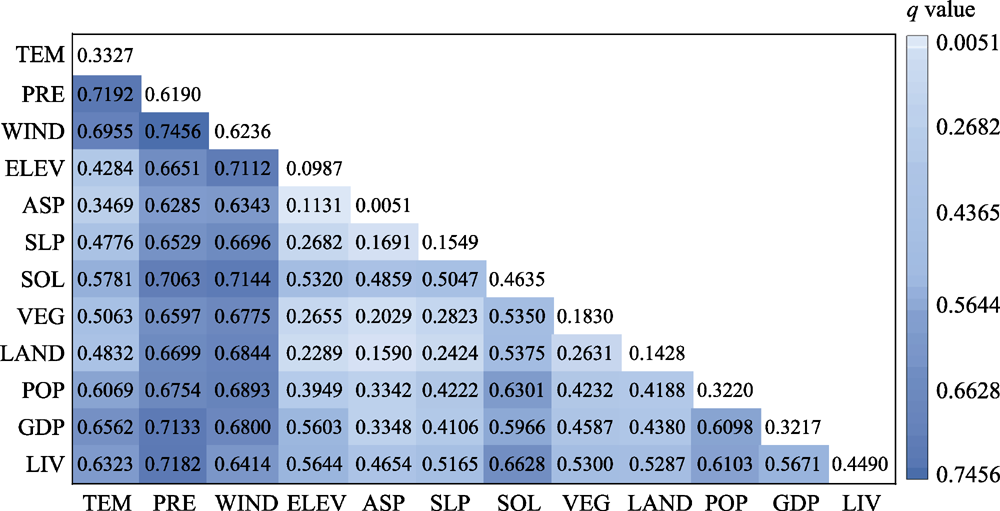
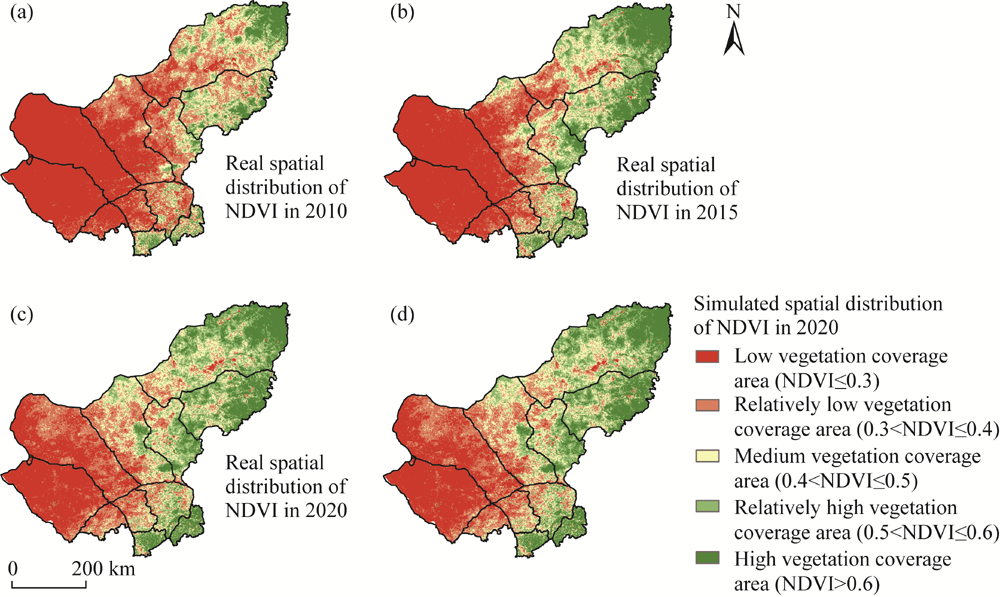
Abstract Grassland degradation is influenced by climate change and human activities, and has become a major obstacle for the development of arid and semi-arid areas, posing a series of environmental and socio-economic problems. An in-depth understanding of the inner relations among grassland vegetation dynamics, climate change, and human activities is therefore greatly significant for understanding the variation in regional environmental conditions and predicting future developmental trends. Based on MODIS (moderate resolution imaging spectroradiometer) NDVI (normalized difference vegetation index) data from 2000 to 2020, our objective is to investigate the spatiotemporal changes of NDVI in the Xilin Gol grassland, Inner Mongolia Autonomous Region, China. Combined with 12 natural factors and human activity factors in the same period, the dominant driving factors and their interactions were identified by using the geographic detector model, and multiple scenarios were also simulated to forecast the possible paths of future NDVI changes in this area. The results showed that: (1) in the past 21 a, vegetation cover in the Xilin Gol grassland exhibited an overall increasing trend, and the vegetation restoration (84.53%) area surpassed vegetation degradation area (7.43%); (2) precipitation, wind velocity, and livestock number were the dominant factors affecting NDVI (the explanatory power of these factors exceeded 0.4). The interaction between average annual wind velocity and average annual precipitation, and between average annual precipitation and livestock number greatly affected NDVI changes (the explanatory power of these factors exceeded 0.7). Moreover, the impact of climate change on NDVI was more significant than human activities; and (3) scenario analysis indicated that NDVI in the Xinlin Gol grassland increased under the scenarios of reduced wind velocity, increased precipitation, and ecological protection. In contrast, vegetation coverage restoration in this area was significantly reduced under the scenarios of unfavorable climate conditions and excessive human activities. This study provides a scientific basis for future vegetation restoration and management, ecological environmental construction, and sustainable natural resource utilization in this area.
|
|
Received: 04 June 2022
Published: 30 September 2022
|
|
Corresponding Authors:
*ZHANG Jing (E-mail: Zhangjing@dlnu.edu.cn)
|
|
|
| [1] |
Aguejdad R. 2021. The influence of the calibration interval on simulating non-stationary urban growth dynamic using CA-Markov Model. Remote Sensing, 13(3): 468-488.
doi: 10.3390/rs13030468
|
|
|
| [2] |
Alfredo H. 2016. Ecology: Vegetation's responses to climate variability. Nature, 531(7593):181-182.
doi: 10.1038/nature17301
|
|
|
| [3] |
Ali B A, Oumayma B, Riadh F I, et al. 2018. Comparative study of three satellite image time-series decomposition methods for vegetation change detection. European Journal of Remote Sensing, 51(1): 607-615.
doi: 10.1080/22797254.2018.1465360
|
|
|
| [4] |
Batunacun, Claas N, Hu Y F, et al. 2018. Land-use change and land degradation on the Mongolian Plateau from 1975 to 2015-A case study from Xilingol, China. Land Degradation and Development, 29(6): 1595-1606.
doi: 10.1002/ldr.2948
|
|
|
| [5] |
Burrell A L, Evans J P, Liu Y. 2017. Detecting dryland degradation using time series segmentation and residual trend analysis (TSS-RESTREND). Remote Sensing of Environment, 197: 43-57.
doi: 10.1016/j.rse.2017.05.018
|
|
|
| [6] |
Chen T, Xia J, Zou L, et al. 2020. Quantifying the influences of natural factors and human activities on NDVI changes in the Hanjiang River Basin, China. Remote Sensing, 12(22): 3780, doi: 10.3390/rs12223780.
doi: 10.3390/rs12223780
|
|
|
| [7] |
Culik II K, Hurd L P, Yu S. 1990. Computation theoretic aspects of cellular automata. Physica D: Nonlinear Phenomena, 45(1-3): 357-378.
doi: 10.1016/0167-2789(90)90194-T
|
|
|
| [8] |
Dai G S, Ulgiati S, Zhang Y S, et al. 2014. The false promises of coal exploitation: How mining affects herdsmen well-being in the grassland ecosystems of Inner Mongolia. Energy Policy, 67: 146-153.
doi: 10.1016/j.enpol.2013.12.033
|
|
|
| [9] |
Dong S K, Gao H W, Xu G C, et al. 2007. Farmer and professional attitudes to the large-scale ban on livestock grazing of grasslands in China. Environmental Conservation, 34(3): 246-254.
|
|
|
| [10] |
Du J Q, Quan Z J, Fang S F, et al. 2020. Spatiotemporal changes in vegetation coverage and its causes in China since the Chinese economic reform. Environmental Science and Pollution Research, 27(1): 1144-1159.
doi: 10.1007/s11356-019-06609-6
|
|
|
| [11] |
Fu X, Wang X, Yang Y J. 2018. Deriving suitability factors for CA-Markov land use simulation model based on local historical data. Journal of Environmental Management, 206: 10-19.
doi: 10.1016/j.jenvman.2017.10.012
|
|
|
| [12] |
Gardiner B, Berry P, Moulia B. 2016. Wind impacts on plant growth, mechanics and damage. Plant Sciences, 245: 94-118.
doi: 10.1016/j.plantsci.2016.01.006
|
|
|
| [13] |
Gong Z N, Zhao S Y, Gu J Z. 2017. Correlation analysis between vegetation coverage and climate drought conditions in North China during 2001-2013. Journal of Geographical Sciences, 27(2): 143-160.
doi: 10.1007/s11442-017-1369-5
|
|
|
| [14] |
Gu Z J, Duan X W, Shi Y D, et al. 2018. Spatiotemporal variation in vegetation coverage and its response to climatic factors in the Red River Basin, China. Ecological Indicators, 93: 54-64.
doi: 10.1016/j.ecolind.2018.04.033
|
|
|
| [15] |
Hao L, Sun G, Liu Y Q, et al. 2014. Effects of precipitation on grassland ecosystem restoration under grazing exclusion in Inner Mongolia, China. Landscape Ecology, 29: 1657-1673.
doi: 10.1007/s10980-014-0092-1
|
|
|
| [16] |
Hao R, Yu D, Wu J. 2017. Relationship between paired ecosystem services in the grassland and agro-pastoral transitional zone of China using the constraint line method. Agriculture Ecosystems and Environment, 240: 171-181.
doi: 10.1016/j.agee.2017.02.015
|
|
|
| [17] |
He B, Liu J, Guo L, et al. 2018. Recovery of ecosystem carbon and energy FluXes from the 2003 drought in Europe and the 2012 drought in the United States. Geophysical Research Letters, 45(10): 4879-4888.
doi: 10.1029/2018GL077518
|
|
|
| [18] |
He C Y, Tian J, Gao B, et al. 2015. Differentiating climate- and human-induced drivers of grassland degradation in the Liao River Basin, China. Environmental Monitoring and Assessment, 187: 4199, doi: 10.1007/s10661-014-4199-2.
doi: 10.1007/s10661-014-4199-2
|
|
|
| [19] |
Hu Y F, Alatengtuya, Yan Y. 2013. Comprehensive Monitoring and Assessment of Xilin Gol Ecosystem in Inner Mongolia. Beijing: China Environment Publishing House, 1-331. (in Chinese)
|
|
|
| [20] |
IPCC(Intergovernmental Panel on Climate Change). 2013. Climate Change 2013:The Physical Science Basis. Contribution of Working Group I to the Fifth Assessment Report of the Intergovernmental Panel on Climate Change. Geneva: IPCC.
|
|
|
| [21] |
Jiang W G, Yuan L H, Wang W J, et al. 2015. Spatio-temporal analysis of vegetation variation in the Yellow River Basin. Ecological Indicators, 51: 117-126.
doi: 10.1016/j.ecolind.2014.07.031
|
|
|
| [22] |
Kendall M G. 1990. Rank correlation methods. British Journal of Psychology, 25(1): 86-91.
|
|
|
| [23] |
Li A, Wu J, Huang J. 2012. Distinguishing between human-induced and climate-driven vegetation changes: a critical application of RESTREND in Inner Mongolia. Landscape Ecology, 27(7): 969-982.
doi: 10.1007/s10980-012-9751-2
|
|
|
| [24] |
Li J Q, Li Z L, Dong S P, et al. 2021. Spatial and temporal changes in vegetation and desertification (1982-2018) and their responses to climate change in the Ulan Buh Desert, Northwest China. Theoretical and Applied Climatology, 143: 1643-1654.
doi: 10.1007/s00704-021-03522-2
|
|
|
| [25] |
Liu C, Melack J, Tian Y, et al. 2019. Detecting land degradation in eastern China grasslands with time series segmentation and residual trend analysis (TSS-RESTREND) and GIMMS NDVI3g data. Remote Sensing, 11(9): 1014-1032.
doi: 10.3390/rs11091014
|
|
|
| [26] |
Liu C L, Li W L, Zhu G F, et al. 2020. Land use/land cover changes and their driving factors in the northeastern Tibetan Plateau based on geographical detectors and Google Earth engine: A case study in Gannan Prefecture. Remote Sensing, 12(19): 3139-3157.
doi: 10.3390/rs12193139
|
|
|
| [27] |
Mann H B. 1945. Nonparametric test against trend. Econometrica, 13(3): 245-259.
doi: 10.2307/1907187
|
|
|
| [28] |
Meng L Q, Gao S, Li Y S, et al. 2020. Spatial and temporal characteristics of vegetation NDVI changes and the driving forces in Mongolia during 1982-2015. Remote Sensing, 12(4): 603-628.
doi: 10.3390/rs12040603
|
|
|
| [29] |
Munkhnasan L, Woo-Kyun L, Woo J S, et al. 2018. Long-term trend and correlation between vegetation green-ness and climate variables in Asia based on satellite data. Science of the Total Environment, 618(15): 1089-1095.
doi: 10.1016/j.scitotenv.2017.09.145
|
|
|
| [30] |
Naeem S, Zhang Y, Zhang X, et al. 2021. Both climate and socioeconomic drivers contribute to vegetation greening of the Loess Plateau. Science Bulletin, 66(12): 1160-1163.
doi: 10.1016/j.scib.2021.03.007
|
|
|
| [31] |
Otgonbayar M, Atzberger C, Chambers J, et al. 2017. Land suitability evaluation for agricultural cropland in Mongolia using the spatial MCDM method and AHP based GIS. Journal of Geoscience and Environment Protection, 5: 238-263.
doi: 10.4236/gep.2017.59017
|
|
|
| [32] |
Pan N Q, Feng X M, Fu B J, et al. 2018. Increasing global vegetation browning hidden in overall vegetation greening: insights from time-varying trends. Remote Sensing of Environment, 214: 59-72.
doi: 10.1016/j.rse.2018.05.018
|
|
|
| [33] |
Pan T, Zou X, Liu Y, et al. 2017. Contributions of climatic and non-climatic drivers to grassland variations on the Tibetan Plateau. Ecological Engineering, 108: 307-317.
doi: 10.1016/j.ecoleng.2017.07.039
|
|
|
| [34] |
Piao S L, Mohammat A, Fang J Y, et al. 2006. NDVI-based increase in growth of temperate grasslands and its responses to climate changes in China. Global Environmental Change, 16(4): 340-348.
doi: 10.1016/j.gloenvcha.2006.02.002
|
|
|
| [35] |
Qian T, Bagan H, Kinoshita T, et al. 2014. Spatial-temporal analyses of surface coal mining dominated land degradation in Holingol, Inner Mongolia. IEEE Journal of Selected Topics in Applied Earth Observations and Remote Sensing, 7(5): 1675-1687.
doi: 10.1109/JSTARS.2014.2301152
|
|
|
| [36] |
Qiao J M, Yu D Y, Wu G J. 2018. How do climatic and management factors affect agricultural ecosystem services? A case study in the agro-pastoral transitional zone of northern China. Science of the Total Environment, 613-614: 314-323.
doi: 10.1016/j.scitotenv.2017.08.264
|
|
|
| [37] |
Rhif M, Abbes A B, Martinez B, et al. 2020. An improved trend vegetation analysis for non-stationary NDVI time series based on wavelet transform. Environmental Science and Pollution Research, 28(34): 46603-46613.
doi: 10.1007/s11356-020-10867-0
|
|
|
| [38] |
Shi N N, Xiao N W, Wang Q, et al. 2019. Temporal and spatial variation of NDVI and its driving forces in Xilingol. Chinese Journal of Plant Ecology, 43(4): 331-341. (in Chinese)
doi: 10.17521/cjpe.2018.0254
|
|
|
| [39] |
Subramanian B, Zhou W J, Ji H L, et al. 2020. Environmental and management controls of soil carbon storage in grasslands of southwestern China. Journal of Environmental Management, 254(2): 109810, doi: 10.1016/j.jenvman.2019.109810.
doi: 10.1016/j.jenvman.2019.109810
|
|
|
| [40] |
Sun B, Li Z Y, Gao Z H, et al. 2017. Grassland degradation and restoration monitoring and driving forces analysis based on long time-series remote sensing data in Xilin Gol League. Acta Ecologica Sinica, 37(4): 219-228. (in Chinese)
doi: 10.1016/j.chnaes.2017.02.009
|
|
|
| [41] |
Sun R, Chen S H, Su H B. 2021. Climate dynamics of the spatiotemporal changes of vegetation NDVI in Northern China from 1982 to 2015. Remote Sensing, 13(2): 187-207.
doi: 10.3390/rs13020187
|
|
|
| [42] |
Tao S, Guang T T, Peng W F, et al. 2020. Spatial-temporal variation and driving forces of NDVI in the upper Reaches of the Yangtze River from 2000 to 2015: A case study of Yibin Sinica, Ecologica City. Acta Ecologica Sinica, 40(14): 5029-5043. (in Chinese)
|
|
|
| [43] |
Wang J F, Li X H, Christakos G, et al. 2010. Geographical detectors-based health risk assessment and its application in the neural tube defects study of the Heshun Region, China. International Journal of Geographical Information Science, 24(1): 107-127.
doi: 10.1080/13658810802443457
|
|
|
| [44] |
Wang J F, Wu T L. 2019. Analysis on runoff variation characteristics and its attribution in the upper reaches of Zhanghe river basin. Arid Land Resources and Management, 33: 165-171. (in Chinese)
|
|
|
| [45] |
Wang J S, Xu C D. 2017. Geodetector: Principle and prospective. Acta Geographica Sinica, 72(1): 116-134. (in Chinese)
|
|
|
| [46] |
Wang L X, Yu D Y, Liu Z, et al. 2018. Study on NDVI changes in Weihe Watershed based on CA-Markov model. Geological Journal, 53(S2): 435-441.
doi: 10.1002/gj.3259
|
|
|
| [47] |
Wang M, Yang W B, Wu N, et al. 2019. Patterns and drivers of soil carbon stock in southern China’s grasslands. Agricultural and Forest Meteorology, 276-277: 107634, doi: 10.1016/j.agrformet.2019.107634.
doi: 10.1016/j.agrformet.2019.107634
|
|
|
| [48] |
Wang X, Yi S, Wu Q, et al. 2016. The role of permafrost and soil water in distribution of alpine grassland and its NDVI dynamics on the Qinghai-Tibetan Plateau. Global and Planetary Change, 147: 40-53.
doi: 10.1016/j.gloplacha.2016.10.014
|
|
|
| [49] |
Wang X M, Lang L L, Yan P, et al. 2016. Aeolian processes and their effect on sandy desertification of the Qinghai-Tibet Plateau: A wind tunnel experiment. Soil and Tillage Research, 158: 67-75.
doi: 10.1016/j.still.2015.12.004
|
|
|
| [50] |
Wu D G, Zhao X, Liang S L, et al. 2015. Time-lag effects of global vegetation responses to climate change. Global Change Biology, 21(9): 3520-3531.
doi: 10.1111/gcb.12945
|
|
|
| [51] |
Wu N T, Liu G X, Liu A J, et al. 2020. Monitoring and driving force analysis of net primary productivity in native grassland: A case study in Xilingol steppe, China. The Journal of Applied Ecology, 31(4): 1233-1240. (in Chinese)
|
|
|
| [52] |
Wu S, Gao X, Lei J, et al. 2020. Spatial and temporal changes in the normalized difference vegetation index and their driving factors in the desert/grassland biome transition zone of the Sahel Region of Africa. Remote Sensing, 12(24): 4119-4146.
doi: 10.3390/rs12244119
|
|
|
| [53] |
Xie L F, Wu W C, Huang X L, et al. 2020. Mining and restoration monitoring of rare earth element (REE) exploitation by new remote sensing indicators in southern JiangXi, China. Remote Sensing, 12(21): 3558-3577.
doi: 10.3390/rs12213558
|
|
|
| [54] |
Xie Y C, Sha Z Y. 2012. Quantitative analysis of driving factors of grassland degradation: A case study in Xilin River Basin, Inner Mongolia. The Scientific World Journal, 2012: 169724, doi: 10.1100/2012/169724.
doi: 10.1100/2012/169724
|
|
|
| [55] |
Xin L, Li X B, Dou H S, et al. 2020. Evaluation of grassland carbon pool based on TECO-R model and climate-driving function: A case study in the Xilingol typical steppe region of Inner Mongolia, China. Ecological Indicators, 117: 106508, doi: 10.1016/j.ecolind.2020.106508.
doi: 10.1016/j.ecolind.2020.106508
|
|
|
| [56] |
Yan J, Zhang G, Ling H,et al. 2022. Comparison of time-integrated NDVI and annual maximum NDVI for assessing grassland dynamics. Ecological Indicators, 136: 108611, doi: 10.1016/j.ecolind.2022.108611.
doi: 10.1016/j.ecolind.2022.108611
|
|
|
| [57] |
Yang Y, Niu J M, Zhang Q, et al. 2011. Ecological footprint analysis of a semi-arid grassland region facilitates assessment of its ecological carrying capacity: a case study of Xilinguole League. Acta Ecologica Sinica, 31(17): 5096-5104. (in Chinese)
|
|
|
| [58] |
Yang Y J, Wang S J, Bai X Y. 2019. Factors affecting long-term trends in global NDVI. Forests, 10(5): 372-389.
doi: 10.3390/f10050372
|
|
|
| [59] |
Yu L F, Chen Y, Sun W J, et al. 2019. Effects of grazing exclusion on soil carbon dynamics in alpine grasslands of the Tibetan Plateau. Geoderma, 353: 133-143.
doi: 10.1016/j.geoderma.2019.06.036
|
|
|
| [60] |
Zhang L Y, Liu A J, Xing Q, et al. 2006. Trend and analysis of vegetation variation of typical rangeland in Inner Mongolia-a case study of typical rangeland of Xilinguole. Journal of Arid Land Resources and Environment, 20(2): 185-190. (in Chinese)
|
|
|
| [61] |
Zhao Y, He C, Zhang Q. 2012. Monitoring vegetation dynamics by coupling linear trend analysis with change vector analysis: A case study in the Xilingol steppe in northern China. International Journal of Remote Sensing, 33(1): 287-308.
doi: 10.1080/01431161.2011.594102
|
|
|
| [62] |
Zheng K Y, Tan L S, Sun Y W, et al. 2021. Impacts of climate change and anthropogenic activities on vegetation change: Evidence from typical areas in China. Ecological Indicators, 126: 107648, doi: 10.1016/j.ecolind.2021.107648.
doi: 10.1016/j.ecolind.2021.107648
|
|
|
| [63] |
Zou X Y, Li J F, Cheng H, et al. 2018. Spatial variation of topsoil features in soil wind erosion areas of northern China. CATENA, 167: 429-439.
doi: 10.1016/j.catena.2018.05.022
|
|
|
|
Viewed |
|
|
|
Full text
|
|
|
|
|
Abstract
|
|
|
|
|
Cited |
|
|
|
|
| |
Shared |
|
|
|
|
| |
Discussed |
|
|
|
|