| Research article |
|

|
|
|
| Spatial-temporal changes and driving factors of eco- environmental quality in the Three-North region of China |
LONG Yi1,2,3, JIANG Fugen1,2,3, DENG Muli1,2,3, WANG Tianhong1,2,3, SUN Hua1,2,3,*( ) ) |
1Research Center of Forestry Remote Sensing & Information Engineering, Central South University of Forestry and Technology, Changsha 410004, China
2Key Laboratory of Forestry Remote Sensing Based Big Data & Ecological Security for Hunan Province, Changsha 410004, China
3Key Laboratory of National Forestry & Grassland Administration on Forest Resources Management and Monitoring in Southern Area, Changsha 410004, China |
|
|
|
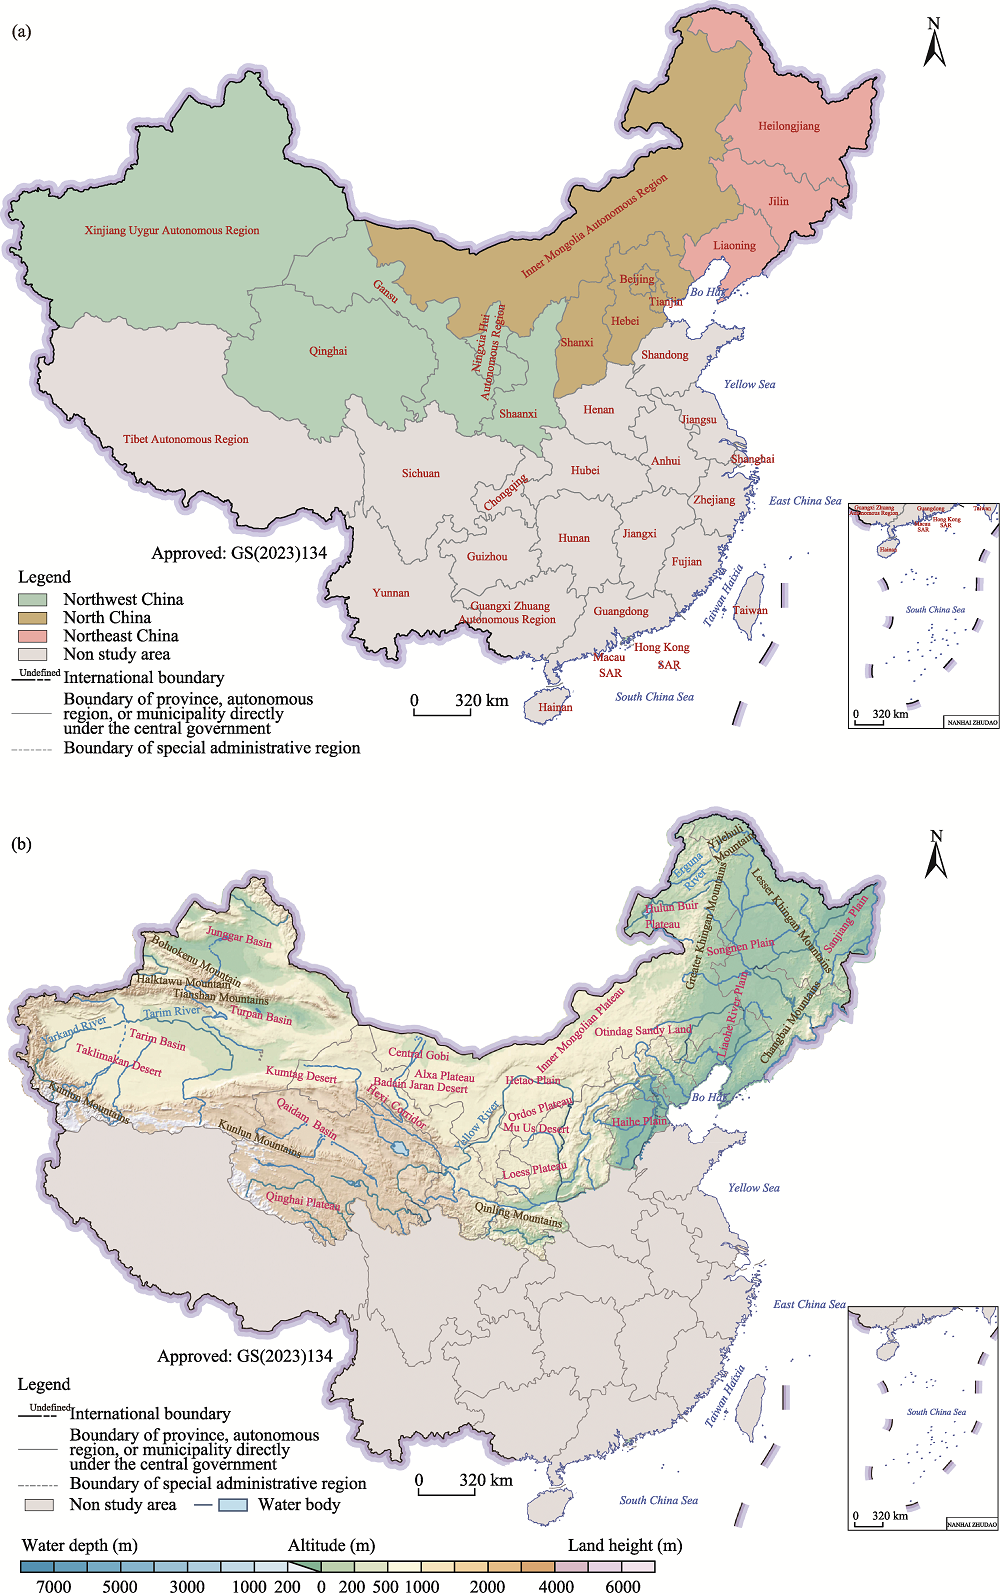
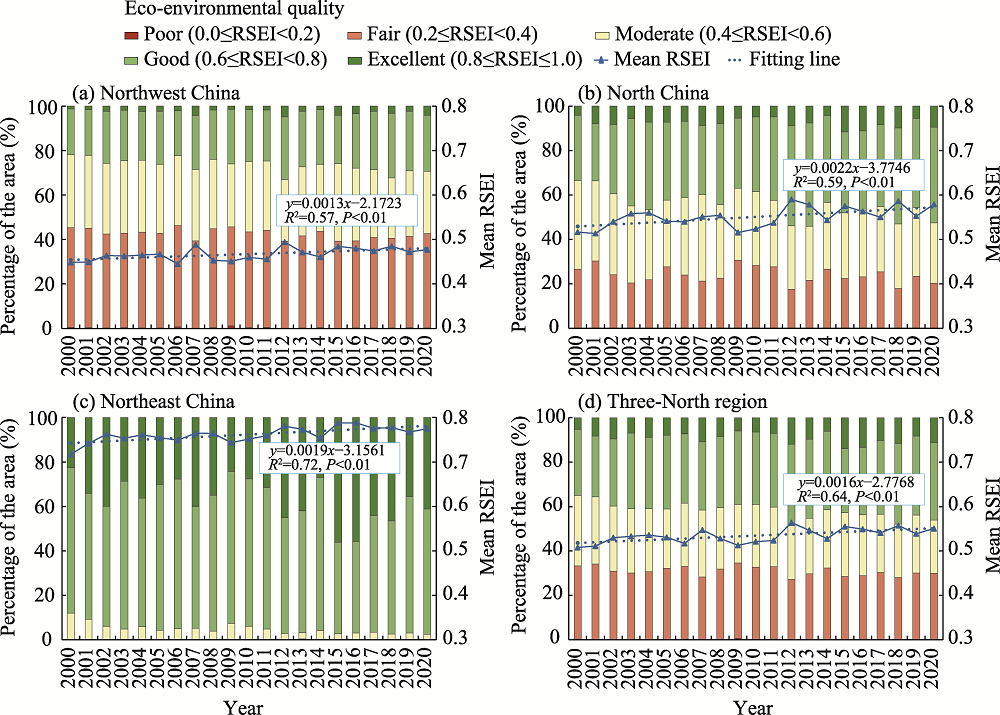
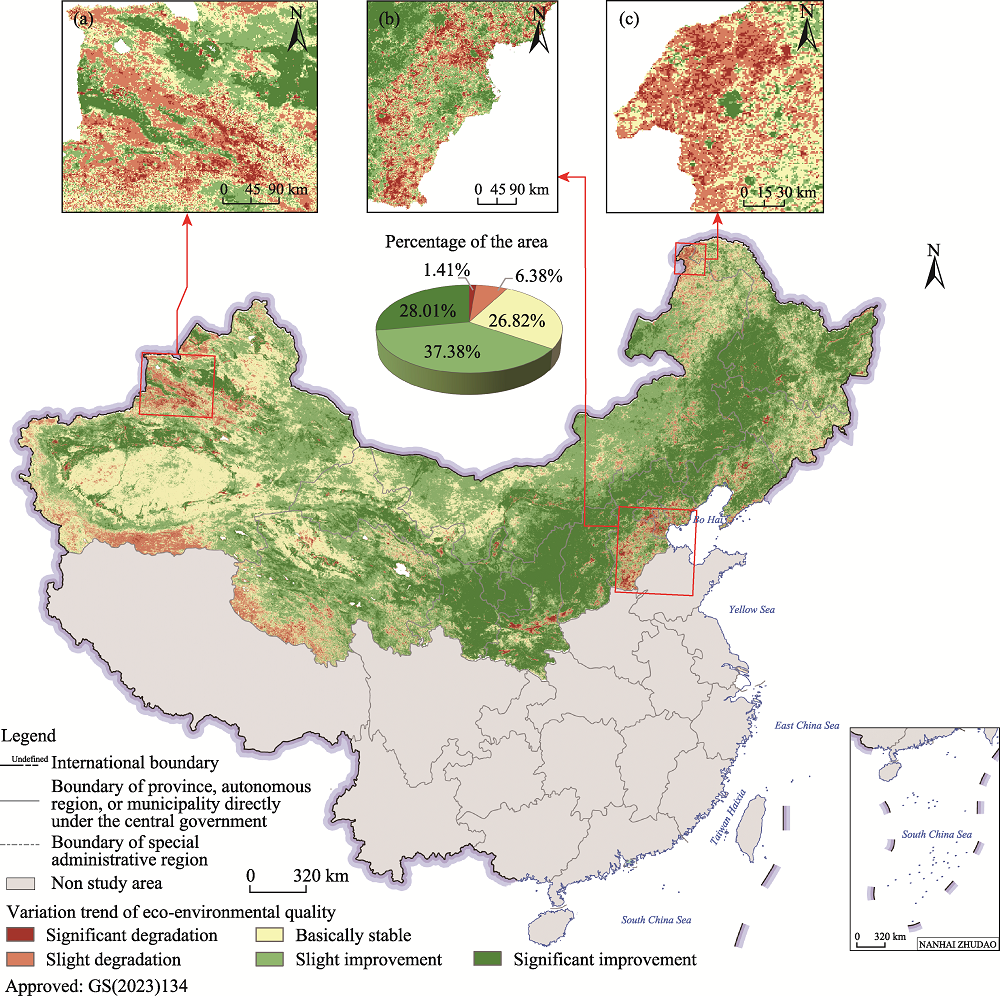
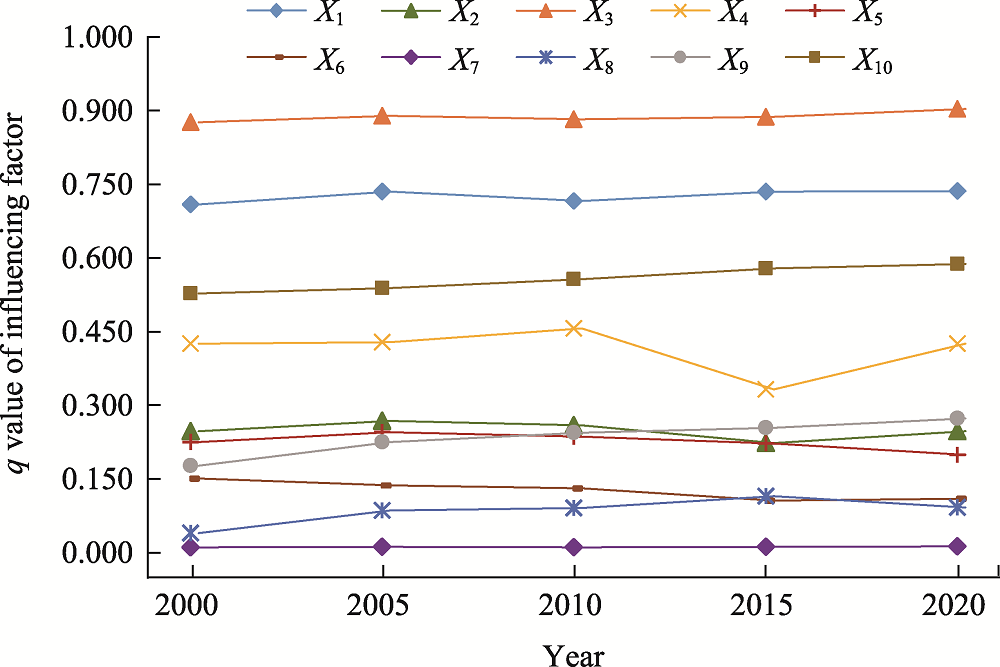
Abstract Eco-environmental quality is a measure of the suitability of the ecological environment for human survival and socioeconomic development. Understanding the spatial-temporal distribution and variation trend of eco-environmental quality is essential for environmental protection and ecological balance. The remote sensing ecological index (RSEI) can quickly and objectively quantify eco-environmental quality and has been extensively utilized in regional ecological environment assessment. In this paper, Moderate Resolution Imaging Spectroradiometer (MODIS) images during the growing period (July-September) from 2000 to 2020 were obtained from the Google Earth Engine (GEE) platform to calculate the RSEI in the three northern regions of China (the Three-North region). The Theil-Sen median trend method combined with the Mann-Kendall test was used to analyze the spatial-temporal variation trend of eco-environmental quality, and the Hurst exponent and the Theil-Sen median trend were superimposed to predict the future evolution trend of eco-environmental quality. In addition, ten variables from two categories of natural and anthropogenic factors were analyzed to determine the drivers of the spatial differentiation of eco-environmental quality by the geographical detector. The results showed that from 2000 to 2020, the RSEI in the Three-North region exhibited obvious regional characteristics: the RSEI values in Northwest China were generally between 0.2 and 0.4; the RSEI values in North China gradually increased from north to south, ranging from 0.2 to 0.8; and the RSEI values in Northeast China were mostly above 0.6. The average RSEI value in the Three-North region increased at an average growth rate of 0.0016/a, showing the spatial distribution characteristics of overall improvement and local degradation in eco-environmental quality, of which the areas with improved, basically stable and degraded eco-environmental quality accounted for 65.39%, 26.82% and 7.79% of the total study area, respectively. The Hurst exponent of the RSEI ranged from 0.20 to 0.76 and the future trend of eco-environmental quality was generally consistent with the trend over the past 21 years. However, the areas exhibiting an improvement trend in eco-environmental quality mainly had weak persistence, and there was a possibility of degradation in eco-environmental quality without strengthening ecological protection. Average relative humidity, accumulated precipitation and land use type were the dominant factors driving the spatial distribution of eco-environmental quality in the Three-North region, and two-factor interaction also had a greater influence on eco-environmental quality than single factors. The explanatory power of meteorological factors on the spatial distribution of eco-environmental quality was stronger than that of topographic factors. The effect of anthropogenic factors (such as population density and land use type) on eco-environmental quality gradually increased over time. This study can serve as a reference to protect the ecological environment in arid and semi-arid regions.
|
|
Received: 07 July 2022
Published: 31 March 2023
|
|
Corresponding Authors:
* SUN Hua (E-mail: sunhua@csuft.edu.cn)
|
|
|
| [1] |
Adrian J, Sagan V, Maimaitijiang M. 2021. Sentinel SAR-optical fusion for crop type mapping using deep learning and Google Earth Engine. ISPRS Journal of Photogrammetry and Remote Sensing, 175: 215-235.
doi: 10.1016/j.isprsjprs.2021.02.018
|
|
|
| [2] |
Al-Quraishi A M F, Gaznayee H A, Crespi M. 2021. Drought trend analysis in a semi-arid area of Iraq based on Normalized Difference Vegetation Index, Normalized Difference Water Index and Standardized Precipitation Index. Journal of Arid Land, 13(4): 413-430.
doi: 10.1007/s40333-021-0062-9
|
|
|
| [3] |
Arshad S, Ahmad S R, Abbas S, et al. 2022. Quantifying the contribution of diminishing green spaces and urban sprawl to urban heat island effect in a rapidly urbanizing metropolitan city of Pakistan. Land Use Policy, 113: 105874, doi: 10.1016/j.landusepol.2021.105874.
doi: 10.1016/j.landusepol.2021.105874
|
|
|
| [4] |
Cao S X, Suo X H, Xia C Q. 2020. Payoff from afforestation under the Three-North Shelter Forest Program. Journal of Cleaner Production, 256(C): 120461, doi: 10.1016/j.jclepro.2020.120461.
doi: 10.1016/j.jclepro.2020.120461
|
|
|
| [5] |
Chun X, Yong M, Liu J Y, et al. 2018. Monitoring land cover change and its dynamic mechanism on the Qehan Lake Basin, Inner Mongolia, North China, during 1977-2013. Environmental Monitoring and Assessment, 190(4): 205, doi: 10.1007/s10661-018-6582-x.
doi: 10.1007/s10661-018-6582-x
|
|
|
| [6] |
Dai X A, Gao Y, He X W, et al. 2020. Spatial-temporal pattern evolution and driving force analysis of ecological environment vulnerability in Panzhihua City. Environmental Science and Pollution Research International, 28(6): 7151-7166.
doi: 10.1007/s11356-020-11013-6
|
|
|
| [7] |
Deng C L, Zhang B Q, Cheng L Y, et al. 2019. Vegetation dynamics and their effects on surface water-energy balance over the Three-North Region of China. Agricultural and Forest Meteorology, 275: 79-90.
doi: 10.1016/j.agrformet.2019.05.012
|
|
|
| [8] |
Deng Y, Jiang W G, Wang W J, et al. 2018. Urban expansion led to the degradation of habitat quality in the Beijing-Tianjin-Hebei Area. Acta Ecologica Sinica, 38(12): 4516-4525. (in Chinese)
|
|
|
| [9] |
Duan H C, Yan C Z, Tsunekawa A, et al. 2011. Assessing vegetation dynamics in the Three-North Shelter Forest region of China using AVHRR NDVI data. Environmental Earth Sciences, 64(4): 1011-1020.
doi: 10.1007/s12665-011-0919-x
|
|
|
| [10] |
Erasmi S, Klinge M, Dulamsuren C. 2021. Modelling the productivity of Siberian larch forests from Landsat NDVI time series in fragmented forest stands of the Mongolian forest-steppe. Environmental Monitoring and Assessment, 193(4): 200, doi: 10.1007/S10661-021-08996-1.
doi: 10.1007/s10661-021-08996-1
pmid: 33738573
|
|
|
| [11] |
Floreano I X, de Moraes L A F. 2021. Land use/land cover (LULC) analysis (2009-2019) with Google Earth Engine and 2030 prediction using Markov-CA in the Rondônia State, Brazil. Environmental Monitoring and Assessment, 193(4): 239, doi: 10.1007/s10661-021-09016-y.
doi: 10.1007/s10661-021-09016-y
pmid: 33783626
|
|
|
| [12] |
Gao P W, Kasimu A, Zhao Y Y, et al. 2020. Evaluation of the temporal and spatial changes of ecological quality in the Hami Oasis based on RSEI. Sustainability, 12(18): 7716, doi: 10.3390/su12187716.
doi: 10.3390/su12187716
|
|
|
| [13] |
Gorelick N, Hancher M, Dixon M, et al. 2017. Google Earth Engine: Planetary-scale geospatial analysis for everyone. Remote Sensing of Environment, 202: 18-27.
doi: 10.1016/j.rse.2017.06.031
|
|
|
| [14] |
Hong J H, Su Z L T, Lu E H C. 2020. Spatial perspectives toward the recommendation of remote sensing images using the INDEX indicator, based on principal component analysis. Remote Sensing, 12(8): 1277, doi: 10.3390/rs12081277.
doi: 10.3390/rs12081277
|
|
|
| [15] |
Hu L, Fan W J, Yuan W P, et al. 2021. Spatiotemporal variation of vegetation productivity and its feedback to climate change in Northeast China over the last 30 years. Remote Sensing, 13(5): 951, doi: 10.3390/rs13050951.
doi: 10.3390/rs13050951
|
|
|
| [16] |
Hu X S, Xu H Q. 2018. A new remote sensing index for assessing the spatial heterogeneity in urban ecological quality: A case from Fuzhou City, China. Ecological Indicators, 89: 11-21.
doi: 10.1016/j.ecolind.2018.02.006
|
|
|
| [17] |
Huang H P, Chen W, Zhang Y, et al. 2021. Analysis of ecological quality in Lhasa metropolitan area during 199-2017 based on remote sensing and Google Earth Engine platform. Journal of Geographical Sciences, 31(2): 265-280.
doi: 10.1007/s11442-021-1846-8
|
|
|
| [18] |
Ji J W, Wang S X, Zhou Y, et al. 2020. Spatiotemporal change and landscape pattern variation of eco-environmental quality in Jing-Jin-Ji urban agglomeration from 2001 to 2015. IEEE Access, 8: 125534-125548.
doi: 10.1109/Access.6287639
|
|
|
| [19] |
Ji J W, Tang Z Z, Zhang W W, et al. 2022. Spatiotemporal and multiscale analysis of the coupling coordination degree between economic development equality and eco-environmental quality in China from 2001 to 2020. Remote Sensing, 14(3): 737, doi: 10.3390/rs14030737.
doi: 10.3390/rs14030737
|
|
|
| [20] |
Jiang F G, Deng M L, Long Y, et al. 2022. Spatial pattern and dynamic change of vegetation greenness from 2001 to 2020 in Tibet, China. Frontiers in Plant Science, 13: 892625, doi: 10.3389/fpls.2022.892625.
doi: 10.3389/fpls.2022.892625
|
|
|
| [21] |
Jiang L G, Liu Y, Wu S, et al. 2021. Analyzing ecological environment change and associated driving factors in China based on NDVI time series data. Ecological Indicators, 129: 107933, doi: 10.1016/j.ecolind.2021.107933.
doi: 10.1016/j.ecolind.2021.107933
|
|
|
| [22] |
Jiang W G, Yuan L H, Wang W J, et al. 2015. Spatio-temporal analysis of vegetation variation in the Yellow River Basin. Ecological Indicators, 51: 117-126.
doi: 10.1016/j.ecolind.2014.07.031
|
|
|
| [23] |
Kutner M H, Nachtsheim C J, Neter J, et al. 2004. Applied Linear Statistical Models (5th ed.). Chicago: McGraw-Hill/Irwin, 1316.
|
|
|
| [24] |
Lee P S H, Park J. 2020. An effect of urban forest on urban thermal environment in Seoul, South Korea, based on Landsat imagery analysis. Forests, 11(6): 630, doi: 10.3390/f11060630.
doi: 10.3390/f11060630
|
|
|
| [25] |
Li C, Li X M, Luo D L, et al. 2021a. Spatiotemporal pattern of vegetation ecology quality and its response to climate change between 2000-2017 in China. Sustainability, 13(3): 1419, doi: 10.3390/su13031419.
doi: 10.3390/su13031419
|
|
|
| [26] |
Li J, Wang J L, Zhang J, et al. 2021b. Dynamic changes of vegetation coverage in China-Myanmar economic corridor over the past 20 years. International Journal of Applied Earth Observations and Geoinformation, 102: 102378, doi: 10.1016/j.jag.2021.102378.
doi: 10.1016/j.jag.2021.102378
|
|
|
| [27] |
Li S D, Feng D Q. 2021. World famous ecological project—Three North Shelterbelt System Construction Project in China. Zhejiang Forestry, (9): 9-11. (in Chinese)
|
|
|
| [28] |
Liao W H, Jiang W G, 2020. Evaluation of the spatiotemporal variations in the eco-environmental quality in China based on the remote sensing ecological index. Remote Sensing, 12(15): 2462, doi: 10.3390/rs12152462.
doi: 10.3390/rs12152462
|
|
|
| [29] |
Liu H, Li X J, Mao F J, et al. 2021. Spatiotemporal evolution of fractional vegetation cover and its response to climate change based on MODIS data in the subtropical region of China. Remote Sensing, 13(5): 913, doi: 10.3390/rs13050913.
doi: 10.3390/rs13050913
|
|
|
| [30] |
Liu J Y, Zhang Z X, Xu X L, et al. 2010. Spatial patterns and driving forces of land use change in China during the early 21st century. Journal of Geographical Sciences, 20(4): 483-494.
doi: 10.1007/s11442-010-0483-4
|
|
|
| [31] |
Lu F, Hu H F, Sun W J, et al. 2018. Effects of national ecological restoration projects on carbon sequestration in China from 2001 to 2010. Proceedings of the National Academy of Sciences of the United States of America, 115(16): 4039-4044.
|
|
|
| [32] |
Mishra V K, Pant T. 2020. Open surface water index: a novel approach for surface water mapping and extraction using multispectral and multisensory data. Remote Sensing Letters, 11(11): 973-982.
doi: 10.1080/2150704X.2020.1804085
|
|
|
| [33] |
Nietupski T C, Kennedy R E, Temesgen H, et al. 2021. Spatiotemporal image fusion in Google Earth Engine for annual estimates of land surface phenology in a heterogenous landscape. International Journal of Applied Earth Observations and Geoinformation, 99: 102323, doi: 10.1016/j.jag.2021.102323.
doi: 10.1016/j.jag.2021.102323
|
|
|
| [34] |
Pekel J F, Cottam A, Gorelick N, et al. 2016. High-resolution mapping of global surface water and its long-term changes. Nature, 540(7633): 418-422.
doi: 10.1038/nature20584
|
|
|
| [35] |
Rivas-Tabares D A, Saa-Requejo A, Martín-Sotoca J J. 2021. Multiscaling NDVI series analysis of rainfed cereal in Central Spain. Remote Sensing, 13(4): 568, doi: 10.3390/rs13040568.
doi: 10.3390/rs13040568
|
|
|
| [36] |
Saleh S K, Amoushahi S, Gholipour M. 2021. Spatiotemporal ecological quality assessment of metropolitan cities: a case study of central Iran. Environmental Monitoring and Assessment, 193(5): 305, doi: 10.1007/s10661-021-09082-2.
doi: 10.1007/s10661-021-09082-2
pmid: 33900465
|
|
|
| [37] |
Shan W, Jin X B, Ren J, et al. 2019. Ecological environment quality assessment based on remote sensing data for land consolidation. Journal of Cleaner Production, 239(C): 118126, doi: 10.1016/j.jclepro.2019.118126.
doi: 10.1016/j.jclepro.2019.118126
|
|
|
| [38] |
Su Y, Li T X, Cheng S K, et al. 2020. Spatial distribution exploration and driving factor identification for soil salinisation based on geodetector models in coastal area. Ecological Engineering, 156: 105961, doi: 10.1016/j.ecoleng.2020.105961.
doi: 10.1016/j.ecoleng.2020.105961
|
|
|
| [39] |
Sun C J, Li X M, Zhang W Q, et al. 2020. Evolution of ecological security in the Tableland Region of the Chinese Loess Plateau using a remote-sensing-based index. Sustainability, 12(8): 3489, doi: 10.3390/su12083489.
doi: 10.3390/su12083489
|
|
|
| [40] |
Venkatappa M, Sasaki N, Han P, et al. 2021. Impacts of droughts and floods on croplands and crop production in Southeast Asia - An application of Google Earth Engine. Science of the Total Environment, 795: 148829, doi: 10.1016/J.SCITOTENV.2021.148829.
doi: 10.1016/J.SCITOTENV.2021.148829
|
|
|
| [41] |
Wang C L, Jiang Q O, Deng X Z, et al. 2020. Spatio-temporal evolution, future trend and phenology regularity of net primary productivity of forests in Northeast China. Remote Sensing, 12(21): 3670, doi: 10.3390/rs12213670.
doi: 10.3390/rs12213670
|
|
|
| [42] |
Wang H N, Zhang M Y, Cui L J, et al. 2019. Evaluation of ecological environment quality of Hengshui Lake Wetlands based on DPSIR model. Wetland Science, 17(2): 193-198. (in Chinese)
|
|
|
| [43] |
Wang J F, Li X H, Christakos G, et al. 2010. Geographical detectors-based health risk assessment and its application in the neural tube defects study of the Heshun Region, China. International Journal of Geographical Information Science, 24(1): 107-27.
doi: 10.1080/13658810802443457
|
|
|
| [44] |
Wang J F, Hu Y. 2012. Environmental health risk detection with GeogDetector. Environmental Modelling and Software, 33: 114-115.
doi: 10.1016/j.envsoft.2012.01.015
|
|
|
| [45] |
Wen X L, Ming Y L, Gao Y G, et al. 2019. Dynamic monitoring and analysis of ecological quality of Pingtan Comprehensive Experimental Zone, a new type of Sea Island City, based on RSEI. Sustainability, 12(1): 21, doi: 10.3390/su12010021.
doi: 10.3390/su12010021
|
|
|
| [46] |
Xie B N, Jia X X, Qin Z F, et al. 2016. Vegetation dynamics and climate change on the Loess Plateau, China: 1982-2011. Regional Environmental Change, 16(6): 1583-1594.
doi: 10.1007/s10113-015-0881-3
|
|
|
| [47] |
Xiong Y, Xu W H, Lu N, et al. 2021. Assessment of spatial-temporal changes of ecological environment quality based on RSEI and GEE: A case study in Erhai Lake Basin, Yunnan province, China. Ecological Indicators, 125: 107518, doi: 10.1016/J.ECOLIND.2021.107518.
doi: 10.1016/J.ECOLIND.2021.107518
|
|
|
| [48] |
Xu D, Yang F, Yu L, et al. 2021. Quantization of the coupling mechanism between eco-environmental quality and urbanization from multisource remote sensing data. Journal of Cleaner Production, 321: 128948, doi: 10.1016/J.JCLEPRO.2021.128948.
doi: 10.1016/J.JCLEPRO.2021.128948
|
|
|
| [49] |
Xu H Q, Wang M Y, Shi T T, et al. 2018. Prediction of ecological effects of potential population and impervious surface increases using a remote sensing based ecological index (RSEI). Ecological Indicators, 93: 730-740.
doi: 10.1016/j.ecolind.2018.05.055
|
|
|
| [50] |
Xu H Q, Wang Y F, Guan H D, et al. 2019. Detecting ecological changes with a remote sensing based ecological index (RSEI) produced time series and change vector analysis. Remote Sensing, 11(20): 2354, doi: 10.3390/rs11202345.
doi: 10.3390/rs11202345
|
|
|
| [51] |
Xu K P, Chi Y Y, Wang J J, et al. 2020. Analysis of the spatial characteristics and driving forces determining ecosystem quality of the Beijing-Tianjin-Hebei region. Environmental Science and Pollution Research International, 28(10): 12555-12565.
doi: 10.1007/s11356-020-11146-8
|
|
|
| [52] |
Yuan B D, Fu L N, Zou Y A, et al. 2021. Spatiotemporal change detection of ecological quality and the associated affecting factors in Dongting Lake Basin, based on RSEI. Journal of Cleaner Production, 302: 126995, doi: 10.1016/J.JCLEPRO.2021.126995.
doi: 10.1016/J.JCLEPRO.2021.126995
|
|
|
| [53] |
Zhang D, Huang Q X, He C Y, et al. 2017. Impacts of urban expansion on ecosystem services in the Beijing-Tianjin-Hebei urban agglomeration, China: A scenario analysis based on the Shared Socioeconomic Pathways. Resources, Conservation & Recycling, 125: 115-130.
|
|
|
| [54] |
Zhang D N, Zuo X X, Zang C F. 2021a. Assessment of future potential carbon sequestration and water consumption in the construction area of the Three-North Shelterbelt Programme in China. Agricultural and Forest Meteorology, 303: 108377, doi: 10.1016/J.AGRFORMET.2021.108377.
doi: 10.1016/J.AGRFORMET.2021.108377
|
|
|
| [55] |
Zhang W Q, Jin H A, Shao H Y, et al. 2021b. Temporal and spatial variations in the leaf area index and its response to topography in the Three-River Source Region, China from 2000 to 2017. ISPRS International Journal of Geo-Information, 10(1): 33, doi: 10.3390/IJGI10010033.
doi: 10.3390/IJGI10010033
|
|
|
| [56] |
Zheng X, Zhu J J. 2017. A new climatic classification of afforestation in Three-North regions of China with multi-source remote sensing data. Theoretical and Applied Climatology, 127(1-2): 465-480.
doi: 10.1007/s00704-015-1646-0
|
|
|
| [57] |
Zheng Z H, Wu Z F, Chen Y B, et al. 2020. Exploration of eco-environment and urbanization changes in coastal zones: A case study in China over the past 20 years. Ecological Indicators, 119: 106847, doi: 10.1016/j.ecolind.2020.106847.
doi: 10.1016/j.ecolind.2020.106847
|
|
|
| [58] |
Zheng Z H, Wu Z F, Chen Y B, et al. 2022. Instability of remote sensing based ecological index (RSEI) and its improvement for time series analysis. Science of The Total Environment, 814: 152595, doi: 10.1016/J.SCITOTENV.2021.152595.
doi: 10.1016/J.SCITOTENV.2021.152595
|
|
|
| [59] |
Zhong L, Liu X S, Yang P. 2020. Regional development gap assessment method based on remote sensing images and weighted Theil index. Arabian Journal of Geosciences, 13(22): 1176, doi: 10.1007/s12517-020-06043-w.
doi: 10.1007/s12517-020-06043-w
|
|
|
| [60] |
Zhou J, Liu W. 2022. Monitoring and evaluation of eco-environment quality based on remote sensing-based ecological index (RSEI) in Taihu Lake Basin, China. Sustainability, 14(9): 5642, doi: 10.3390/su14095642.
doi: 10.3390/su14095642
|
|
|
| [61] |
Zhou Z Y, Wang X Q, Ding Z, et al. 2020. Remote sensing analysis of ecological quality change in Xinjiang. Acta Ecologica Sinica, 40(9): 2907-2919. (in Chinese)
|
|
|
|
Viewed |
|
|
|
Full text
|
|
|
|
|
Abstract
|
|
|
|
|
Cited |
|
|
|
|
| |
Shared |
|
|
|
|
| |
Discussed |
|
|
|
|