| Research article |
|

|
|
|
| Monitoring vegetation drought in the nine major river basins of China based on a new developed Vegetation Drought Condition Index |
ZHAO Lili1, LI Lusheng1,*( ), LI Yanbin1, ZHONG Huayu2, ZHANG Fang3, ZHU Junzhen3, DING Yibo4 ), LI Yanbin1, ZHONG Huayu2, ZHANG Fang3, ZHU Junzhen3, DING Yibo4 |
1School of Water Conservancy, North China University of Water Resources and Electric Power, Zhengzhou 450046, China
2College of Water Conservancy and Hydropower Engineering, Hohai University, Nanjing 210098, China
3University International College, Macau University of Science and Technology, Macao 999078, China
4Yellow River Engineering Consulting Co., Ltd., Zhengzhou 450003, China |
|
|
|
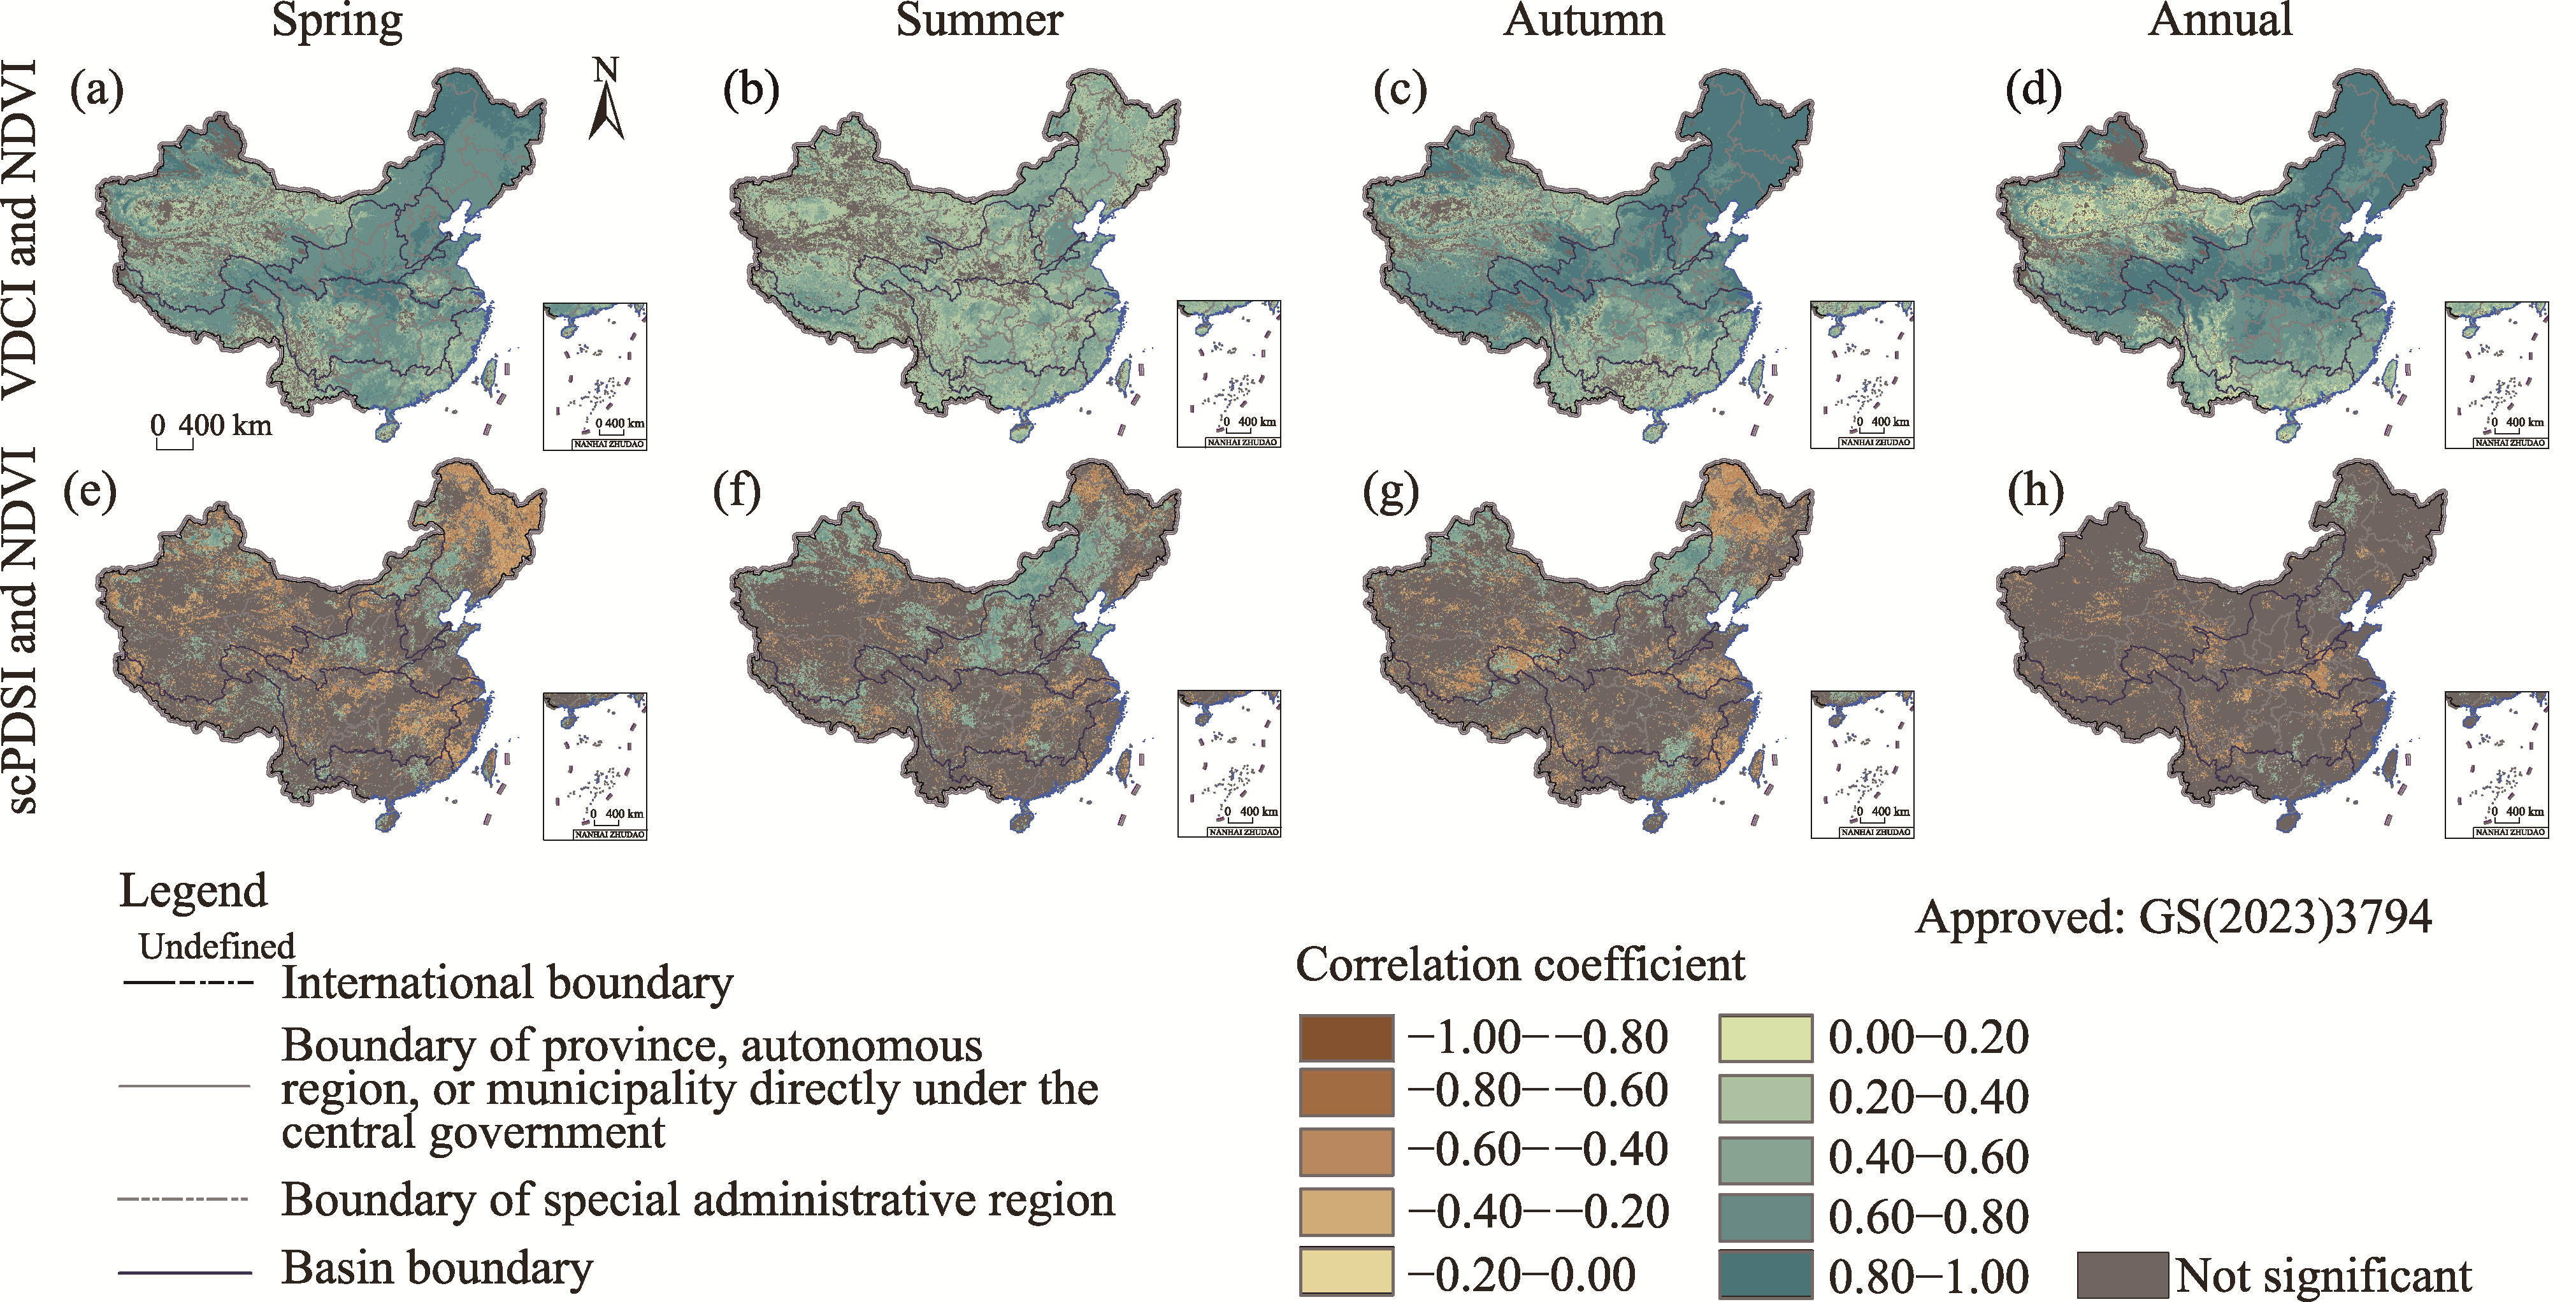
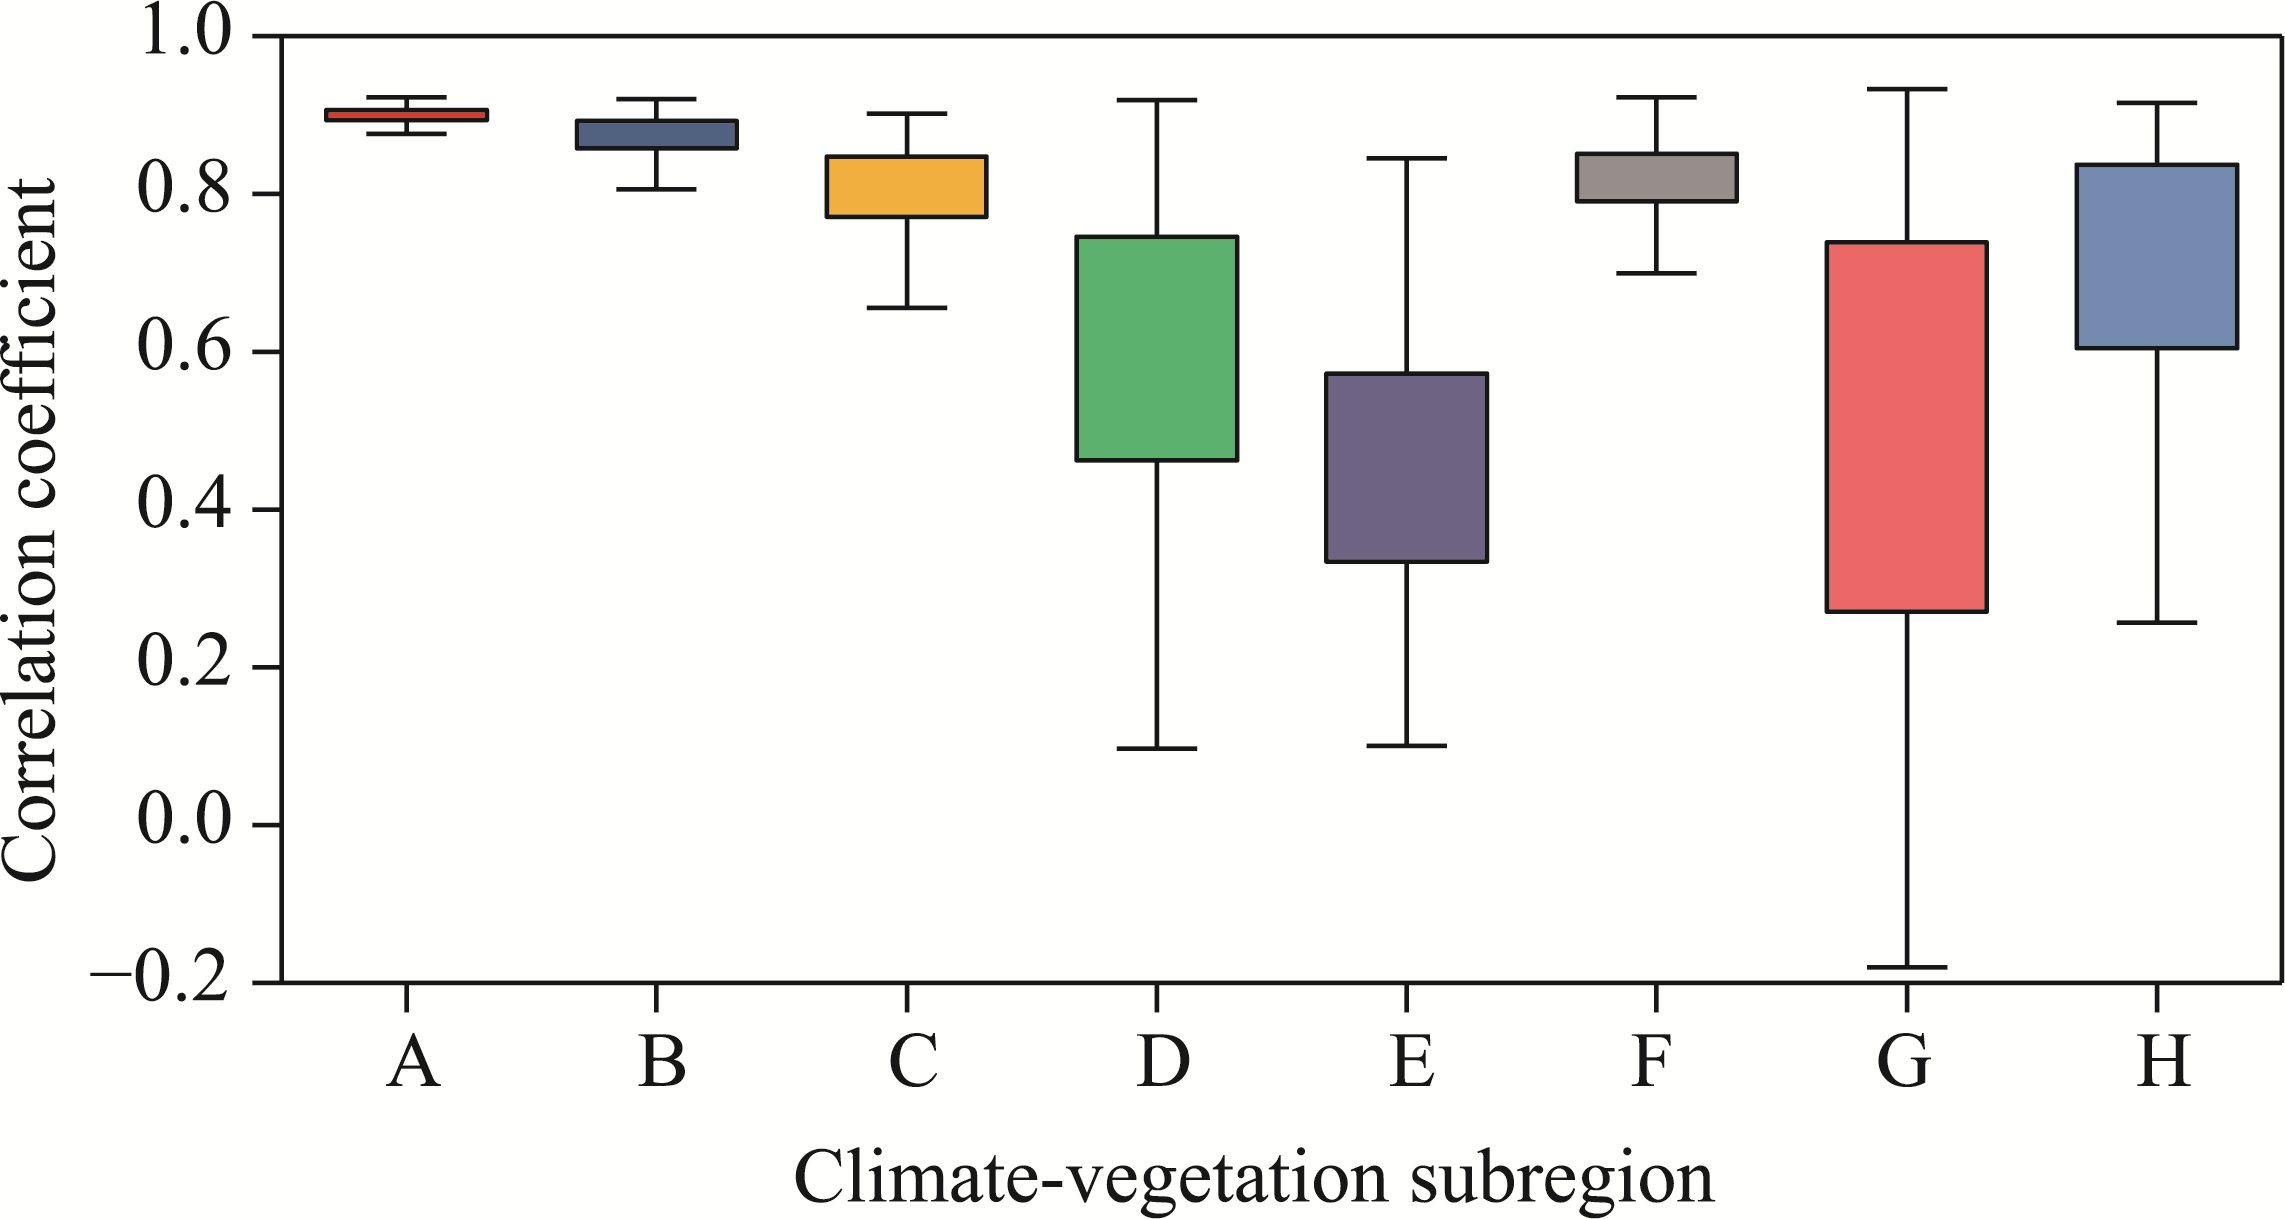
Abstract The effect of global climate change on vegetation growth is variable. Timely and effective monitoring of vegetation drought is crucial for understanding its dynamics and mitigation, and even regional protection of ecological environments. In this study, we constructed a new drought index (i.e., Vegetation Drought Condition Index (VDCI)) based on precipitation, potential evapotranspiration, soil moisture and Normalized Difference Vegetation Index (NDVI) data, to monitor vegetation drought in the nine major river basins (including the Songhua River and Liaohe River Basin, Haihe River Basin, Yellow River Basin, Huaihe River Basin, Yangtze River Basin, Southeast River Basin, Pearl River Basin, Southwest River Basin and Continental River Basin) in China at 1-month-12-month (T1-T12) time scales. We used the Pearson's correlation coefficients to assess the relationships between the drought indices (the developed VDCI and traditional drought indices including the Standardized Precipitation Evapotranspiration Index (SPEI), Standardized Soil Moisture Index (SSMI) and Self-calibrating Palmer Drought Severity Index (scPDSI)) and the NDVI at T1-T12 time scales, and to estimate and compare the lag times of vegetation response to drought among different drought indices. The results showed that precipitation and potential evapotranspiration have positive and major influences on vegetation in the nine major river basins at T1-T6 time scales. Soil moisture shows a lower degree of negative influence on vegetation in different river basins at multiple time scales. Potential evapotranspiration shows a higher degree of positive influence on vegetation, and it acts as the primary influencing factor with higher area proportion at multiple time scales in different river basins. The VDCI has a stronger relationship with the NDVI in the Songhua River and Liaohe River Basin, Haihe River Basin, Yellow River Basin, Huaihe River Basin and Yangtze River Basin at T1-T4 time scales. In general, the VDCI is more sensitive (with shorter lag time of vegetation response to drought) than the traditional drought indices (SPEI, scPDSI and SSMI) in monitoring vegetation drought, and thus it could be applied to monitor short-term vegetation drought. The VDCI developed in the study can reveal the law of unclear mechanisms between vegetation and climate, and can be applied in other fields of vegetation drought monitoring with complex mechanisms.
|
|
Received: 07 February 2023
Published: 31 December 2023
|
Corresponding Authors:
*LI Lusheng (E-mail: lilusheng@ncwu.edu.cn)
|
|
|
| [1] |
Allen R G, Pruitt W O, Wright J L, et al. 2006. A recommendation on standardized surface resistance for hourly calculation of reference ETo by the FAO 56 Penman-Monteith method. Agricultural Water Management, 81(1-2): 1-22.
doi: 10.1016/j.agwat.2005.03.007
|
|
|
| [2] |
Asadi Zarch M A, Sivakumar B, Sharma A. 2015. Droughts in a warming climate: A global assessment of Standardized precipitation index (SPI) and Reconnaissance drought index (RDI). Journal of Hydrology, 526: 183-195.
doi: 10.1016/j.jhydrol.2014.09.071
|
|
|
| [3] |
Asse D, Chuine J, Vitasse Y, et al. 2018. Warmer winters reduce the advance of tree spring phenology induced by warmer springs in the Alps. Agricultural and Forest Meteorology, 252: 220-230.
doi: 10.1016/j.agrformet.2018.01.030
|
|
|
| [4] |
Bento V A, Gouveia C M, DaCamara C C, et al. 2018. A climatological assessment of drought impact on vegetation health index. Agricultural and Forest Meteorology, 259: 286-295.
doi: 10.1016/j.agrformet.2018.05.014
|
|
|
| [5] |
Bouaziz M, Medhioub E, Csaplovisc E. 2021. A machine learning model for drought tracking and forecasting using remote precipitation data and a standardized precipitation index from arid regions. Journal of Arid Environments, 189: 104478, doi: 10.1016/j.jaridenv.2021.104478.
|
|
|
| [6] |
Coumou D, Rahmstorf S. 2012. A decade of weather extremes. Nature Climate Change, 2(7): 491-496.
doi: 10.1038/nclimate1452
|
|
|
| [7] |
Dayon G, Boé J, Martin É, et al. 2018. Impacts of climate change on the hydrological cycle over France and associated uncertainties. Comptes Rendus Geoscience, 350(4): 141-153.
doi: 10.1016/j.crte.2018.03.001
|
|
|
| [8] |
Di Curzio D, Castrignano A, Fountas S, et al. 2021. Multi-source data fusion of big spatial-temporal data in soil, geo-engineering and environmental studies. Science of the Total Environment, 788: 147842, doi: 10.1016/j.scitotenv.2021.147842.
|
|
|
| [9] |
Ding Y B, Xu J T, Wang X W, et al. 2020. Spatial and temporal effects of drought on Chinese vegetation under different coverage levels. Science of the Total Environment, 716: 137166, doi: 10.1016/j.scitotenv.2020.137166.
|
|
|
| [10] |
Ding Y B, Gong X L, Xing Z X, et al. 2021a. Attribution of meteorological, hydrological and agricultural drought propagation in different climatic regions of China. Agricultural Water Management, 255: 106996, doi: 10.1016/j.agwat.2021.106996.
|
|
|
| [11] |
Ding Y B, Xu J T, Wang X W, et al. 2021b. Propagation of meteorological to hydrological drought for different climate regions in China. Journal of Environmental Management, 283: 111980, doi: 10.1016/j.jenvman.2021.111980.
|
|
|
| [12] |
Fan J L, McConkey B, Wang H, et al. 2016a. Root distribution by depth for temperate agricultural crops. Field Crops Research, 189: 68-74.
doi: 10.1016/j.fcr.2016.02.013
|
|
|
| [13] |
Fan X W, Liu Y B. 2016b. A global study of NDVI difference among moderate-resolution satellite sensors. ISPRS Journal of Photogrammetry and Remote Sensing, 121: 177-191.
doi: 10.1016/j.isprsjprs.2016.09.008
|
|
|
| [14] |
Fensholt R, Proud S R. 2012. Evaluation of Earth Observation based global long term vegetation trends—Comparing GIMMS and MODIS global NDVI time series. Remote Sensing of Environment, 119: 131-147.
doi: 10.1016/j.rse.2011.12.015
|
|
|
| [15] |
Gitelson A, Arkebauer T, Viña A, et al. 2021. Evaluating plant photosynthetic traits via absorption coefficient in the photosynthetically active radiation region. Remote Sensing of Environment, 258: 112401, doi: 10.1016/j.rse.2021.112401.
|
|
|
| [16] |
Gleeson T, Wada Y, Bierkens M F P, et al. 2012. Water balance of global aquifers revealed by groundwater footprint. Nature, 488(7410): 197-200.
doi: 10.1038/nature11295
|
|
|
| [17] |
Gong G, Mattevada S, O'Bryant S E. 2014. Comparison of the accuracy of kriging and IDW interpolations in estimating groundwater arsenic concentrations in Texas. Environmental Research, 130: 59-69.
doi: 10.1016/j.envres.2013.12.005
pmid: 24559533
|
|
|
| [18] |
Gong X L, Du S P, Li F Y, et al. 2021. Study of mesoscale NDVI prediction models in arid and semiarid regions of China under changing environments. Ecological Indicators, 131: 108198, doi: 10.1016/j.ecolind.2021.108198.
|
|
|
| [19] |
Guo C L, Tang Y N, Lu J S, et al. 2019a. Predicting wheat productivity: Integrating time series of vegetation indices into crop modeling via sequential assimilation. Agricultural and Forest Meteorology, 272-273: 69-80.
doi: 10.1016/j.agrformet.2019.01.023
|
|
|
| [20] |
Guo H, Bao A M, Liu T, et al. 2019b. Determining variable weights for an Optimal Scaled Drought Condition Index (OSDCI): Evaluation in Central Asia. Remote Sensing of Environment, 231: 111220, doi: 10.1016/j.rse.2019.111220.
|
|
|
| [21] |
He Y Q, Lee E, Warner T A. 2017. A time series of annual land use and land cover maps of China from 1982 to 2013 generated using AVHRR GIMMS NDVI3g data. Remote Sensing of Environment, 199: 201-217.
doi: 10.1016/j.rse.2017.07.010
|
|
|
| [22] |
Heo J H, Kho Y W, Shin H J, et al. 2008. Regression equations of probability plot correlation coefficient test statistics from several probability distributions. Journal of Hydrology, 355(1-4): 1-15.
doi: 10.1016/j.jhydrol.2008.01.027
|
|
|
| [23] |
Huang S Z, Ming B, Huang Q, et al. 2017. A case study on a combination NDVI forecasting model based on the entropy weight method. Water Resources Management, 31(11): 3667-3681.
doi: 10.1007/s11269-017-1692-8
|
|
|
| [24] |
Jeong S J, Schimel D, Frankenberg C, et al. 2017. Application of satellite solar-induced chlorophyll fluorescence to understanding large-scale variations in vegetation phenology and function over northern high latitude forests. Remote Sensing of Environment, 190: 178-187.
doi: 10.1016/j.rse.2016.11.021
|
|
|
| [25] |
Lakshmi V, Fayne J, Bolten J. 2018. A comparative study of available water in the major river basins of the world. Journal of Hydrology, 567: 510-532.
doi: 10.1016/j.jhydrol.2018.10.038
pmid: 32020949
|
|
|
| [26] |
Leng G Y, Tang Q H, Rayburg S. 2015. Climate change impacts on meteorological, agricultural and hydrological droughts in China. Global and Planetary Change, 126: 23-34.
doi: 10.1016/j.gloplacha.2015.01.003
|
|
|
| [27] |
Li R H, Chen N C, Zhang X, et al. 2020. Quantitative analysis of agricultural drought propagation process in the Yangtze River Basin by using cross wavelet analysis and spatial autocorrelation. Agricultural and Forest Meteorology, 280: 107809, doi: 10.1016/j.agrformet.2019.107809.
|
|
|
| [28] |
Luo M, Meng F H, Sa C L, et al. 2021. Response of vegetation phenology to soil moisture dynamics in the Mongolian Plateau. CATENA, 206: 105505, doi: 10.1016/j.catena.2021.105505.
|
|
|
| [29] |
Ma B, Zhang B, Jia L G, et al. 2020. Conditional distribution selection for SPEI-daily and its revealed meteorological drought characteristics in China from 1961 to 2017. Atmospheric Research, 246: 105108, doi: 10.1016/j.atmosres.2020.105108.
|
|
|
| [30] |
Mishra A K, Singh V P. 2010. A review of drought concepts. Journal of Hydrology, 391(1-2): 202-216.
doi: 10.1016/j.jhydrol.2010.07.012
|
|
|
| [31] |
Nguyen M N, Hao Y F, Baik J, et al. 2021. Partitioning evapotranspiration based on the total ecosystem conductance fractions of soil, interception, and canopy in different biomes. Journal of Hydrology, 603: 126970, doi: 10.1016/j.jhydrol.2021.126970.
|
|
|
| [32] |
Pascolini-Campbell M, Reager J, Chandanpurkar H A, et al. 2021. A 10 percent increase in global land evapotranspiration from 2003 to 2019. Nature, 593(7860): 543-547.
doi: 10.1038/s41586-021-03503-5
|
|
|
| [33] |
Pinzon J E, Tucker C J. 2014. A non-stationary 1981-2012 AVHRR NDVI3g time series. Remote Sensing, 6(8): 6929-6960.
doi: 10.3390/rs6086929
|
|
|
| [34] |
Rhee J, Im J, Carbone G J. 2010. Monitoring agricultural drought for arid and humid regions using multi-sensor remote sensing data. Remote Sensing of Environment, 114(12): 2875-2887.
doi: 10.1016/j.rse.2010.07.005
|
|
|
| [35] |
Sahaar S A, Niemann J D. 2020. Impact of regional characteristics on the estimation of root-zone soil moisture from the evaporative index or evaporative fraction. Agricultural Water Management, 238: 106225, doi: 10.1016/j.agwat.2020.106225.
|
|
|
| [36] |
Sattar M N, Kim T W. 2018. Probabilistic characteristics of lag time between meteorological and hydrological droughts using a Bayesian model. Terrestrial, Atmospheric and Oceanic Sciences, 29(6): 709-720.
doi: 10.3319/TAO.2018.07.01.01
|
|
|
| [37] |
Shi H Y, Chen J, Wang K Y, et al. 2018. A new method and a new index for identifying socioeconomic drought events under climate change: A case study of the East River basin in China. Science of the Total Environment, 616-617: 363-375.
doi: 10.1016/j.scitotenv.2017.10.321
|
|
|
| [38] |
Shi Y, Jin N, Ma X L, et al. 2020. Attribution of climate and human activities to vegetation change in China using machine learning techniques. Agricultural and Forest Meteorology, 294: 108146, doi: 10.1016/j.agrformet.2020.108146.
|
|
|
| [39] |
Vicente-Serrano S M, Gouveia C, Camarero J J, et al. 2013. Response of vegetation to drought time-scales across global land biomes. Proceedings of the National Academy of Sciences of the United States of America, 110(1): 52-57.
|
|
|
| [40] |
Wang Y Q, Yang J, Chen Y N, et al. 2020. Monitoring and predicting drought based on multiple indicators in an arid area, China. Remote Sensing, 12(14): 2298, doi: 10.3390/rs12142298.
|
|
|
| [41] |
Waqas M, Xue H G, Ahmad N, et al. 2021. Big data analytics as a roadmap towards green innovation, competitive advantage and environmental performance. Journal of Cleaner Production, 323: 128998, doi: 10.1016/j.jclepro.2021.128998.
|
|
|
| [42] |
Wells N, Goddard S, Hayes M J. 2004. A self-calibrating palmer drought severity index. Journal of Climate, 17(12): 2335-2351.
doi: 10.1175/1520-0442(2004)017<2335:ASPDSI>2.0.CO;2
|
|
|
| [43] |
Wu D, Li Z H, Zhu Y C, et al. 2021. A new agricultural drought index for monitoring the water stress of winter wheat. Agricultural Water Management, 244: 106599, doi: 10.1016/j.agwat.2020.106599.
|
|
|
| [44] |
Xu H J, Wang X P, Zhao C Y, et al. 2018. Diverse responses of vegetation growth to meteorological drought across climate zones and land biomes in northern China from 1981 to 2014. Agricultural and Forest Meteorology, 262: 1-13.
doi: 10.1016/j.agrformet.2018.06.027
|
|
|
| [45] |
Yang Y, Chen R S, Han C T, et al. 2021. Evaluation of 18 models for calculating potential evapotranspiration in different climatic zones of China. Agricultural Water Management, 244: 106545, doi: 10.1016/j.agwat.2020.106545.
|
|
|
| [46] |
Yao N, Li L C, Feng P Y, et al. 2020. Projections of drought characteristics in China based on a standardized precipitation and evapotranspiration index and multiple GCMs. Science of the Total Environment, 704: 135245, doi: 10.1016/j.scitotenv.2019.135245.
|
|
|
| [47] |
Ye W T, van Dijk A I J M, Huete A, et al. 2021. Global trends in vegetation seasonality in the GIMMS NDVI3g and their robustness. International Journal of Applied Earth Observation and Geoinformation, 94: 102238, doi: 10.1016/j.jag.2020.102238.
|
|
|
| [48] |
Yin Z J, Xu Y Y, Zhu X Y, et al. 2021. Variations of groundwater storage in different basins of China over recent decades. Journal of Hydrology, 598: 126282, doi: 10.1016/j.jhydrol.2021.126282.
|
|
|
| [49] |
Yu S X, Zhang N Y, Kaiser E, et al. 2021. Integrating chlorophyll fluorescence parameters into a crop model improves growth prediction under severe drought. Agricultural And Forest Meteorology, 303: 108367, doi: 10.1016/j.agrformet.2021.108367.
|
|
|
| [50] |
Zeng F W, Collatz G J, Pinzon J E, et al. 2013. Evaluating and quantifying the climate-driven interannual variability in Global Inventory Modeling and Mapping Studies (GIMMS) Normalized Difference Vegetation Index (NDVI3g) at global scales. Remote Sensing, 5(8): 3918-3950.
doi: 10.3390/rs5083918
|
|
|
| [51] |
Zhang B Q, Xia Y L, Huning L S, et al. 2019a. A framework for global multicategory and multiscalar drought characterization accounting for snow processes. Water Resources Research, 55(11): 9258-9278.
doi: 10.1029/2019WR025529
|
|
|
| [52] |
Zhang B Q, Tian L, Zhao X N, et al. 2021. Feedbacks between vegetation restoration and local precipitation over the Loess Plateau in China. Science China Earth Sciences, 64(6): 920-931.
doi: 10.1007/s11430-020-9751-8
|
|
|
| [53] |
Zhang X Y, Zhang B Q. 2019. The responses of natural vegetation dynamics to drought during the growing season across China. Journal of Hydrology, 574: 706-714.
doi: 10.1016/j.jhydrol.2019.04.084
|
|
|
| [54] |
Zhang Y J, Li G P, Ge J, et al. 2019b. sc_PDSI is more sensitive to precipitation than to reference evapotranspiration in China during the time period 1951-2015. Ecological Indicators, 96: 448-457.
doi: 10.1016/j.ecolind.2018.09.033
|
|
|
| [55] |
Zhao H G, Ma Y F. 2021. Effects of various driving factors on potential evapotranspiration trends over the main grain-production area of China while accounting for vegetation dynamics. Agricultural Water Management, 250: 106854, doi: 10.1016/j.agwat.2021.106854.
|
|
|
| [56] |
Zhou K, Wang Y M, Chang J X, et al. 2021a. Spatial and temporal evolution of drought characteristics across the Yellow River basin. Ecological Indicators, 131: 108207, doi: 10.1016/j.ecolind.2021.108207.
|
|
|
| [57] |
Zhou K K, Li J Z, Zhang T, et al. 2021b. The use of combined soil moisture data to characterize agricultural drought conditions and the relationship among different drought types in China. Agricultural Water Management, 243: 106479, doi: 10.1016/j.agwat.2020.106479.
|
|
|
| [58] |
Zhou Z Q, Ding Y B, Shi H Y, et al. 2020a. Analysis and prediction of vegetation dynamic changes in China: Past, present and future. Ecological Indicators, 117: 106642, doi: 10.1016/j.ecolind.2020.106642.
|
|
|
| [59] |
Zhou Z Q, Shi H Y, Fu Q, et al. 2020b. Is the cold region in Northeast China still getting warmer under climate change impact? Atmospheric Research, 237: 104864, doi: 10.1016/j.atmosres.2020.104864.
|
|
|
| [60] |
Zhou Z Q, Shi H Y, Fu Q, et al. 2021c. Characteristics of propagation from meteorological drought to hydrological drought in the Pearl River Basin. Journal of Geophysical Research Atmospheres, 126(4): e2020JD033959, doi: 10.1029/2020JD033959.
|
|
|
| [61] |
Zhu Y K, Zhang J T, Zhang Y Q, et al. 2019. Responses of vegetation to climatic variations in the desert region of northern China. CATENA, 175: 27-36.
doi: 10.1016/j.catena.2018.12.007
|
|
|
|
Viewed |
|
|
|
Full text
|
|
|
|
|
Abstract
|
|
|
|
|
Cited |
|
|
|
|
| |
Shared |
|
|
|
|
| |
Discussed |
|
|
|
|