| Research article |
|


|
|
|
| Variation of soil physical-chemical characteristics in salt-affected soil in the Qarhan Salt Lake, Qaidam Basin |
HUI Rong( ), TAN Huijuan, LI Xinrong, WANG bingyao ), TAN Huijuan, LI Xinrong, WANG bingyao |
| Shapotou Desert Research and Experiment Station, Northwest Institute of Eco-Environment and Resources, Chinese Academy of Sciences, Lanzhou 730000, China |
|
|
|
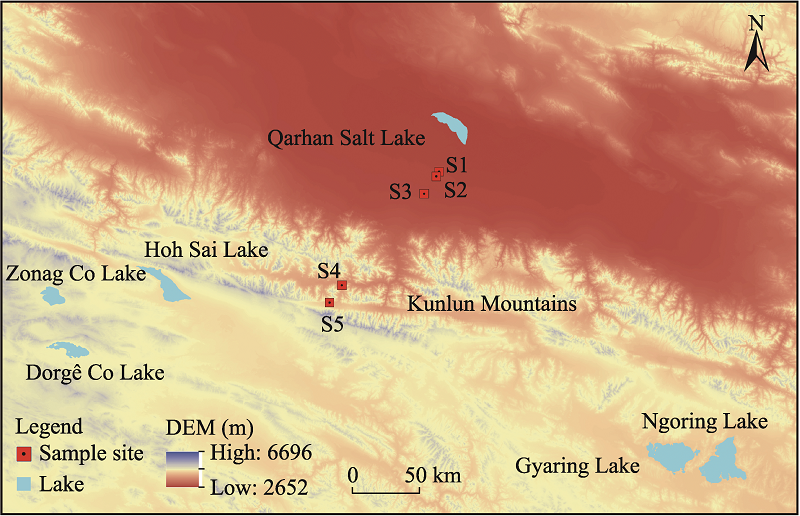
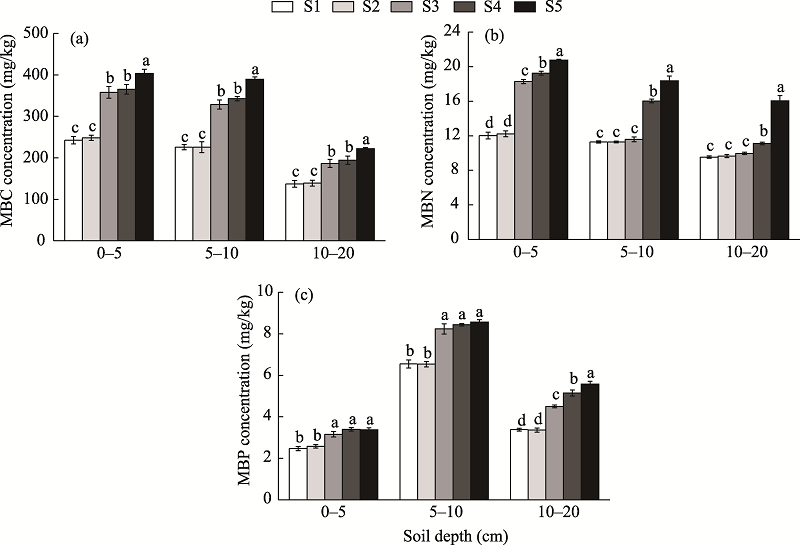
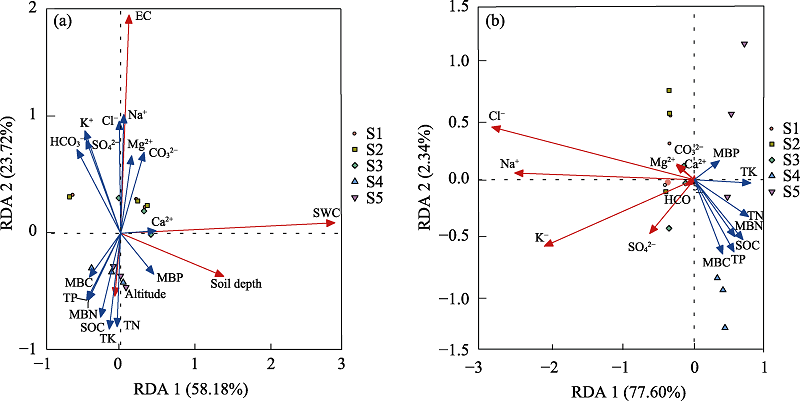
Abstract Soil salinization has adverse effects on the soil physical-chemical characteristics. However, little is known about the changes in soil salt ion concentrations and other soil physical-chemical characteristics within the Qarhan Salt Lake and at different soil depths in the surrounding areas. Here, we selected five sampling sites (S1, S2, S3, S4, and S5) alongside the Qarhan Salt Lake and in the Xidatan segment of the Kunlun Mountains to investigate the relationship among soil salt ion concentrations, soil physical-chemical characteristics, and environmental variables in April 2019. The results indicated that most sites had strongly saline and very strongly saline conditions. The main salt ions present in the soil were Na+, K+, and Cl-. Soil nutrients and soil microbial biomass (SMB) were significantly affected by the salinity (P<0.05). Moreover, soil salt ions (Na+, K+, Ca2+, Mg2+, Cl-, CO32-, SO42-, and HCO3-) were positively correlated with electrical conductivity (EC) and soil water content (SWC), but negatively related to altitude and soil depth. Unlike soil salt ions, soil nutrients and SMB were positively correlated with altitude, but negatively related to EC and SWC. Moreover, soil nutrients and SMB were negatively correlated with soil salt ions. In conclusion, soil nutrients and SMB were mainly influenced by salinity, and were related to altitude, soil depth, and SWC in the areas from the Qarhan Salt Lake to the Xidatan segment. These results imply that the soil quality (mainly evaluated by soil physical-chemical characteristics) is mainly influenced by soil salt ions in the areas surrounding the Qarhan Salt Lake. Our results provide an accurate prediction of how the soil salt ions, soil nutrients, and SMB respond to the changes along a salt gradient. The underlying mechanisms controlling the soil salt ion distribution, soil nutrients, and SMB in an extremely arid desert climate playa should be studied in greater detail in the future.
|
|
Received: 13 April 2021
Published: 31 March 2022
|
|
Corresponding Authors:
*HUI Rong (E-mail: huirong850623@163.com)
|
|
|
| [1] |
An S S, Huang Y M, Zheng F L. 2009. Evaluation of soil microbial indices along a revegetation chronosequence in grassland soils on the Loess Plateau, Northwest China. Applied Soil Ecology, 41(3): 286-292.
doi: 10.1016/j.apsoil.2008.12.001
|
|
|
| [2] |
Ashraf M. 2004. Some important physiological selection criteria for salt tolerance in plants. Flora, 199(5): 361-376.
doi: 10.1078/0367-2530-00165
|
|
|
| [3] |
Bot A J, Nachtergaele F O, Young A. 2000. Land resource potential and constrains at regional and country levels. In: Land and Water Development Division, Food and Agriculture Organization of the United Nations. World Soil Resources Reports. Rome, Italy.
|
|
|
| [4] |
Brookes P C, Powlson D S, Jenkinson D S. 1982. Measurement of microbial biomass phosphorus in soil. Soil Biology & Biochemistry, 14(4): 319-329.
doi: 10.1016/0038-0717(82)90001-3
|
|
|
| [5] |
Brookes P C, Landman A, Pruden G, et al. 1985. Chloroform fumigation and the release of soil nitrogen: a rapid direct extraction method to measure microbial biomass nitrogen in soil. Soil Biology & Biochemistry, 17(6): 837-842.
doi: 10.1016/0038-0717(85)90144-0
|
|
|
| [6] |
Chambers L G, Davis S E, Troxler T, et al. 2014. Biogeochemical effects of simulated sea level rise on carbon loss in an Everglades mangrove peat soil. Hydrobiologia, 726(1): 195-211.
doi: 10.1007/s10750-013-1764-6
|
|
|
| [7] |
Chen J H, Chen F H, Zhang E L, et al. 2009. A 1000-year chironomid-based salinity reconstruction from varved sediments of Sugan Lake, Qaidam Basin, arid Northwest China, and its palaeoclimatic significance. Science Bulletin, 54(20): 3749-3759.
|
|
|
| [8] |
Chen L J, Li C S, Feng Q, et al. 2019. Direct and indirect impacts of ionic components of saline water on irrigated soil chemical and microbial processes. Catena, 172: 581-589.
doi: 10.1016/j.catena.2018.09.030
|
|
|
| [9] |
Chen Y L, Zhang Z S, Huang L, et al. 2017. Co-variation of fine-root distribution with vegetation and soil properties along a revegetation chronosequence in a desert area in northwestern China. Catena, 151: 16-25.
doi: 10.1016/j.catena.2016.12.004
|
|
|
| [10] |
Daliakopoulos I N, Tsanis I K, Koutroulis A, et al. 2016. The threat of soil salinity: A European scale review. Science of the Total Environment, 573: 727-739.
doi: 10.1016/j.scitotenv.2016.08.177
|
|
|
| [11] |
De la Paix M, Li L H, Chen X, et al. 2013. Physicochemical properties of saline soils and aeolian dust. Land Degradation and Development, 24(6): 539-547.
doi: 10.1002/ldr.v24.6
|
|
|
| [12] |
Dijkstra F A, He M Z, Johansen M P, et al. 2015. Plant and microbial uptake of nitrogen and phosphorus affected by drought using 15N and 32P tracers. Soil Biology & Biochemistry, 82: 135-142.
doi: 10.1016/j.soilbio.2014.12.021
|
|
|
| [13] |
Fan Q S, Ma H Z, Wei H C, et al. 2014. Late Pleistocene paleoclimatic history documented by an oxygen isotope record from carbonate sediments in Qarhan Salt Lake, NE Qinghai-Tibetan Plateau. Journal of Asian Earth Sciences, 85: 202-209.
doi: 10.1016/j.jseaes.2014.02.003
|
|
|
| [14] |
Fan Q S, Ma Y Q, Cheng H D, et al. 2015. Boron occurrence in halite and boron isotope geochemistry of halite in the Qarhan Salt Lake, western China. Sedimentary Geology, 322: 34-42.
doi: 10.1016/j.sedgeo.2015.03.012
|
|
|
| [15] |
Flower H, Rains M, Lewis D, et al. 2017. Saltwater intrusion as a potential driver of phosphorus release from limestone bedrock in coastal aquifer. Estuarine Coastal and Shelf Science, 184: 166-176.
doi: 10.1016/j.ecss.2016.11.013
|
|
|
| [16] |
Gammon J N. 1951. Determination of total potassium and sodium in sandy soils by flame photometer. Soil Science, 71(3): 211-214.
doi: 10.1097/00010694-195103000-00009
|
|
|
| [17] |
Genc Y, Tester M, McDonald G K. 2010. Calcium requirement of wheat in saline and non-saline conditions. Plant and Soil, 327: 331-345.
doi: 10.1007/s11104-009-0057-3
|
|
|
| [18] |
Holden S R, Treseder K K. 2013. A meta-analysis of soil microbial biomass responses to forest disturbances. Frontiers in Microbiology, 4: 163, doi: 10.3389/fmicb.2013.00163.
|
|
|
| [19] |
Hu S Y, Zhao Q, Wang G, et al. 2018. Hydrochemical dynamic characteristics and evolution of underground brine in the Mahai salt lake of the Qaidam Basin Qinghai - Tibet plateau. Acta Geologica Sinica (English Edition), 92(5): 1981-1990.
doi: 10.1111/acgs.2018.92.issue-5
|
|
|
| [20] |
Huang Q, Han F Q. 2007. Paleoclimatic Fluctuation and Evolution of Salt Lakes in Qaidam Basin. Beijing: Science Press, 52-146. (in Chinese)
|
|
|
| [21] |
Ikenaga M, Guevara R, Dean A L, et al. 2011. Changes in community structure of sediment bacteria along the Florida coastal everglades marsh-mangrove-seagrass salinity gradient. Microbial Ecology, 59(2): 284-295.
doi: 10.1007/s00248-009-9572-2
|
|
|
| [22] |
Jia S, Zhu W, Lv A, et al. 2011. A statistical spatial downscaling algorithm of TRMM precipitation based on NDVI and DEM in the Qaidam Basin of China. Remote sensing of Environment, 115(12): 3069-3079.
doi: 10.1016/j.rse.2011.06.009
|
|
|
| [23] |
Jiang H M, Jiang J P, Jia Y, et al. 2006. Soil carbon pool and effects of soil fertility in seeded alfalfa fields on the semi-arid Loess Plateau in China. Soil Biology and Biochemistry, 38(8): 2350-2358.
doi: 10.1016/j.soilbio.2006.02.008
|
|
|
| [24] |
Jiao J J, Zhang X T, Liu Y, et al. 2015. Increased water storage in the Qaidam Basin, the North Tibet Plateau from GRACE gravity data. PLoS One, 10(10): e0141442, doi: 10.1371/journal.pone.0141442.
|
|
|
| [25] |
JRC, Jones A, Panagos P, et al. 2012. The State of Soil in Europe:A Contribution of the JRC to the European Environment Agency's Environment State and Outlook Report-SOER 2010. Luxembourg: Publications Office of the European Union Press, 78.
|
|
|
| [26] |
Lehmann J, Rillig M C, Thies J, et al. 2011. Biochar effects on soil biota - A review. Soil Biology and Biochemistry, 43: 1812-1836.
doi: 10.1016/j.soilbio.2011.04.022
|
|
|
| [27] |
Li C, Dong Z, Yin S, et al. 2019b. Influence of salinity and moisture on the threshold shear velocity of saline sand in the Qarhan Desert, Qaidam Basin of China: A wind tunnel experiment. Journal Arid Land, 11(5): 674-684.
doi: 10.1007/s40333-019-0058-x
|
|
|
| [28] |
Li J G, Pu L J, Han M F, et al. 2014. Soil salinization research in China: advances and prospects. Journal of Geographical Sciences, 24(5): 943-960.
doi: 10.1007/s11442-014-1130-2
|
|
|
| [29] |
Li J Y, Dong Z B, Zhang Z C, et al. 2015. Grain-size characteristics of linear dunes on the northern margin of Qarhan Salt Lake, northwestern China. Journal of Arid Land, 7(4): 438-449.
doi: 10.1007/s40333-015-0005-4
|
|
|
| [30] |
Li X R, He M Z, Zerbe S, et al. 2010. Micro-geomorphology determines community structure of BSCs at small scale. Earth Surface Processes and Landforms, 35(8): 932-940.
doi: 10.1002/esp.v35:8
|
|
|
| [31] |
Li X Y, Wang Z M, Song K S, et al. 2007. Assessment for salinized wasteland expansion and land use change using GIS and remote sensing in the west part of Northeast China. Environmental Monitoring and Assessment, 131(1): 421-437.
doi: 10.1007/s10661-006-9487-z
|
|
|
| [32] |
Li Y H, Zhang T, Zhang Z Z, et al. 2019a. The physiological and biochemical photosynthetic properties of Lycium ruthenicum Murr in response to salinity and drought. Scientia Horticulturae, 256: 108530, doi: 10.1016/j.scienta.2019.05.057.
doi: 10.1016/j.scienta.2019.05.057
|
|
|
| [33] |
Liang Q, Chen H, Gong Y, et al. 2012. Effects of 15 years of manure and inorganic fertilizers on soil organic carbon fractions in a wheat-maize system in the North China Plain. Nutrient Cycling in Agroecosystems, 92(1): 21-33.
doi: 10.1007/s10705-011-9469-6
|
|
|
| [34] |
Luo J, Niu F J, Lin Z J, et al. 2018. Variations in the northern permafrost boundary over the last four decades in the Xidatan region, Qinghai-Tibet Plateau. Journal of Mountain Science, 15(4): 765-778.
doi: 10.1007/s11629-017-4731-2
|
|
|
| [35] |
Mavi M S, Marschner P, Chittleborough D J, et al. 2012. Salinity and sodicity affect soil respiration and dissolved organic matter dynamics differentially in soils varying in texture. Soil Biology and Biochemistry, 45: 8-13.
doi: 10.1016/j.soilbio.2011.10.003
|
|
|
| [36] |
Morrissey E M, Gillespie J L, Morina J C, et al. 2014. Salinity affects microbial activity and soil organic matter content in tidal wetlands. Global change biology, 20(4): 1351-1362.
doi: 10.1111/gcb.12431
pmid: 24307658
|
|
|
| [37] |
Munns R, Tester M. 2008. Mechanisms of salinity tolerance. Annual Review of Plant Biology, 59(1): 651-681.
doi: 10.1146/arplant.2008.59.issue-1
|
|
|
| [38] |
Nanjing Institute of Soil Research, CAS. 1980. Analysis of Soil Physicochemical Features. Shanghai: Shanghai Science and Technology Press, 260.
|
|
|
| [39] |
Olsen S R, Sommers L E. 1982. Phosphorus. In: Page A L, Miller R H, Keeney D R. Methods of Soil Analysis. Madison: American Society of Agronomy Press, 403-427.
|
|
|
| [40] |
Pankova E I, Konyushkova M V. 2013. Climate and soil salinity in the deserts of Central Asia. Eurasian Soil Science, 46(7): 721-727.
doi: 10.1134/S1064229313070065
|
|
|
| [41] |
Paul D, Lade H. 2014. Plant-growth-promoting rhizobacteria to improve crop growth in saline soils: a review. Agronomy for Sustainable Development, 34(4): 737-752.
doi: 10.1007/s13593-014-0233-6
|
|
|
| [42] |
Rath K M, Maheshwari A, Bengtson P, et al. 2016. Comparative toxicities of salts on microbial processes in soil. Applied and Environmental Microbiology, 82(7): 2012-2020.
doi: 10.1128/AEM.04052-15
|
|
|
| [43] |
Rengasamy P. 2010. Soil processes affecting crop production in salt-affected soils. Functional Plant Biology, 37(7): 613-620
doi: 10.1071/FP09249
|
|
|
| [44] |
Rietz D N, Haynes R J. 2003. Effects of irrigation-induced salinity and sodicity on soil microbial activity. Soil Biology and Biochemistry, 35(6): 845-854.
doi: 10.1016/S0038-0717(03)00125-1
|
|
|
| [45] |
Rozema J, Flowers T. 2008. Crops for a salinized world. Science, 322(5907): 1478-1480.
doi: 10.1126/science.1168572
pmid: 19056965
|
|
|
| [46] |
Rubino D L, McCarthy B C. 2003. Evaluation of coarse woody debris and forest vegetation across topographic gradients in a southern Ohio forest. Forest Ecology and Management, 183(1-3): 221-238.
doi: 10.1016/S0378-1127(03)00108-7
|
|
|
| [47] |
Servais S, Kominoski J S, Charles S P, et al. 2019. Saltwater intrusion and soil carbon loss: testing effects of salinity and phosphorus loading on microbial functions in experimental freshwater wetlands. Geoderma, 337: 1291-1300.
doi: 10.1016/j.geoderma.2018.11.013
|
|
|
| [48] |
Setia R, Gottschalk P, Smith P, et al. 2013. Soil salinity decreases global soil organic carbon stocks. Science of the Total Environment, 465: 267-272.
doi: 10.1016/j.scitotenv.2012.08.028
|
|
|
| [49] |
Shrestha R P. 2006. Relating soil electrical conductivity to remote sensing and other soil properties for assessing soil salinity in northeast Thailand. Land Degradation and Development, 17(6): 677-689.
doi: 10.1002/(ISSN)1099-145X
|
|
|
| [50] |
Shrivastava P, Kumar R. 2015. Soil salinity: A serious environmental issue and plant growth promoting bacteria as one of the tools for its alleviation. Saudi Journal of Biological Sciences, 22(2): 123-131.
doi: 10.1016/j.sjbs.2014.12.001
pmid: 25737642
|
|
|
| [51] |
Singh J S, Raghubanshi A S, Singh R S, et al. 1989. Microbial biomass acts as a source of plant nutrients in dry tropical forest and savanna. Nature, 338(6215): 499-500.
doi: 10.1038/338499a0
|
|
|
| [52] |
Singh K. 2015. Microbial and enzyme activities of saline and sodic soils. Land Degradation and Development, 27(3): 706-718.
doi: 10.1002/ldr.v27.3
|
|
|
| [53] |
Song W, Gang H, Ma Y, et al. 2017. Migration behavior of lithium during brine evaporation and KCl production plants in Qarhan salt Lake. Minerals, 7(4): 57, doi: 10.3390/min7040057.
doi: 10.3390/min7040057
|
|
|
| [54] |
Tavakkoli E, Rengasamy P, McDonald G K. 2010. High concentrations of Na+ and Cl- ions in soil solution have simultaneous detrimental effects on growth of faba bea under salinity stress. Journal of Experimental Botany, 61(15): 4449-4459.
doi: 10.1093/jxb/erq251
pmid: 20713463
|
|
|
| [55] |
Tejada M, Gonzalez J L. 2005. Beet vinasse applied to wheat under dryland conditions affects soil properties and yield. European Journal of Agronomy, 23(4): 336-347.
doi: 10.1016/j.eja.2005.02.005
|
|
|
| [56] |
Trnka M, Kersebaum K C, Eitzinger J, et al. 2013. Consequences of climate change for the soil climate in Central Europe and the central plains of the United States. Climatic Change, 120(1): 405-418.
doi: 10.1007/s10584-013-0786-4
|
|
|
| [57] |
van Beek C L, Tóth G. 2012. Risk assessment methodologies of soil threats in Europe. JRC Scientific and Policy Reports EUR, 24097, doi: 10.2788/47096.
|
|
|
| [58] |
Wang F, Du Z L, Lei Y H, et al. 2019. Agricultural climate resources show change features in the South edge of the Qaidam Basin. Chinese Agricultural Science Bulletin, 35(23): 91-96. (in Chinese)
|
|
|
| [59] |
Wang G, Ding Y, Shen Y, et al. 2003. Environmental degradation in the Hexi Corridor region of China over the last 50 years and comprehensive mitigation and rehabilitation strategies. Environmental Geology, 44(1): 68-77.
doi: 10.1007/s00254-002-0736-3
|
|
|
| [60] |
Wang H T, Gilbert J A, Zhu Y G, et al. 2018b. Salinity is a key factor driving the nitrogen cycling in the mangrove sediment. Science of the Total Environment, 631-632: 1342-1349.
doi: 10.1016/j.scitotenv.2018.03.102
|
|
|
| [61] |
Wang P, Cao J, Han Y, et al. 2015. Elemental distribution in the topsoil of the Lake Qinghai catchment, NE Tibetan Plateau, and the implications for weathering in semi-arid areas. Journal of Geochemical Exploration, 152: 1-9.
doi: 10.1016/j.gexplo.2014.12.008
|
|
|
| [62] |
Wang Q M, Huo Z L, Zhang L D, et al. 2016. Impact of saline water irrigation on water use efficiency and soil salt accumulation for spring maize in arid regions of China. Agricultural Water Management, 163: 125-138.
doi: 10.1016/j.agwat.2015.09.012
|
|
|
| [63] |
Wang X, Kong F, Kong W G, et al. 2018a. Edaphic characterization and plant zonation in the Qaidam Basin, Tibetan Plateau. Scientific Reports, 8(1): 1-9.
|
|
|
| [64] |
Wong V N L, Dalal R C, Greene R S B. 2008. Salinity and sodicity effects on respiration and microbial biomass of soil. Biology and Fertility of Soils, 44(7): 943-953.
doi: 10.1007/s00374-008-0279-1
|
|
|
| [65] |
Xiang W, Zhang R, Liu G, et al. 2021. Extraction and analysis of saline soil deformation in the Qarhan Salt Lake region (in Qinghai, China) by the sentinel SBAS-InSAR technique. Geodesy and Geodynamics, doi: 10.1016/j.geog.2020.11.003.
|
|
|
| [66] |
Xie X, Pu L, Zhu M, et al. 2019. Linkage between soil salinization indicators and physicochemical properties in a long-term intensive agricultural coastal reclamation area, Eastern China. Journal of Soils and Sediments, 19(11): 3699-3707.
doi: 10.1007/s11368-019-02333-3
|
|
|
| [67] |
Xue Z J, An S S, Cheng M, et al. 2014. Plant functional traits and soil microbial biomass in different vegetation zones on the Loess Plateau. Journal of Plant Interactions, 9(1): 889-900.
doi: 10.1080/17429145.2014.990063
|
|
|
| [68] |
Yang H T, Li X R, Liu L C, et al. 2014. Soil water repellency and influencing factors of Nitraria tangutorun nebkhas at different succession stages. Journal of Arid Land, 6(3): 300-310.
doi: 10.1007/s40333-013-0199-2
|
|
|
| [69] |
Yang Z P, Gao J X, Zhao L, et al. 2013. Linking thaw depth with soil moisture and plant community composition: effects of permafrost degradation on alpine ecosystems on the Qinghai-Tibet Plateau. Plant and Soil, 367(1): 687-700.
doi: 10.1007/s11104-012-1511-1
|
|
|
| [70] |
Ye C Y, Zheng M P, Wang Z M, et al. 2015. Hydrochemical characteristics and sources of brines in the Gasikule salt lake, Northwest Qaidam Basin, China. Geochemical Journal, 49(5): 481-494.
doi: 10.2343/geochemj.2.0372
|
|
|
| [71] |
Young J, Udeigwe T K, Weindorf D C, et al. 2015. Evaluating management-induced soil salinization in golf courses in semi-arid landscapes. Solid Earth, 6(2): 393-402.
doi: 10.5194/se-6-393-2015
|
|
|
| [72] |
Yu H Y, Li T X, Zhou J M. 2007. Salt accumulation, translocation and ion composition in greenhouse soil profiles. Plant Nutrition and Fertilizer Science, 13(4): 642-650. (in Chinese)
|
|
|
| [73] |
Zeng B, Yang T B. 2008. Impacts of climate warming on vegetation in Qaidam area from 1990 to 2003. Environmental Monitoring and Assessment, 144(1): 403-417.
doi: 10.1007/s10661-007-0003-x
|
|
|
| [74] |
Zhang J. 2010. Physical and chemical soil properties and its salinization characteristics and their evaluation in Daqing. MSc Thesis. Harbin: Forestry College of Northeast Forestry University. (in Chinese)
|
|
|
| [75] |
Zhang P X, Zhang B Z, Lowenstein T K, et al. 1993. Origin of Ancient Potash Evaporites:Examples from the formation of Potash of Qarhan Salt Lake in Qaidam Basin. Beijing: Science Press, 27-121. (in Chinese)
|
|
|
| [76] |
Zhang T, Zhang Z Z, Li Y H, et al. 2019. The effects of saline stress on the growth of two shrub species in the Qaidam Basin of Northwestern China. Sustainability, 11(3): 828, doi: 10.3390/su11030828.
doi: 10.3390/su11030828
|
|
|
| [77] |
Zhang Y, Fang J H, Liu J K, et al. 2012. Variation characteristics of hydrothermal state and migration laws of water and salt in Qarhan Salt Lake region. Chinese Journal Geotechnical Engineering, 34(7): 1344-1348. (in Chinese)
|
|
|
| [78] |
Zhao Q Q, Bai J H, Lu Q Q, et al. 2017. Effects of salinity on dynamics of soil carbon in degraded coastal wetlands: implications on wetland restoration. Physics and Chemistry of the Earth, 97: 12-18.
|
|
|
| [79] |
Zlotopolski V. 2017. The Impact of magnetic water treatment on salt distribution in a large unsaturated soil column. International Soil and Water Conservation Research, 5(4): 253-257.
doi: 10.1016/j.iswcr.2017.05.009
|
|
|
|
Viewed |
|
|
|
Full text
|
|
|
|
|
Abstract
|
|
|
|
|
Cited |
|
|
|
|
| |
Shared |
|
|
|
|
| |
Discussed |
|
|
|
|