| Research article |
|


|
|
|
| Soil quality assessment for desertification based on multi-indicators with the best-worst method in a semi-arid ecosystem |
Orhan DENGİZ1,*( ), İnci DEMİRAĞ TURAN2 ), İnci DEMİRAĞ TURAN2 |
1Department of Soil Science and Plant Nutrition, Faculty of Agriculture, Ondokuz Mayıs University, Samsun-55139, Turkey
2Department of Geography, Faculty of Economic, Administrative and Social Sciences, Samsun University, Samsun-55030, Turkey |
|
|
|
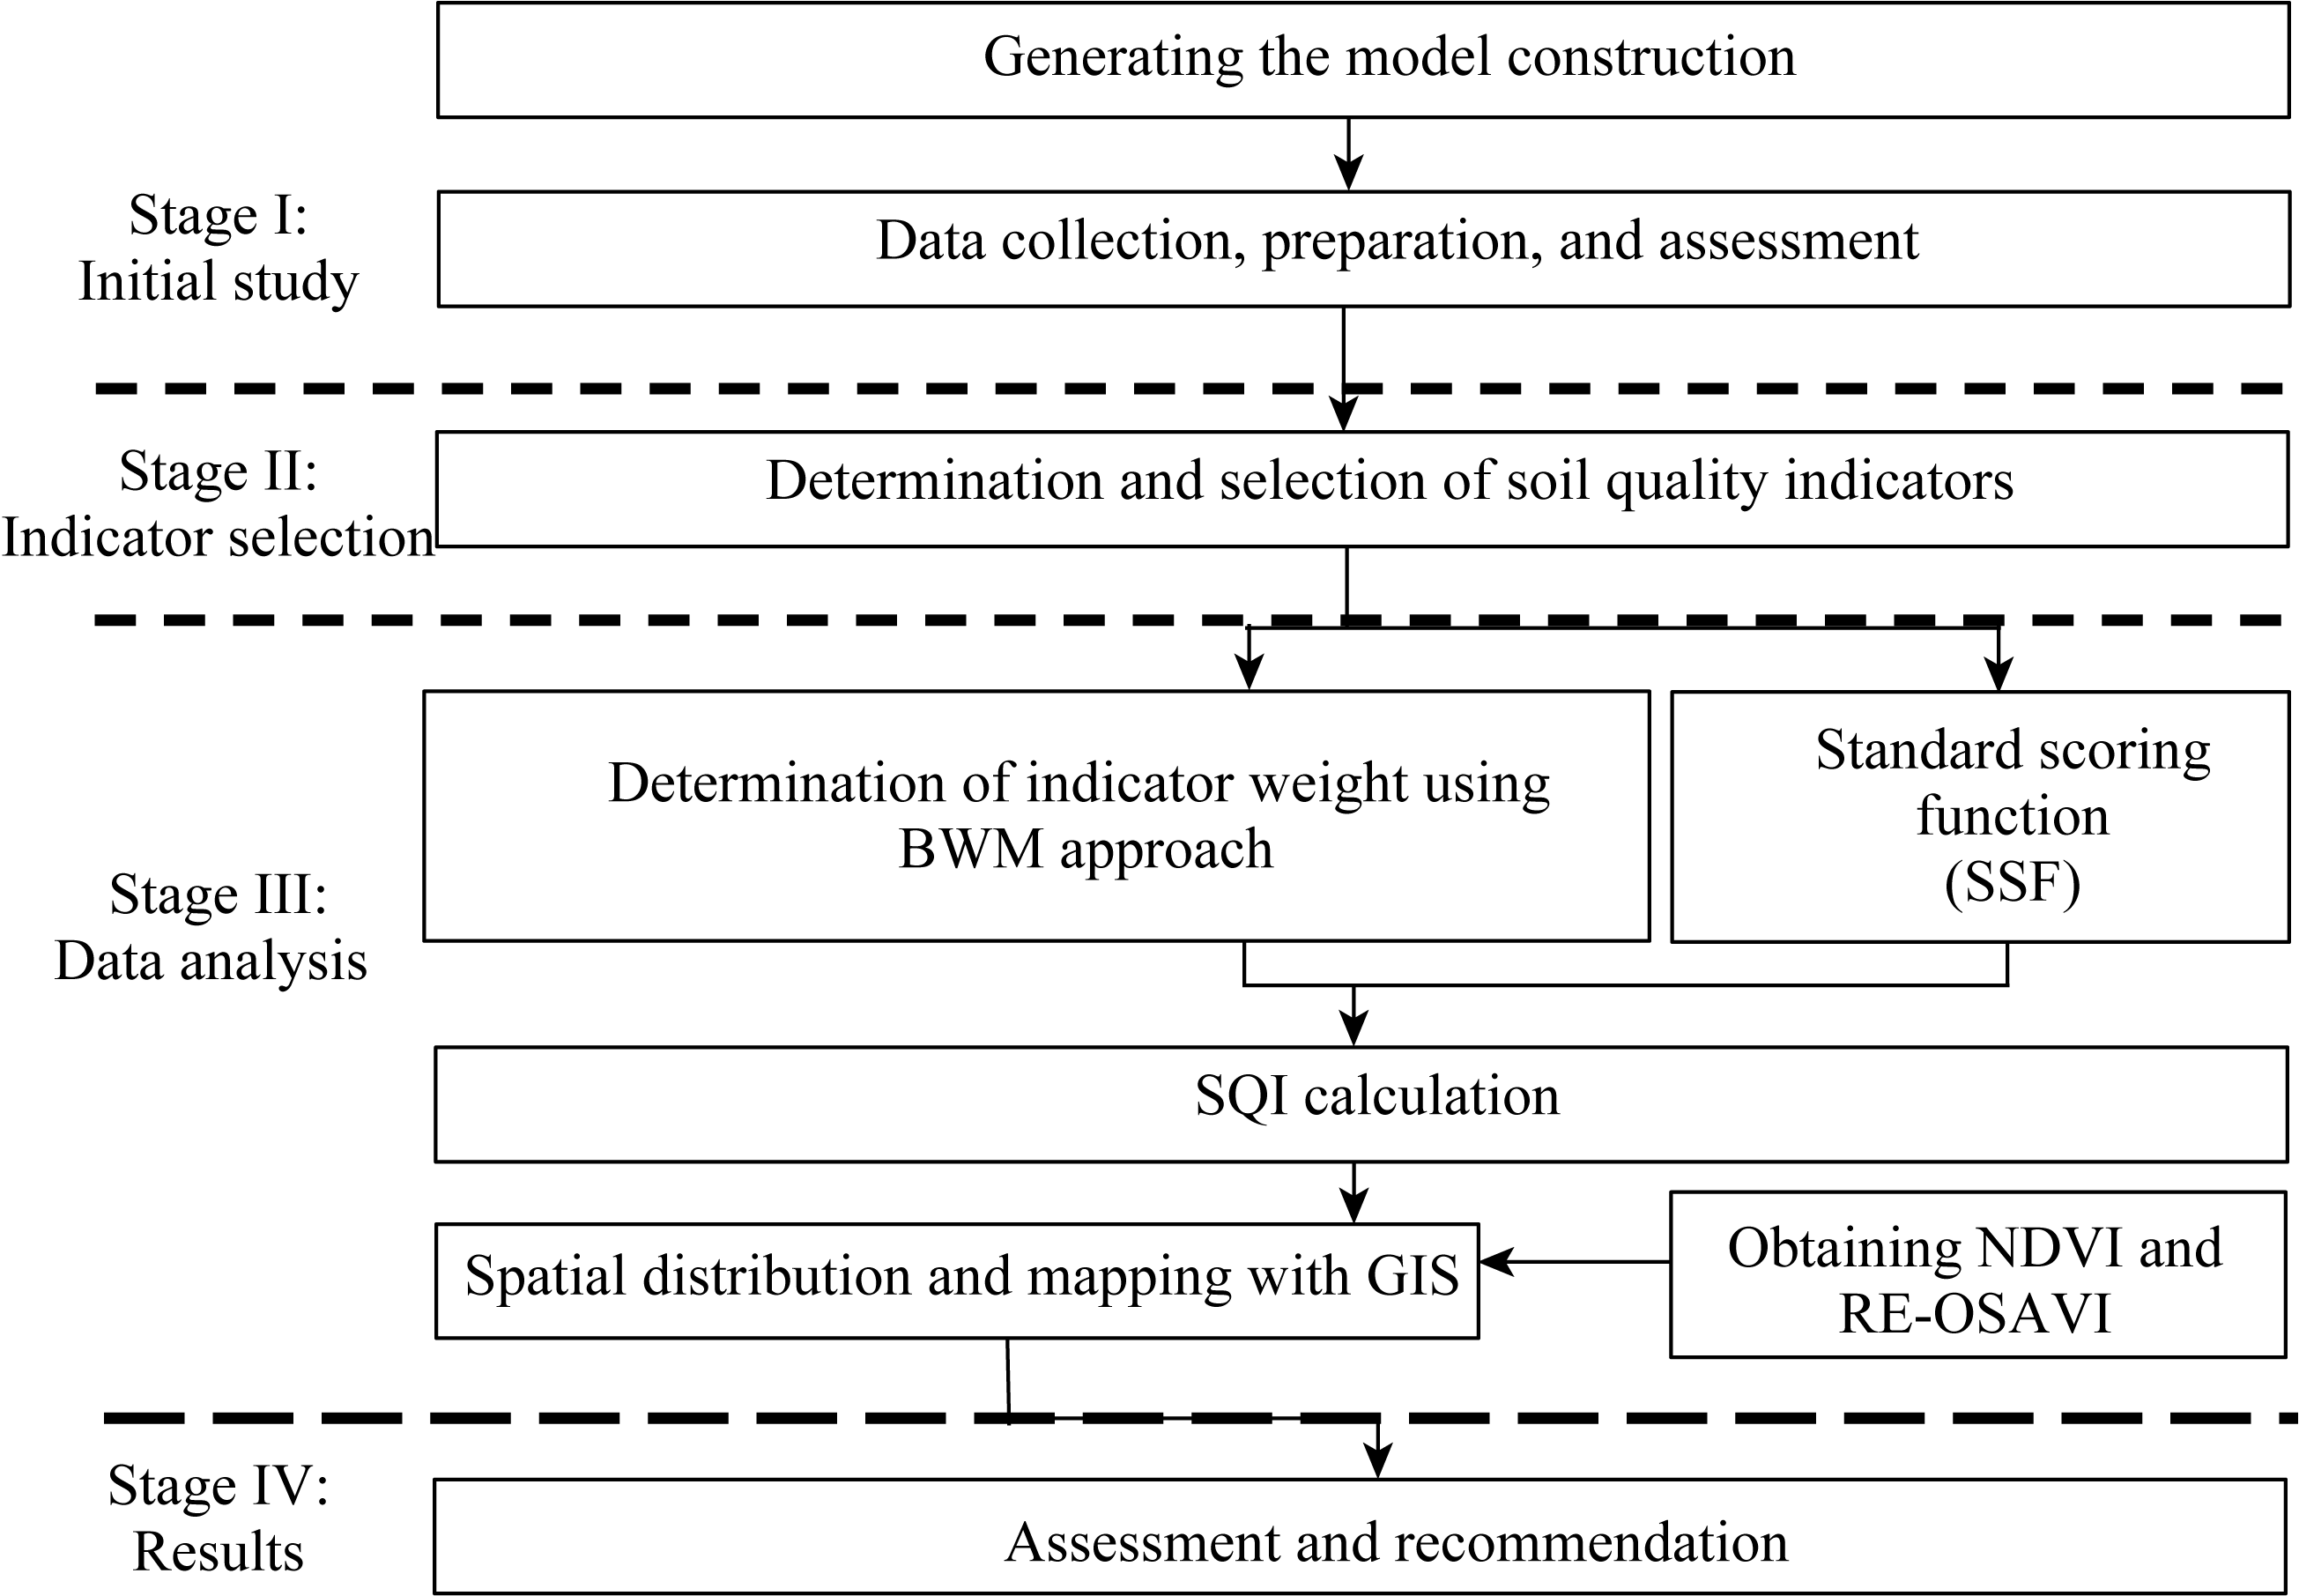
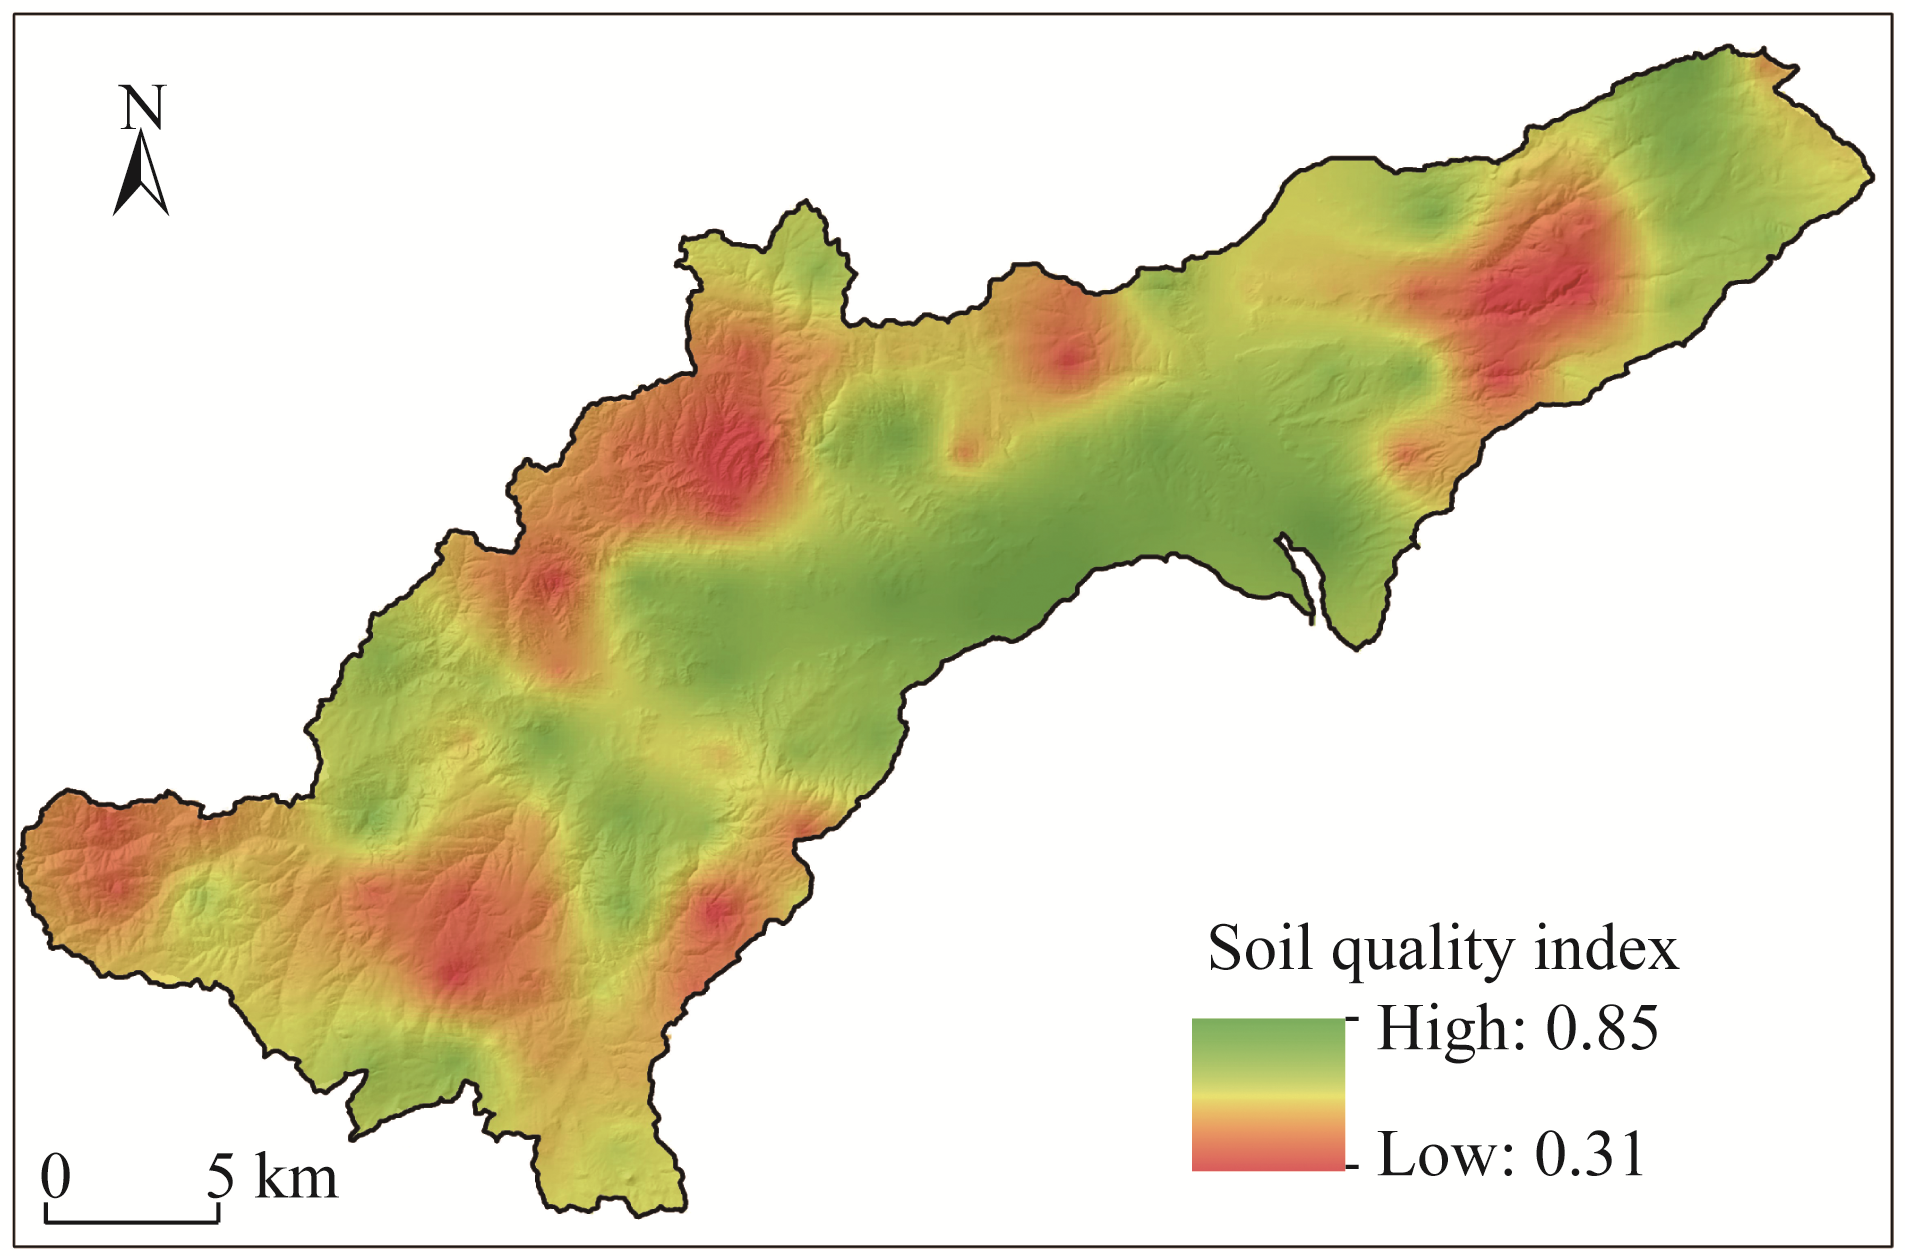
Abstract Since there are some signs of land degradation and desertification showing how soil sustainability is threatened, it is crucial to create a soil quality index (SQI) model in the semi-arid Çorum Basin, situated between the Black Sea and Anatolia Region, Central Turkey. The primary aims of the study are: (1) to determine SQI values of the micro-basin in terms of land degradation and desertification. Moreover, the best-worst method (BWM) was used to determine the weighting score for each parameter; (2) to produce the soils' spatial distribution by utilizing different geostatistical models and GIS (geographic information system) techniques; and (3) to validate the obtained SQI values with biomass reflectance values. Therefore, the relationship of RE-OSAVI (red-edge optimized soil-adjusted vegetation index) and NDVI (normalized difference vegetation index) generated from Sentinel-2A satellite images at different time series with soil quality was examined. Results showed that SQI values were high in the areas that had almost a flat and slight slope. Moreover, the areas with high clay content and thick soil depth did not have salinity problems, and were generally distributed in the middle parts of the basin. However, the areas with a high slope, poor vegetation, high sand content, and low water holding capacity had low SQI values. Furthermore, a statistically high positive correlation of RE-OSAVI and NDVI indices with soil quality was found, and NDVI had the highest correlative value for June (R2=0.802) compared with RE-OSAVI.
|
|
Received: 17 January 2023
Published: 31 July 2023
|
|
Corresponding Authors:
*Orhan DENGİZ (E-mail: odengiz@omu.edu.tr)
|
|
|
| [1] |
Ahmed G B, Shariff A R M, Balasundram S K, et al. 2016. Agriculture land suitability analysis evaluation based multi criteria and GIS approach. IOP Conference Series: Earth and Environmental Science, 37: 012044, doi: 10.1088/ 1755-1315/37/1/012044.
doi: 10.1088/ 1755-1315/37/1/012044
|
|
|
| [2] |
Akbaş B, Akdeniz N, Aksay A, et al. 2011. 1:1250000 Scaled Geology Map of Turkey. Ankara: General Directorate of the Mineral Research and Exploration.
|
|
|
| [3] |
Al-Bakri J T, Suleiman A S. 2004. NDVI response to rainfall in different ecological zones in Jordan. International Journal of Remote Sensing, 25(19): 3897-3912.
doi: 10.1080/01431160310001654428
|
|
|
| [4] |
Andrews S S, Karlen D L, Cambardella C A. 2004. The soil management assessment framework: A quantitative soil quality evaluation method. Science Society of America, 68(6): 1945-1962.
|
|
|
| [5] |
Bagheri N, Ahmadi H, Alavipanah S, et al. 2012. Soil-line vegetation indices for corn nitrogen content prediction. International Agrophysics, 26(2): 103-108.
doi: 10.2478/v10247-012-0016-8
|
|
|
| [6] |
Bölük E. 2016. Climate of Turkey according to Erinç Climate Class. Ankara:Ministry of Forestry and Water Affairs, General Directorate of Meteorology, 10-25.
|
|
|
| [7] |
Bouyoucos G J. 1951. A recalibration of the hydrometer method for making mechanical analysis of soil. Agronomy Journal, 43(9): 434-438.
doi: 10.2134/agronj1951.00021962004300090005x
|
|
|
| [8] |
Chen Y D, Wang H Y, Zhou J M, et al. 2013. Minimum data set for assessing soil quality in farmland of Northeast China. Pedosphere, 23(5): 564-576.
doi: 10.1016/S1002-0160(13)60050-8
|
|
|
| [9] |
Corine. 2018. CORINE land use land cover map of Turkey. [2021-02-25]. https://corinecbs.tarimorman.gov.tr/.
|
|
|
| [10] |
Costantini E A C, Branquinho C, Nunes A, et al. 2016. Soil indicators to assess the effectiveness of restoration strategies in dryland ecosystems. Solid Earth, 7: 397-414.
doi: 10.5194/se-7-397-2016
|
|
|
| [11] |
da Rocha Junior P P, Sturiao W P, Noueira O N, et al. 2020. Soil quality indicators to evaluate environmental services at different landscape positions and land uses in the Atlantic forest biome. Environmental and Sustainability Indicators, 7: 100047, doi: 10.1016/j.indic.2020.100047.
doi: 10.1016/j.indic.2020.100047
|
|
|
| [12] |
Dedeoğlu M, Dengiz O. 2019. Generating of land suitability index for wheat with hybrid system approach using AHP and GIS. Computers and Electronics in Agriculture, 167: 105062, doi: 10.1016/j.compag.2019.105062.
doi: 10.1016/j.compag.2019.105062
|
|
|
| [13] |
Dedeoğlu M, Başayiğit L, Yüksel M, et al. 2020. Assessment of the vegetation indices on Sentinel-2A images for predicting the soil productivity potential in Bursa, Turkey. Environmental Monitoring and Assessment, 192: 16, doi: 10.1007/s10661-019-7989-8.
doi: 10.1007/s10661-019-7989-8
|
|
|
| [14] |
Demirağ Turan İ, Dengiz O, Özkan B. 2019. Spatial assessment and mapping of soil quality index for desertification in the semi-arid terrestrial ecosystem using MCDM in interval type-2 fuzzy environment. Computers and Electronics in Agriculture, 164: 104933, doi: 10.1016/j.compag.2019.104933.
doi: 10.1016/j.compag.2019.104933
|
|
|
| [15] |
Dengiz O, Özcan H, Erşahin S. 2017. Lixisols. In: Selim K, Erhan A, Hikmet G. The Soils of Turkey. Berlin: Springer, 285-291.
|
|
|
| [16] |
Derakhshan-Babaei F, Nosrati K, Mirghaed F A, et al. 2021. The interrelation between landform, land-use, erosion and soil quality in the Kan catchment of the Tehran province, central Iran. CATENA, 204: 105412, doi: 10.1016/j.catena.2021.105412.
doi: 10.1016/j.catena.2021.105412
|
|
|
| [17] |
Doran J W, Coleman D C, Bezdicek D, et al. 1994. Defining Soil Quality for a Sustainable Environment. Madison: Soil Science Society of America, 3-21.
|
|
|
| [18] |
Doran J W, Parkin T B. 1996. Quantitative indicators of soil quality: A minimum data set. In: Doran J W, Jones A J. Methods for Assessing Soil Quality, Special Publication No. 49. Madison: Soil Science Society of America,25-37.
|
|
|
| [19] |
Elalfy Z, Elhadary R, Elashry A. 2010. Integrating GIS and MCDM to deal with landfill site selection. International Journal of Engineering & Technology, 10(6): 33-40.
|
|
|
| [20] |
Eyüpoğlu F. 1999. The State of Productivity of the Territory of Turkey. Ankara: Soil and Fertilizer Research Institute Publications,220.
|
|
|
| [21] |
Fathizad H, Ardakani M A H, Heung B, et al. 2020. Spatio-temporal dynamic of soil quality in the central Iranian desert modeled with machine learning and digital soil assessment techniques. Ecological Indicators, 118: 106736, doi: 10.1016/j.ecolind.2020.106736.
doi: 10.1016/j.ecolind.2020.106736
|
|
|
| [22] |
Fitzgerald G, Rodriguez D, O'Leary G. 2010. Measuring and predicting canopy nitrogen nutrition in wheat using a spectral index-the canopy chlorophyll content index (CCCI). Field Crops Research, 116(3): 318-324.
doi: 10.1016/j.fcr.2010.01.010
|
|
|
| [23] |
Ganiyu S A. 2018. Evaluation of soil hydraulic properties under different non-agricultural land use patterns in a basement complex area using multivariate statistical analysis. Environmental Monitoring and Assessment, 190(10): 595, doi: 10.1007/s10661-018-6959-x.
doi: 10.1007/s10661-018-6959-x
pmid: 30232620
|
|
|
| [24] |
Gen S, Li W, Kang T, et al. 2021. An integrated index based on climatic constraints and soil quality to simulate vegetation productivity patterns. Ecological Indicators, 129: 108015, doi: 10.1016/j.ecolind.2021.108015.
doi: 10.1016/j.ecolind.2021.108015
|
|
|
| [25] |
Girmay G, Singh B R, Mitiku H, et al. 2008. Carbon stocks in Ethiopian soils in relation to land use and soil management. Land Degradation & Development, 19(4): 351-367.
doi: 10.1002/ldr.v19:4
|
|
|
| [26] |
Goovaerts P. 1998. Geostatistical tools for characterizing the spatial variability of microbiological and physico-chemical soil properties. Biology and Fertility of Soils, 27: 315-334.
doi: 10.1007/s003740050439
|
|
|
| [27] |
Gupta R K, Vijayan D, Prasad T S. 2003. Comparative analysis of red-edge hyperspectral indices. Advances in Space Research, 32(11): 2217-2222.
doi: 10.1016/S0273-1177(03)90545-X
|
|
|
| [28] |
Hatfield J L. 2014. Soil degradation, land use, and sustainability. In: David D S, Jerry L H, Dwight T T. Convergence of Food Security, Energy Security and Sustainable Agriculture. Heidelberg and New York: Springer,61-74.
|
|
|
| [29] |
Jackson M L. 1958. Soil Chemical Analysis. Verlag: Prentice Hall Inc., 193-298.
|
|
|
| [30] |
Jiang L, Liu Y, Wu S, et al. 2021. Analyzing ecological environment change and associated driving factors in China based on NDVI time series data. Ecological Indicators, 129: 107933, doi: 10.1016/j.ecolind.2021.107933.
doi: 10.1016/j.ecolind.2021.107933
|
|
|
| [31] |
Jiang L L, Han G M, Lan Y, et al. 2017. Corn cob biochar increases soil culturable bacterial abundance without enhancing their capacities in utilizing carbon sources in biolog eco-plates. Journal of Integrative Agriculture, 16(3): 713-724.
doi: 10.1016/S2095-3119(16)61338-2
|
|
|
| [32] |
Kalbasi R, Jahangiri M, Mosavi A, et al. 2021. Finding the best station in Belgium to use residential-scale solar heating, one-year dynamic simulation with considering all system losses: Economic analysis of using ETSW. Sustainable Energy Technologies and Assessments, 45: 101097, doi: 10.1016/j.seta.2021.101097.
doi: 10.1016/j.seta.2021.101097
|
|
|
| [33] |
Karaca S, Dengiz O, Demirağ Turan İ, et al. 2021. An assessment of pasture soils quality based on multi-indicator weighting approaches in semiarid ecosystem. Ecological Indicators, 121: 107001, doi: 10.1016/j.ecolind.2020.107001.
doi: 10.1016/j.ecolind.2020.107001
|
|
|
| [34] |
Karlen D L, Mausbach M J, Doran J W, et al. 1997. Soil quality: A concept, definition, and framework for evaluation (a guest editorial). Soil Science Society of America Journal, 61(1): 4-10.
doi: 10.2136/sssaj1997.03615995006100010001x
|
|
|
| [35] |
Kaya N S, Özkan B, Dengiz O, et al. 2022. Digital mapping and spatial variability of soil quality index for desertification in the Akarçay Basin under the semi-arid terrestrial ecosystem using neutrosophic fuzzy-AHP approach. Natural Hazards, 112(3): 2101-2132.
doi: 10.1007/s11069-022-05258-2
|
|
|
| [36] |
Lal R, Iivari T, Kimble J M. 2003. Soil Degradation in the United States:Extent, Severity, and Trends. Boca Raton: CRC Press.
|
|
|
| [37] |
Li H, Liao X, Zhu H, et al. 2019. Soil physical and hydraulic properties under different land uses in the black soil region of Northeast China. Canadian Journal of Soil Science, 99(4): 406-419.
doi: 10.1139/cjss-2019-0039
|
|
|
| [38] |
Liebig M A, Varvel G, Doran J. 2001. A simple performance-based ındex for assessing multiple agroecosystem functions. Soil and Crop Management, 93(2): 313-318.
|
|
|
| [39] |
Liu J, Miller J R, Haboudane D, et al. 2004. Exploring the relationship between red edge parameters and crop variables for precision agriculture. In: Proceedings of the 2004 IEEE International Geoscience and Remote Sensing Symposium (IGARSS). Anchorage: IGARSS,1276-1279.
|
|
|
| [40] |
Malczewski J, Rinner C. 2015. Multi-criteria decision analysis in geographic information science. In: Matthias E, José R F, Salvatore G. Trends in Multiple Criterial Decision Analysis. Heidelberg and New York: Springer,369-395.
|
|
|
| [41] |
Mamehpour N, Rezapour S, Ghaemian N. 2021. Quantitative assessment of soil quality indices for urban croplands in a calcareous. Geoderma, 382: 114781, doi: 10.1016/j.geoderma.2020.114781.
doi: 10.1016/j.geoderma.2020.114781
|
|
|
| [42] |
Martín-Sanz J P, de Santiago-Martín A, Valverde-Asenjo I, et al. 2022. Comparison of soil quality indexes calculated by network and principal component analysis for carbonated soils under different uses. Ecological Indicators, 143: 109374, doi: 10.1016/j.ecolind.2022.109374.
doi: 10.1016/j.ecolind.2022.109374
|
|
|
| [43] |
Matton N, Canto G S, Waldner F, et al. 2015. An automated method for annual cropland mapping along the season for various globally-distributed agrosystems using high spatial and temporal resolution time series. Remote Sensing, 7(10): 13208-13232.
doi: 10.3390/rs71013208
|
|
|
| [44] |
Mijangos I, Garbisu C. 2010. Consequences of soil sampling depth during the assessment of the effects of tillage and fertilization on soil quality: A common oversight. Soil & Tillage Research, 109(2): 169-173.
|
|
|
| [45] |
Mirghaed F A, Souri B. 2022. Spatial analysis of soil quality through landscape patterns in the Shoor River Basin, Southwestern Iran. CATENA, 211: 106028, doi: 10.1016/j.catena.2022.106028.
doi: 10.1016/j.catena.2022.106028
|
|
|
| [46] |
Mulla D J, McBratney A B. 2000. Soil spatial variability. In: Sumner M R. Handbook of Soil Science. Boca Raton: CRS Press,321-351.
|
|
|
| [47] |
Nabiollahi K, Taghizadeh-Mehrjardi R, Kerry R, et al. 2017. Assessment of soil quality indices for salt-affected agricultural land in Kurdistan Province, Iran. Ecological Indicators, 83: 482-494.
doi: 10.1016/j.ecolind.2017.08.001
|
|
|
| [48] |
Nosrati K, Collins A L. 2019. A soil quality index for evaluation of degradation under land use and soil erosion categories in a small mountainous catchment Iran. Journal of Mountain Science, 16(11): 2577-2590.
doi: 10.1007/s11629-019-5567-8
|
|
|
| [49] |
Ozsahin E, Eroglu I, Pektezel H. 2017. Soil Quality Index (SQI) analysis of Tekirdag Province using GIS (Thrace, Turkey). Fresenius Environmental Bulletin, 26(4): 3005-3014.
|
|
|
| [50] |
Pettorelli N, Vik J O, Mysterud A, et al. 2005. Using the satellite-derived NDVI to assess ecological responses to environmental change. Trends in Ecology & Evolution, 20(9): 503-510.
doi: 10.1016/j.tree.2005.05.011
|
|
|
| [51] |
Qasim S, Gul S, Shah M H, et al. 2017. Influence of grazing exclosure on vegetation biomass and soil quality. International Soil and Water Conservation, 5(1): 62-68.
|
|
|
| [52] |
Qi Y, Darilek J L, Huang B, et al. 2009. Evaluating soil quality indices in an agricultural region of Jiangsu Province, China. Geoderma, 149(3-4): 325-334.
doi: 10.1016/j.geoderma.2008.12.015
|
|
|
| [53] |
Rahmanipour F, Marzaioli R, Bahrami H A, et al. 2014. Assessment of soil quality indices in agricultural lands of Qazvin Province, Iran. Ecological Indicators, 40: 19-26.
doi: 10.1016/j.ecolind.2013.12.003
|
|
|
| [54] |
Raiesi F. 2017. A minimum data set and soil quality index to quantify the effect of land use conversion on soil quality and degradation in native rangelands of upland arid and semiarid regions. Ecological Indicators, 75: 307-320.
doi: 10.1016/j.ecolind.2016.12.049
|
|
|
| [55] |
Rezaei J. 2015. Best-worst multi-criteria decision-making method. Omega, 53: 49-57.
doi: 10.1016/j.omega.2014.11.009
|
|
|
| [56] |
Rezaei J. 2016. Best-worst multi-criteria decision-making method: Some properties and a linear model. Omega, 64: 126-130.
doi: 10.1016/j.omega.2015.12.001
|
|
|
| [57] |
Rondeaux G, Steven M, Baret F. 1996. Optimization of soil-adjusted vegetation indices. Remote Sensing of Environment, 55(2): 95-107.
doi: 10.1016/0034-4257(95)00186-7
|
|
|
| [58] |
Salinas-Zavala C A, Douglas A V, Diaz H F. 2002. Interannual variability of NDVI in northwest Mexico. Associated climatic mechanisms and ecological implications. Remote Sensing of Environment, 82(2-3): 417-430.
doi: 10.1016/S0034-4257(02)00057-3
|
|
|
| [59] |
Samaei F, Emami H, Lakzian A. 2022. Assessing soil quality of pasture and agriculture land uses in Shandiz county, northwestern Iran. Ecological Indicators, 139: 108974, doi: 10.1016/j.ecolind.2022.108974.
doi: 10.1016/j.ecolind.2022.108974
|
|
|
| [60] |
Santos-Francés F, Martínez-Graña A, Ávila-Zarza C, et al. 2019. Comparison of methods for evaluating soil quality of semiarid ecosystem and evaluation of the effects of physico-chemical properties and factor soil erodibility (Northern Plateau, Spain). Geoderma, 354(6): 113872, doi: 10.1016/j.geoderma.2019.07.030.
doi: 10.1016/j.geoderma.2019.07.030
|
|
|
| [61] |
Schipper L A, Sparling G P. 2000. Performance of soil condition indicators across taxonomic groups and land uses. Soil Science Society of America Journal, 64(1): 300-311.
doi: 10.2136/sssaj2000.641300x
|
|
|
| [62] |
Shulka M K, Lal R, Ebinger M. 2006. Determining soil quality indicators by factor analysis. Soil & Tillage Research, 87(2): 194-204.
|
|
|
| [63] |
Skakun S, Franch B, Vermote E, et al. 2018. Winter wheat yield assessment using Landsat 8 and Sentinel-2 Data. In: Proceedings of the 2018 IEEE International Geoscience and Remote Sensing Symposium (IGARSS). Valencia: IGARSS,5964-5967.
|
|
|
| [64] |
Soil Survey Staff. 1992. Procedures for Collecting Soil Samples and Methods of Analysis for Soil Survey. Washington DC: U.S. Government Printing Office.
|
|
|
| [65] |
Soil Survey Staff. 1993. Soil Survey Manual. United States Department of Agriculture Handbook No: 18. Washington DC: U.S. Government Printing Office.
|
|
|
| [66] |
Taghipour K, Heydari M, Kooch Y, et al. 2022. Assessing changes in soil quality between protected and degraded forests using digital soil mapping for semiarid oak forests, Iran. CATENA, 213: 106204, doi: 10.10l6/j.catena.2022.106204.
doi: 10.10l6/j.catena.2022.106204
|
|
|
| [67] |
Tauqeer H M, Turan V, Iqbal M. 2022a. Managing plant production under changing environment. Singapore: Springer.
|
|
|
| [68] |
Tauqeer H M, Turan V, Iqbal M. 2022b. Production of Safer Vegetables from Heavy Metals Contaminated Soils:The Current Situation, Concerns Associated with Human Health and Novel Management Strategies. Cham: Springer.
|
|
|
| [69] |
Tian K, Zhang B, Zhang H, et al. 2020. Evaluation of soil quality in major grain-producing region of the North China Plain: Integrating minimum data set and established critical limits. Ecological Indicator, 117: 106613, doi: 10.1016/j.ecolind.2020.106613.
doi: 10.1016/j.ecolind.2020.106613
|
|
|
| [70] |
Türkeş M, Öztaş T, Tercan E, et al. 2020. Desertification vulnerability and risk assessment for Turkey via an analytical hierarchy procesmodel. Land Degradation Development, 31: 205-214.
doi: 10.1002/ldr.v31.2
|
|
|
| [71] |
Uzuner Ç, Dengiz O. 2020. Desertification risk assessment in Turkey based on environmentally sensitive areas. Ecological Indicators, 114: 106295, doi: 10.1016/j.ecolind.2020.106295.
doi: 10.1016/j.ecolind.2020.106295
|
|
|
| [72] |
Wen H, Ni S, Wang J, et al. 2021. Changes of soil quality induced by different vegetation restoration in the collapsing gully erosion areas of southern China. International Soil and Water Conservation Research, 9(2): 195-206.
doi: 10.1016/j.iswcr.2020.09.006
|
|
|
| [73] |
Wójtowicz M, Wójtowicz A, Piekarczyk J. 2016. Application of remote sensing methods in agriculture. Communications in Biometry and Crop Science, 11(1): 31-50.
|
|
|
| [74] |
Wu C, Niu Z, Tang Q, et al. 2008. Estimating chlorophyll content from hyperspectral vegetation indices: Modeling and validation. Agricultural and Forest Meteorology, 148(8): 1230-1241.
doi: 10.1016/j.agrformet.2008.03.005
|
|
|
| [75] |
Veum K S, Goyn K W, Kremer R J, et al. 2014. Biological indicators of soil quality and soil organic matter characteristics in an agricultural management continuum. Biogeochernistry, 117(1): 81-99.
|
|
|
| [76] |
Xie Q, Dash J, Huang W, et al. 2018. Vegetation indices combining the red and red-edge spectral information for leaf area index retrieval. Applied Earth Observations and Remote Sensing, 11(5): 1482-1493.
|
|
|
| [77] |
Yifru A, Taye B. 2011. Land use effects on soil organic carbon and nitrogen in some soils of Bale, southeastern Ethiopia. Trop Subtrop Agroecosyst, 14(1): 229-235.
|
|
|
| [78] |
Zand F, Matinfar H R. 2012. Winter wheat yield estimation base upon spectral data and ground measurement. Annals of Biological Research, 3(11): 5169-5177.
|
|
|
| [79] |
Zeraatpisheh M, Bakhshandeh E, Hosseini M, et al. 2020. Assessing the effects of deforestation and intensive agriculture on the soil quality through digital soil mapping. Geoderma, 363: 114139, doi: 10.1016/j.geoderma.2019.114139.
doi: 10.1016/j.geoderma.2019.114139
|
|
|
| [80] |
Zhang Y, Xu X, Li Z, et al. 2021. Improvements in soil quality with vegetation succession in subtropical China Karst. Science of the Total Environment, 775: 145876, doi: 10.1016/j.scitotenv.2021.145876.
doi: 10.1016/j.scitotenv.2021.145876
|
|
|
| [81] |
Zhang Y, Wang L, Jiang J, et al. 2022. Application of soil quality index to determine the effects of different vegetation types on soil quality in the Yellow River Delta wetland. Ecological Indicators, 141: 109116, doi: 10.1016/j.ecolind.2022.109116.
doi: 10.1016/j.ecolind.2022.109116
|
|
|
|
Viewed |
|
|
|
Full text
|
|
|
|
|
Abstract
|
|
|
|
|
Cited |
|
|
|
|
| |
Shared |
|
|
|
|
| |
Discussed |
|
|
|
|