| Research article |
|


|
|
|
| Spatiotemporal landscape pattern changes and their effects on land surface temperature in greenbelt with semi-arid climate: A case study of the Erbil City, Iraq |
Suzan ISMAIL*( ), Hamid MALIKI ), Hamid MALIKI |
| Department of Architecture, College of Engineering, Salahaddin University, Erbil 44002, Iraq |
|
|
|
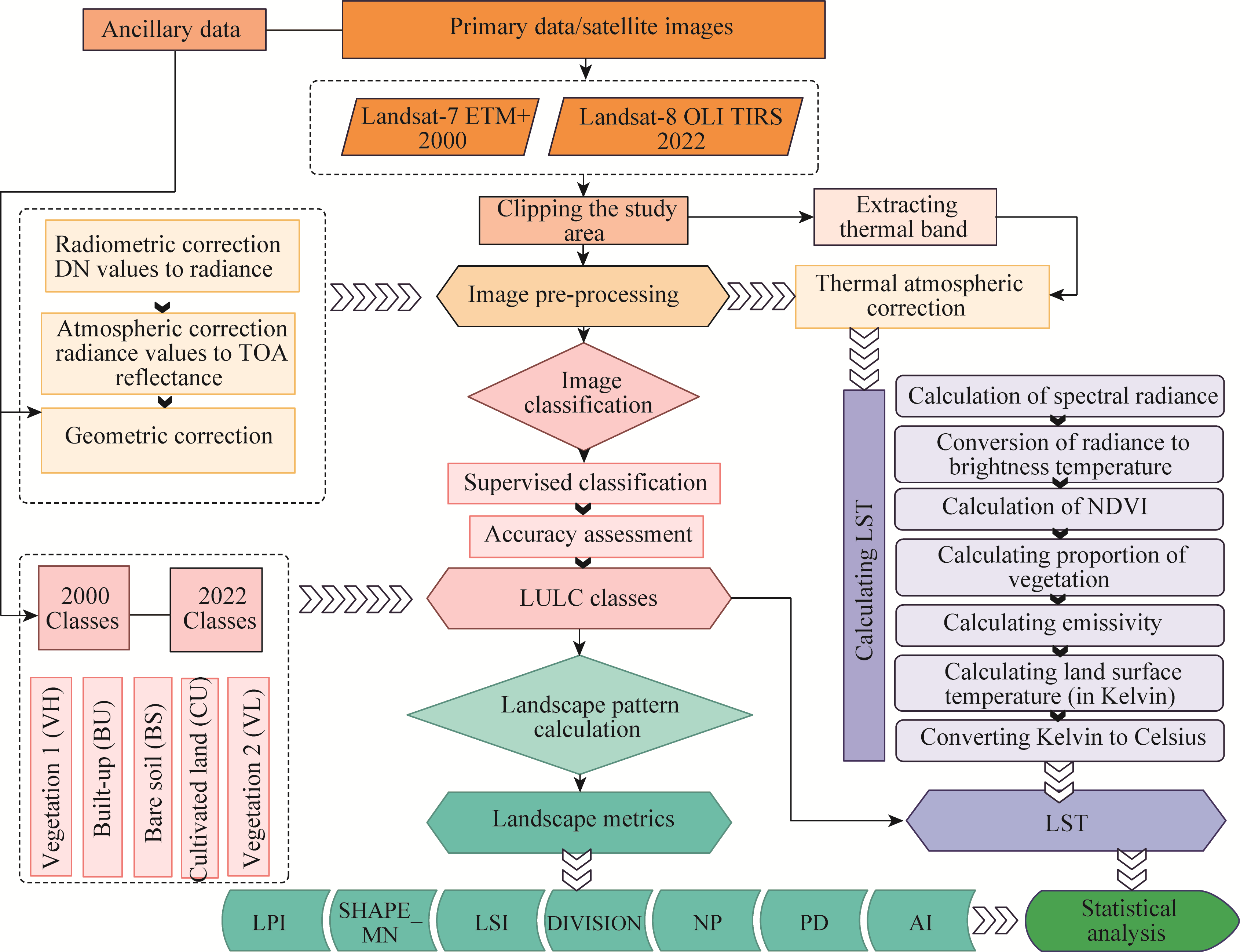
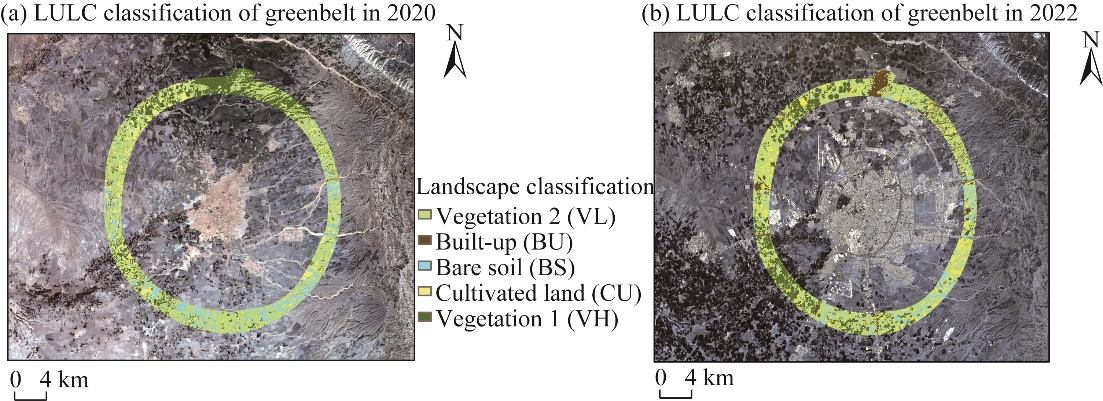
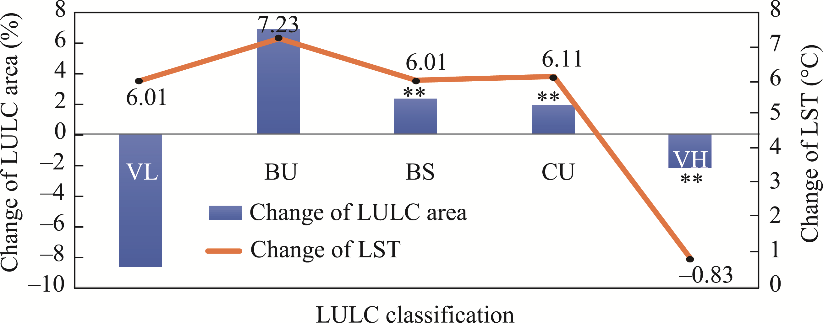
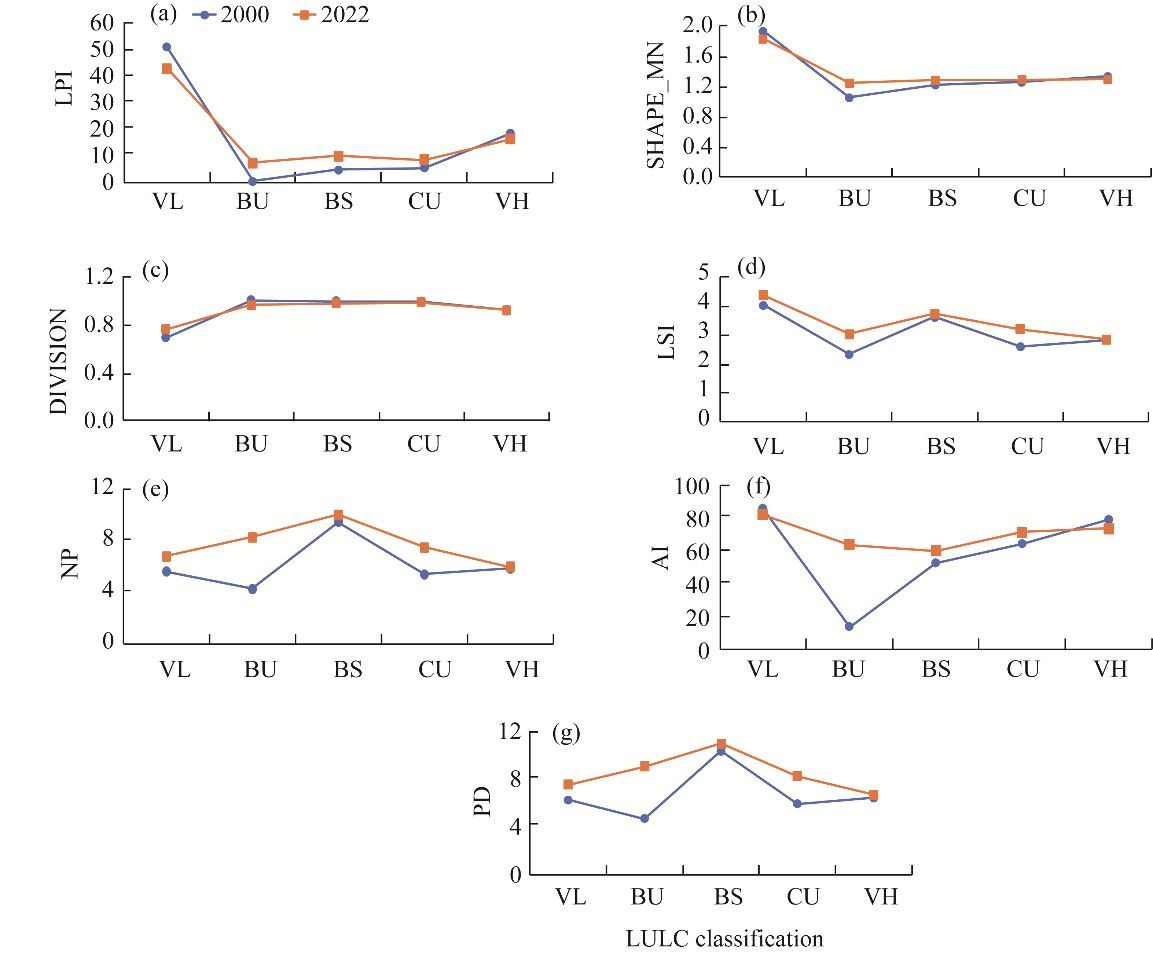
Abstract Urban expansion of cities has caused changes in land use and land cover (LULC) in addition to transformations in the spatial characteristics of landscape structure. These alterations have generated heat islands and rise of land surface temperature (LST), which consequently have caused a variety of environmental issues and threated the sustainable development of urban areas. Greenbelts are employed as an urban planning containment policy to regulate urban expansion, safeguard natural open spaces, and serve adaptation and mitigation functions. And they are regarded as a powerful measure for enhancing urban environmental sustainability. Despite the fact that, the relation between landscape structure change and variation of LST has been examined thoroughly in many studies, but there is a limitation concerning this relation in semi-arid climate and in greenbelts as well, with the lacking of comprehensive research combing both aspects. Accordingly, this study investigated the spatiotemporal changes of landscape pattern of LULC and their relationship with variation of LST within an inner greenbelt in the semi-arid Erbil City of northern Iraq. The study utilized remote sensing data to retrieve LST, classified LULC, and calculated landscape metrics for analyzing spatial changes during the study period. The results indicated that both composition and configuration of LULC had an impact on the variation of LST in the study area. The Pearson's correlation showed the significant effect of Vegetation 1 type (VH), cultivated land (CU), and bare soil (BS) on LST, as increase of LST was related to the decrease of VH and the increases of CU and BS, while, neither Vegetation 2 type (VL) nor built-up (BU) had any effects. Additionally, the spatial distribution of LULC also exhibited significant effects on LST, as LST was strongly correlated with landscape indices for VH, CU, and BS. However, for BU, only aggregation index metric affected LST, while none of VL metrics had a relation. The study provides insights for landscape planners and policymakers to not only develop more green spaces in greenbelt but also optimize the spatial landscape patterns to reduce the influence of LST on the urban environment, and further promote sustainable development and enhance well-being in the cities with semi-arid climate.
|
|
Received: 13 April 2024
Published: 30 September 2024
|
|
|
|
Corresponding Authors:
*Suzan ISMAIL (E-mail: suzan.ismail@su.edu.krd)
|
|
|
| [1] |
Abdullah S A, Nakagoshi N. 2006. Changes in landscape spatial pattern in the highly developing state of Selangor, peninsular Malaysia. Landscape and Urban Planning, 77(3): 263-275.
|
|
|
| [2] |
Abebe G, Getachew D, Ewunetu A. 2022. Analysing land use/land cover changes and its dynamics using remote sensing and GIS in Gubalafito district, Northeastern Ethiopia. Discover Applied Sciences, 4: 30, doi: 10.1007/S42452-021-04915-8.
|
|
|
| [3] |
Aik D H J, Ismail M H, Muharam F M. 2020. Land use/land cover changes and the relationship with land surface temperature using Landsat and Modis imageries in Cameron Highlands, Malaysia. Land, 9(10): 372, doi: 10.3390/land9100372.
|
|
|
| [4] |
Ali K, Johnson B A. 2022. Land-use and land-cover classification in semi-arid areas from medium-resolution remote-sensing imagery: A deep learning approach. Sensors, 22(22): 8750, doi: 10.3390/s22228750.
|
|
|
| [5] |
Amani-Beni M, Zhang B, Xie G Di, et al. 2019. Impacts of urban green landscape patterns on land surface temperature: Evidence from the adjacent area of Olympic Forest Park of Beijing, China. Sustainability, 11(2): 513, doi: 10.3390/su11020513.
|
|
|
| [6] |
Amati M. 2016. Urban Green Belts in the Twenty-first Century. Oxford: Routledge, 268.
|
|
|
| [7] |
Anderson J R, Hardy E E, Roach J T, et al. 1976. A land use and land cover classification system for use with remote sensor data. [2023-12-09]. https://pubs.usgs.gov/publication/pp964.
|
|
|
| [8] |
Athukorala D, Murayama Y. 2020. Spatial variation of land use/cover composition and impact on surface urban heat island in a tropical sub-Saharan city of Accra, Ghana. Sustainability, 12(19): 7953, doi: 10.3390/SU12197953.
|
|
|
| [9] |
Azhdari A, Soltani A, Alidadi M. 2018. Urban morphology and landscape structure effect on land surface temperature: Evidence from Shiraz, a semi-arid city. Sustainable Cities and Society, 41: 853-864.
|
|
|
| [10] |
Balany F, Ng A W, Muttil N, et al. 2020. Green infrastructure as an urban heat island mitigation strategy-a review. Water, 12(12): 3577, doi: 10.3390/w12123577.
|
|
|
| [11] |
Bao T, Li X M, Zhang J, et al. 2016. Assessing the distribution of urban green spaces and its anisotropic cooling distance on urban heat island pattern in Baotou, China. ISPRS International Journal of Geo-Information, 5(2): 12, doi: 10.3390/ijgi5020012.
|
|
|
| [12] |
Baper S, Hassan A, Ismail S. 2013. Modernization theory and house garden transformation: Erbil City as case study. Scientific Journal of Koya University, 1(1): 7-13.
|
|
|
| [13] |
Bengston D N, Youn Y C. 2006. Urban containment policies and the protection of natural areas: The case of Seoul's greenbelt. Ecology and Society, 11(1): 3, doi: 10.5751/ES-01504-110103.
|
|
|
| [14] |
Bhagat S, Prasad P R C. 2023. Assessing the impact of spatio-temporal land use and land cover changes on land surface temperature, with a major emphasis on mining activities in the state of Chhattisgarh, India. Spatial Information Research, 32: 339-355.
|
|
|
| [15] |
Carlson T N, Ripley D A. 1997. On the relation between NDVI, fractional vegetation cover, and leaf area index. Remote Sensing of Environment, 62(3): 241-252.
|
|
|
| [16] |
Chavez Rodriguez L, Parker S, Fiore N M, et al. 2024. Impact of drought on ecohydrology of southern California grassland and shrubland. Ecosystems, 27(1): 106-121.
|
|
|
| [17] |
Connors J P, Galletti C S, Chow W T L. 2013. Landscape configuration and urban heat island effects: Assessing the relationship between landscape characteristics and land surface temperature in Phoenix, Arizona. Landscape Ecology, 28(2): 271-283.
|
|
|
| [18] |
Dash P, Göttsche F M, Olesen F S, et al. 2002. Land surface temperature and emissivity estimation from passive sensor data: Theory and practice-current trends. International Journal of Remote Sensing, 23(13): 2563-2594.
|
|
|
| [19] |
Debie E, Anteneh M, Asmare T. 2022. Land use/cover changes and surface temperature dynamics over Abaminus watershed, Northwest Ethiopia. Air, Soil and Water Research, 15: 11786221221097917, doi: 10.1177/11786221221097917.
|
|
|
| [20] |
Effati F, Karimi H, Yavari A. 2021. Investigating effects of land use and land cover patterns on land surface temperature using landscape metrics in the city of Tehran, Iran. Arabian Journal of Geosciences, 14(13): 1240, doi: 10.1007/s12517-021-07433-4.
|
|
|
| [21] |
Estoque R C, Murayama Y, Myint S W. 2017. Effects of landscape composition and pattern on land surface temperature: An urban heat island study in the megacities of Southeast Asia. Science of the Total Environment, 577: 349-359.
|
|
|
| [22] |
Fan C, Myint S. 2014. A comparison of spatial autocorrelation indices and landscape metrics in measuring urban landscape fragmentation. Landscape and Urban Planning, 121: 117-128.
|
|
|
| [23] |
Galvez R A, Louis F, Dagoc S, et al. 2024. Modeling the influence of land cover dynamics on spatio-temporal variations in land surface temperature in Cagayan de Oro River basin, Mindanao, Philippines. Modeling Earth Systems and Environment, 10(1): 899-912.
|
|
|
| [24] |
Gaznayee H A A, Al-Quraishi A M F, Mahdi K, et al. 2022. A geospatial approach for analysis of drought impacts on vegetation cover and land surface temperature in the Kurdistan Region of Iraq. Water, 14(6): 927, doi: 10.3390/w14060927,
|
|
|
| [25] |
Hamad R, Kolo K, Land H B. 2018. Post-war land cover changes and fragmentation in Halgurd Sakran National Park (HSNP), Kurdistan region of Iraq. Land, 7(1): 38, doi: 10.3390/land7010038.
|
|
|
| [26] |
Han A T, Daniels T L, Kim C. 2022. Managing urban growth in the wake of climate change: Revisiting greenbelt policy in the US. Land Use Policy, 112: 105867, doi: 10.1016/j.landusepol.2021.105867.
|
|
|
| [27] |
Han H Y, Huang C, Ahn K H, et al. 2017. The effects of greenbelt policies on land development: Evidence from the deregulation of the greenbelt in the Seoul metropolitan area. Sustainability, 9(7): 1259, doi: 10.3390/su9071259.
|
|
|
| [28] |
Hou H, Estoque R C. 2020. Detecting cooling effect of landscape from composition and configuration: An urban heat island study on Hangzhou. Urban Forestry and Urban Greening, 53: 126719, doi: 10.1016/j.ufug.2020.126719.
|
|
|
| [29] |
Jia X L, Song P H, Yun G L, et al. 2022. Effect of landscape structure on land surface temperature in different essential urban land use Categories: A case study in Jiaozuo, China. Land, 11(10): 1687, doi: 10.3390/land11101687
|
|
|
| [30] |
Kardani-Yazd N, Kardani-Yazd N, Mansouri Daneshvar M R. 2019. Strategic spatial analysis of urban greenbelt plans in Mashhad city, Iran. Environmental Systems Research, 8: 30, doi: 10.1186/s40068-019-0158-9.
|
|
|
| [31] |
Kong F H, Yin H W, James P, et al. 2014. Effects of spatial pattern of greenspace on urban cooling in a large metropolitan area of eastern China. Landscape and Urban Planning, 128: 35-47.
|
|
|
| [32] |
Kumari M, Sarma K. 2017. Changing trends of land surface temperature in relation to land use/cover around thermal power plant in Singrauli district, Madhya Pradesh, India. Spatial Information Research, 25: 769-777.
|
|
|
| [33] |
Lai Y J, Li C F, Lin P H, et al. 2012. Comparison of MODIS land surface temperature and ground-based observed air temperature in complex topography. International Journal of Remote Sensing, 33(24): 7685-7702.
|
|
|
| [34] |
Li J X, Song C H, Cao L, et al. 2011. Impacts of landscape structure on surface urban heat islands: A case study of Shanghai, China. Remote Sensing of Environment, 115(12): 3249-3263.
|
|
|
| [35] |
Li X M, Zhou W Q, Ouyang Z Y. 2013a. Relationship between land surface temperature and spatial pattern of greenspace: What are the effects of spatial resolution? Landscape and Urban Planning, 114: 1-8, doi: 10.1016/j.landurbplan.2013.02.005.
|
|
|
| [36] |
Li X M, Zhou W Q. 2019. Optimizing urban greenspace spatial pattern to mitigate urban heat island effects: Extending understanding from local to the city scale. Urban Forestry and Urban Greening, 41: 255-263.
|
|
|
| [37] |
Li Y L, Ren C, Ho J Y E, et al. 2023. Landscape metrics in assessing how the configuration of urban green spaces affects their cooling effect: A systematic review of empirical studies. Landscape and Urban Planning, 239: 104842, doi: 10.1016/j.landurbplan.2023.104842.
|
|
|
| [38] |
Li Z L, Tang B H, Wu H, et al. 2013b. Satellite-derived land surface temperature: Current status and perspectives. Remote Sensing of Environment, 131: 14-37.
|
|
|
| [39] |
Liang S L, Wang J D. 2019. Advanced Remote Sensing:Terrestrial Information Extraction and Applications. Pittsburgh: Academic Press.
|
|
|
| [40] |
Liu H, Weng Q H. 2008. Seasonal variations in the relationship between landscape pattern and land surface temperature in Indianapolis, USA. Environmental Monitoring and Assessment, 144: 199-219.
pmid: 17899413
|
|
|
| [41] |
Liu S, Li X F, Chen L, et al. 2022a. A new approach to investigate the spatially heterogeneous in the cooling effects of landscape pattern. Land, 11(2): 239, doi: 10.3390/land11020239.
|
|
|
| [42] |
Liu W R, Jia B Q, Li T, et al. 2022b. Correlation analysis between urban green space and land surface temperature from the perspective of spatial heterogeneity: A case study within the sixth ring road of Beijing. Sustainability, 14(20): 13492, doi: 10.3390/su142013492.
|
|
|
| [43] |
Madanian M, Soffianian A R, Koupai S S, et al. 2018. Analyzing the effects of urban expansion on land surface temperature patterns by landscape metrics: A case study of Isfahan City, Iran. Environmental Monitoring and Assessment, 189: 190, doi: 10.1007/s10661-018-6564-z.
|
|
|
| [44] |
Madhumathi A, Vishnupriya J, Vignesh S. 2014. Sustainability of traditional rural mud houses in Tamilnadu, India: An analysis related to thermal comfort. Journal of Multidisciplinary Engineering Science and Technology, 1(5): 302-311.
|
|
|
| [45] |
Maimaitiyiming M, Ghulam A, Tiyip T, et al. 2014. Effects of green space spatial pattern on land surface temperature: Implications for sustainable urban planning and climate change adaptation. ISPRS Journal of Photogrammetry and Remote Sensing, 89: 59-66.
|
|
|
| [46] |
Masoudi M, Tan P Y. 2019. Multi-year comparison of the effects of spatial pattern of urban green spaces on urban land surface temperature. Landscape and Urban Planning, 184: 44-58.
doi: 10.1016/j.landurbplan.2018.10.023
|
|
|
| [47] |
McGarigal K, Marks B J. 1995. Spatial pattern analysis program for quantifying landscape structure. In: General Technical Report. PNW-GTR-351. United States Department of Agriculture, Forest Service, Pacific Northwest Research Station, USA.
|
|
|
| [48] |
McGarigal K. 2014. Fragstats Help. Amherst: University of Massachusetts: 182.
|
|
|
| [49] |
McGarigal K, Cushman S A, Ene E. 2023. Fragstats v.4.0. [2024-01-12]. https://fragstats.org/index.php/downloads.
|
|
|
| [50] |
Moravec D, Komárek J, Medina S L C, et al. 2021. Effect of atmospheric corrections on NDVI: Intercomparability of Landsat 8, Sentinel-2, and UAV sensors. Remote Sensing, 13(18): 3550, doi: 10.3390/rs13183550.
|
|
|
| [51] |
Myint S W, Zheng B J, Talen E, et al. 2015. Does the spatial arrangement of urban landscape matter? Examples of urban warming and cooling in phoenix and Las Vegas. Ecosystem Health and Sustainability, 1(4): 1-15.
|
|
|
| [52] |
Naeem S, Cao C X, Qazi W A, et al. 2018. Studying the association between green space characteristics and land surface temperature for sustainable urban environments: An analysis of Beijing and Islamabad. ISPRS International Journal of Geo-Information, 7(2): 38, doi: 10.3390/ijgi7020038.
|
|
|
| [53] |
O'Neill R V, Krummel J R, Gardner R H, et al. 1988. Indices of landscape pattern. Landscape Ecology, 1: 153-162.
|
|
|
| [54] |
Quattrochi D A, Luvall J C. 2014. Thermal infrared remote sensing for analysis of landscape ecological processes: Current insights and trends. Scale Issues in Remote Sensing, 14: 34-60.
|
|
|
| [55] |
Rash A, Mustafa Y, Hamad R. 2023. Quantitative assessment of Land use/land cover changes in a developing region using machine learning algorithms: A case study in the Kurdistan Region, Iraq. Heliyon, 9(11): e21253, doi: 10.1016/j.heliyon.2023.e21253.
|
|
|
| [56] |
Rasul A, Balzter H, Smith C. 2015. Spatial variation of the daytime Surface Urban Cool Island during the dry season in Erbil, Iraqi Kurdistan, from Landsat 8. Urban Climate, 14: 176-186.
|
|
|
| [57] |
Rasul A, Balzter H, Smith C. 2017. Applying a normalized ratio scale technique to assess influences of urban expansion on land surface temperature of the semi-arid city of Erbil. International Journal of Remote Sensing, 38(13): 3960-3980.
|
|
|
| [58] |
Rimal B, Sharma R, Kunwar R, et al. 2019. Effects of land use and land cover change on ecosystem services in the Koshi River Basin, Eastern Nepal. Ecosystem Services, 38: 100963, doi: 10.1016/j.ecoser.2019.100963.
|
|
|
| [59] |
Sekertekin A, Bonafoni S. 2020. Land surface temperature retrieval from Landsat 5, 7, and 8 over rural areas: Assessment of different retrieval algorithms and emissivity models and toolbox implementation. Remote Sensing, 12(2): 294, doi: 10.3390/rs12020294.
|
|
|
| [60] |
Senanayake I P, Welivitiya W D D P, Nadeeka P M. 2013. Remote sensing based analysis of urban heat islands with vegetation cover in Colombo city, Sri Lanka using Landsat-7 ETM+ data. Urban Climate, 5: 19-35.
|
|
|
| [61] |
Sobrino J A, Jiménez-Muñoz J C, Paolini L. 2004. Land surface temperature retrieval from Landsat TM 5. Remote Sensing of Environment, 90(4): 434-440.
|
|
|
| [62] |
Song Y, Song X D, Shao G F. 2020. Effects of green space patterns on urban thermal environment at multiple spatial-temporal scales. Sustainability, 12(17): 6850, doi: 10.3390/SU12176850.
|
|
|
| [63] |
Turner M G. 2005. Landscape ecology: What is the state of the science? Annual Review of Ecology, Evolution, and Systematics, 36: 319-344.
|
|
|
| [64] |
Valor E, Caselles V. 1996. Mapping land surface emissivity from NDVI: Application to European, African, and South American areas. Remote Sensing of Environment, 57(3): 167-184.
|
|
|
| [65] |
Vanderhaegen S, Canters F. 2010. Developing urban metrics to describe the morphology of urban areas at block level. International Archives of the Photogrammetry, Remote Sensing and Spatial Information Sciences, 36: 192-197.
|
|
|
| [66] |
Wang H B, Li H, Ming H B, et al. 2014. Past land use decisions and socioeconomic factors influence urban greenbelt development: A case study of Shanghai, China. Landscape Ecology, 29: 1759-1770.
|
|
|
| [67] |
Wang H T, Zhang Y Z, Tsou J Y, et al. 2017. Surface urban heat island analysis of Shanghai (China) based on the change of land use and land cover. Sustainability, 9(9): 1538, doi: 10.3390/su9091538.
|
|
|
| [68] |
Wang Q, Xiong K N, Zhou J Y, et al. 2023. Impact of land use and land cover change on the landscape pattern and service value of the village ecosystem in the karst desertification control. Frontiers in Environmental Science, 11: 1020331, doi: 10.3389/fenvs.2023.1020331.
|
|
|
| [69] |
Yang C B, He X Y, Yu L X, et al. 2017. The cooling effect of urban parks and its monthly variations in a snow climate city. Remote Sensing, 9(10): 1066, doi: 10.3390/rs9101066.
|
|
|
| [70] |
Yang J, Jin X. 2007. The failure and success of greenbelt program in Beijing. Urban Forestry and Urban Greening, 6(4): 287-296.
|
|
|
| [71] |
Zhang H, Qi Z F, Ye X Y, et al. 2013. Analysis of land use/land cover change, population shift, and their effects on spatiotemporal patterns of urban heat islands in metropolitan Shanghai, China. Applied Geography, 44: 121-133.
|
|
|
| [72] |
Zheng B J, Myint S W, Fan C. 2014. Spatial configuration of anthropogenic land cover impacts on urban warming. Landscape and Urban Planning, 130: 104-111.
|
|
|
| [73] |
Zhou W Q, Wang J, Cadenasso M L. 2017. Effects of the spatial configuration of trees on urban heat mitigation: A comparative study. Remote Sensing of Environment, 195: 1-12.
|
|
|
|
Viewed |
|
|
|
Full text
|
|
|
|
|
Abstract
|
|
|
|
|
Cited |
|
|
|
|
| |
Shared |
|
|
|
|
| |
Discussed |
|
|
|
|