| Research article |
|


|
|
|
| Spatiotemporal variations in ecological quality of Otindag Sandy Land based on a new modified remote sensing ecological index |
ZHAO Xiaohan1, HAN Dianchen1, LU Qi2, LI Yunpeng3, ZHANG Fangmin1,*( ) ) |
1Collaborative Innovation Center on Forecast and Evaluation of Meteorological Disasters/Jiangsu Key Laboratory of Agricultural Meteorology, Nanjing University of Information Science and Technology, Nanjing 210044, China
2Institute of Desertification, Chinese Academy of Forestry, Beijing 100091, China
3Ecology and Agricultural Meteorology Center of Inner Mongolia Autonomous Region, Hohhot 010051, China |
|
|
|
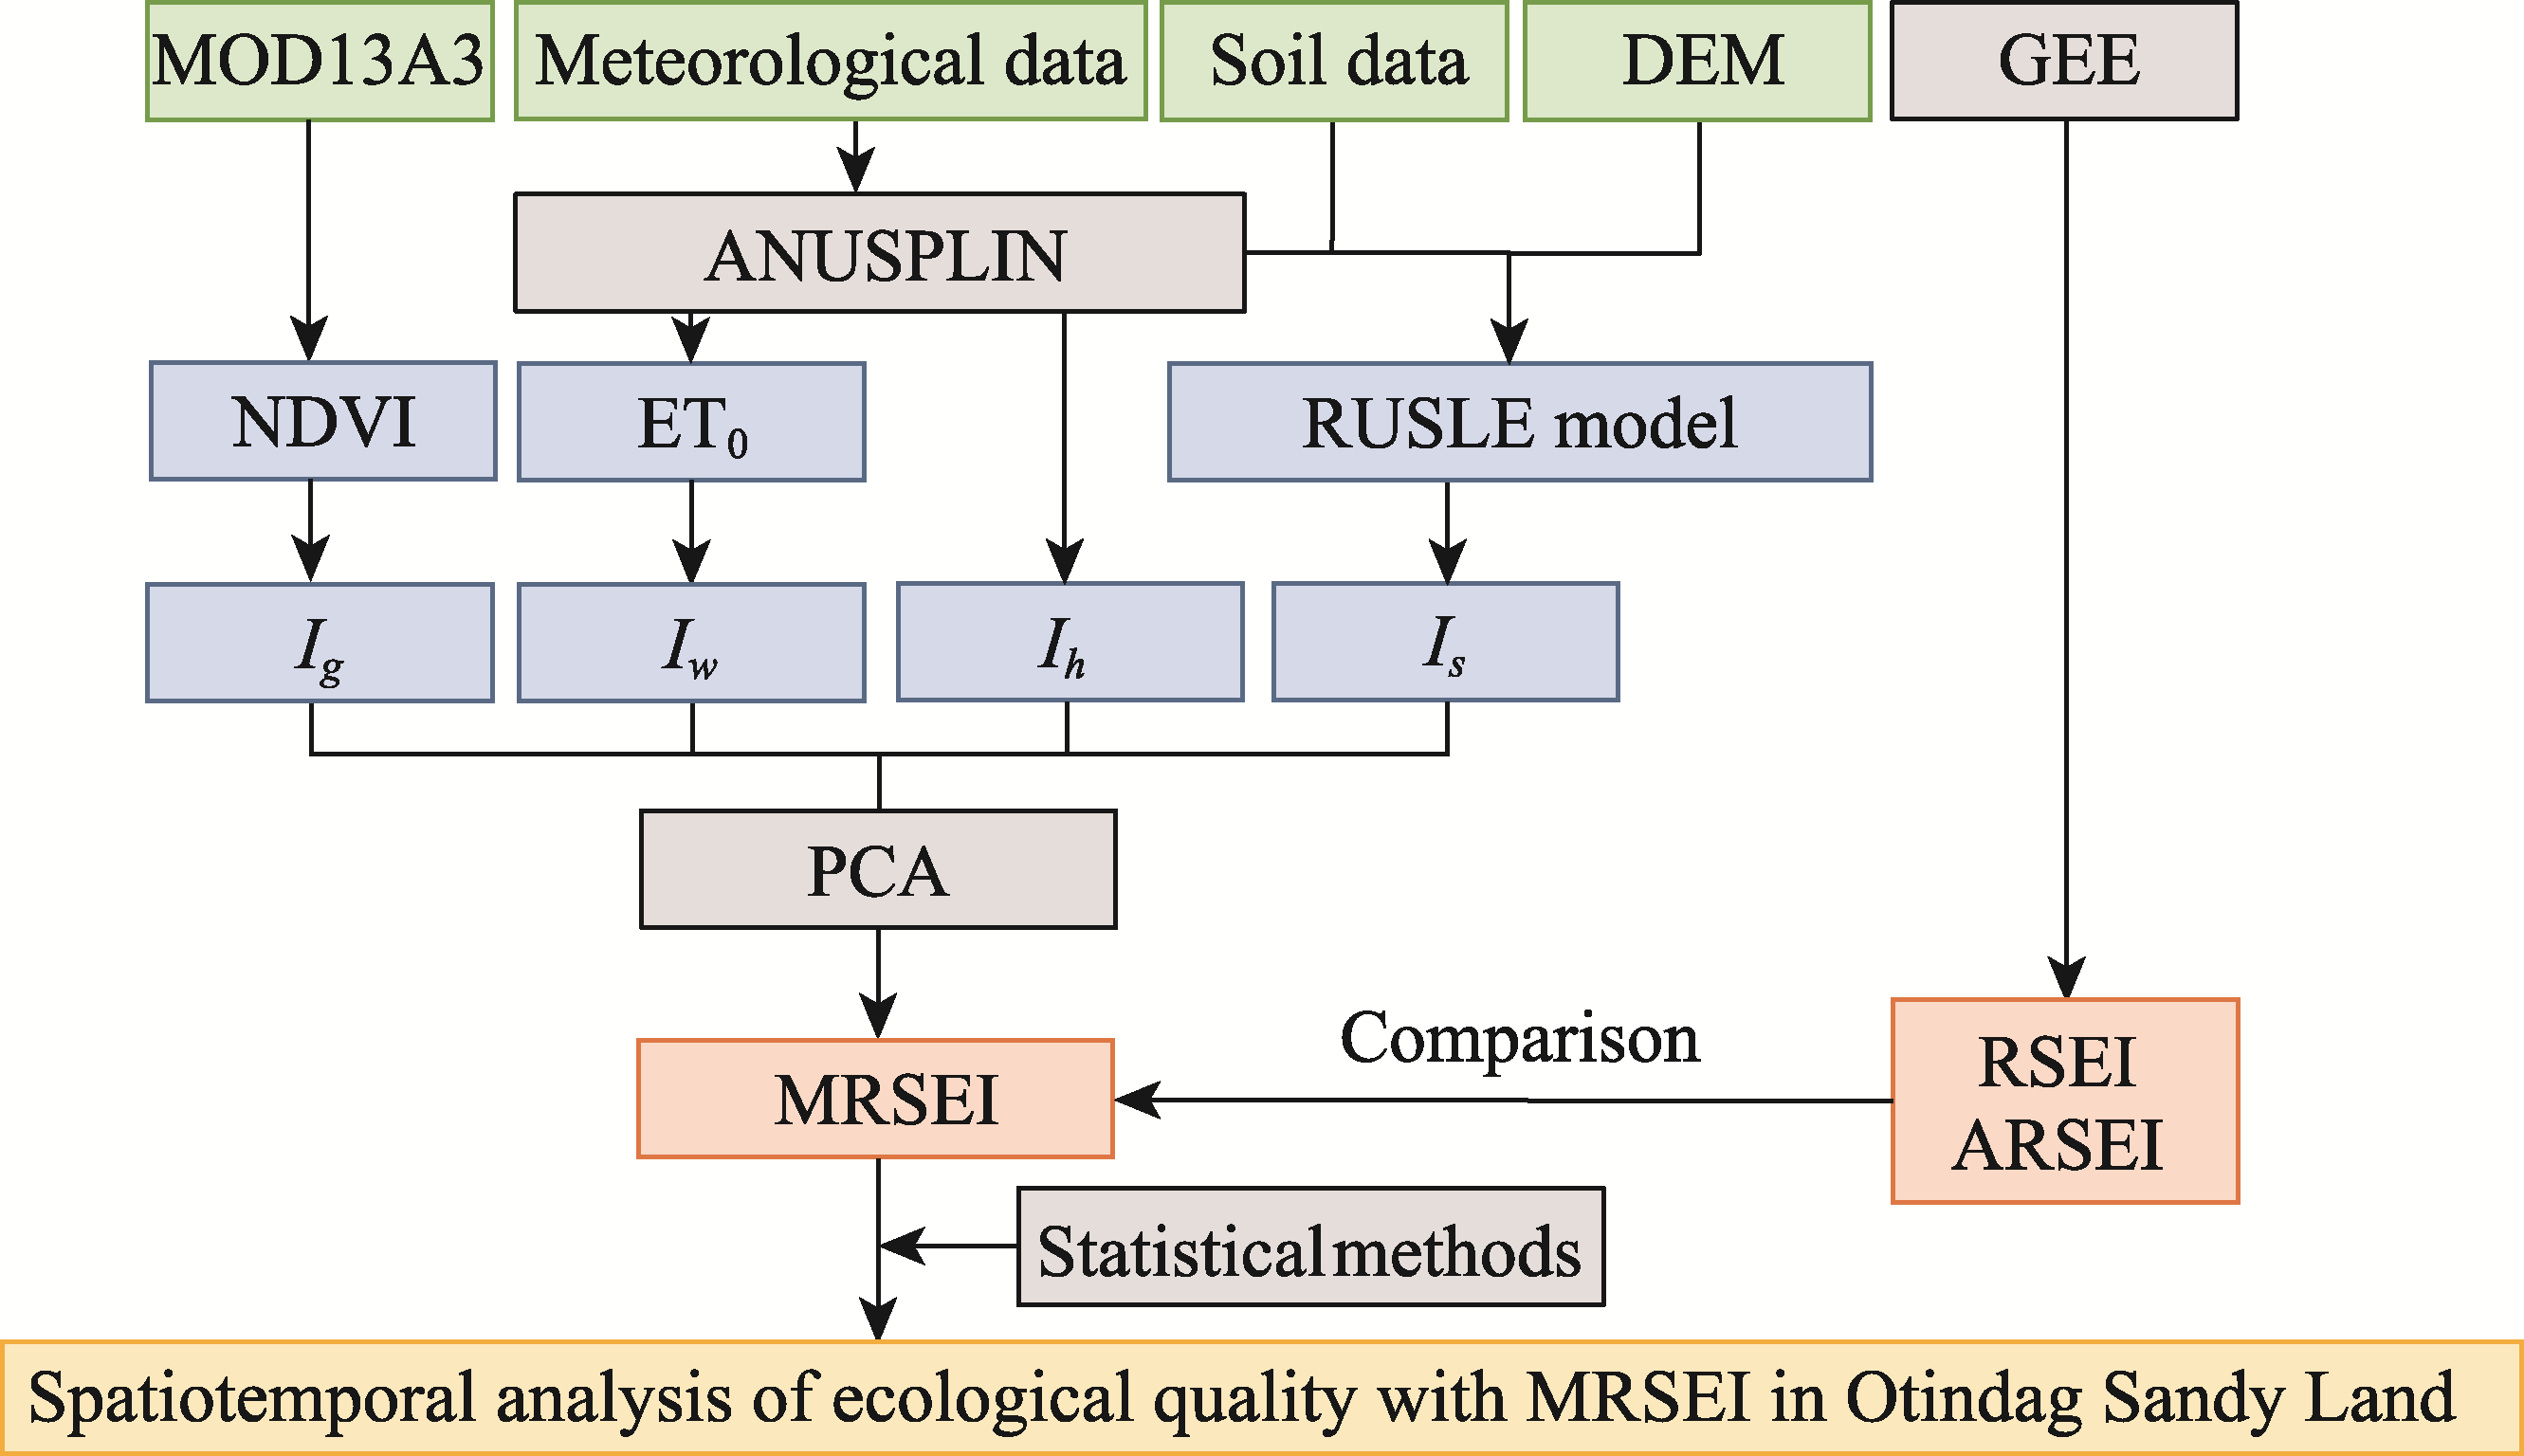
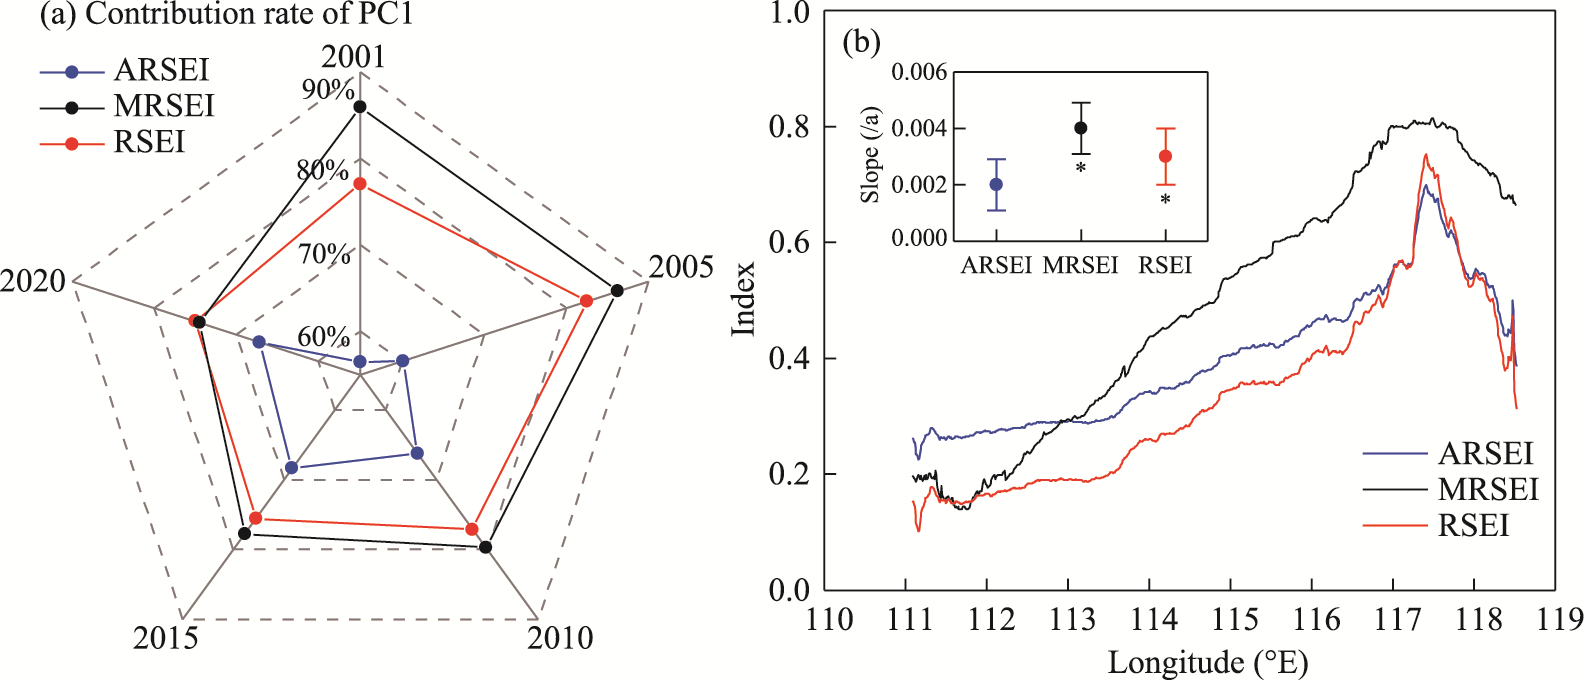
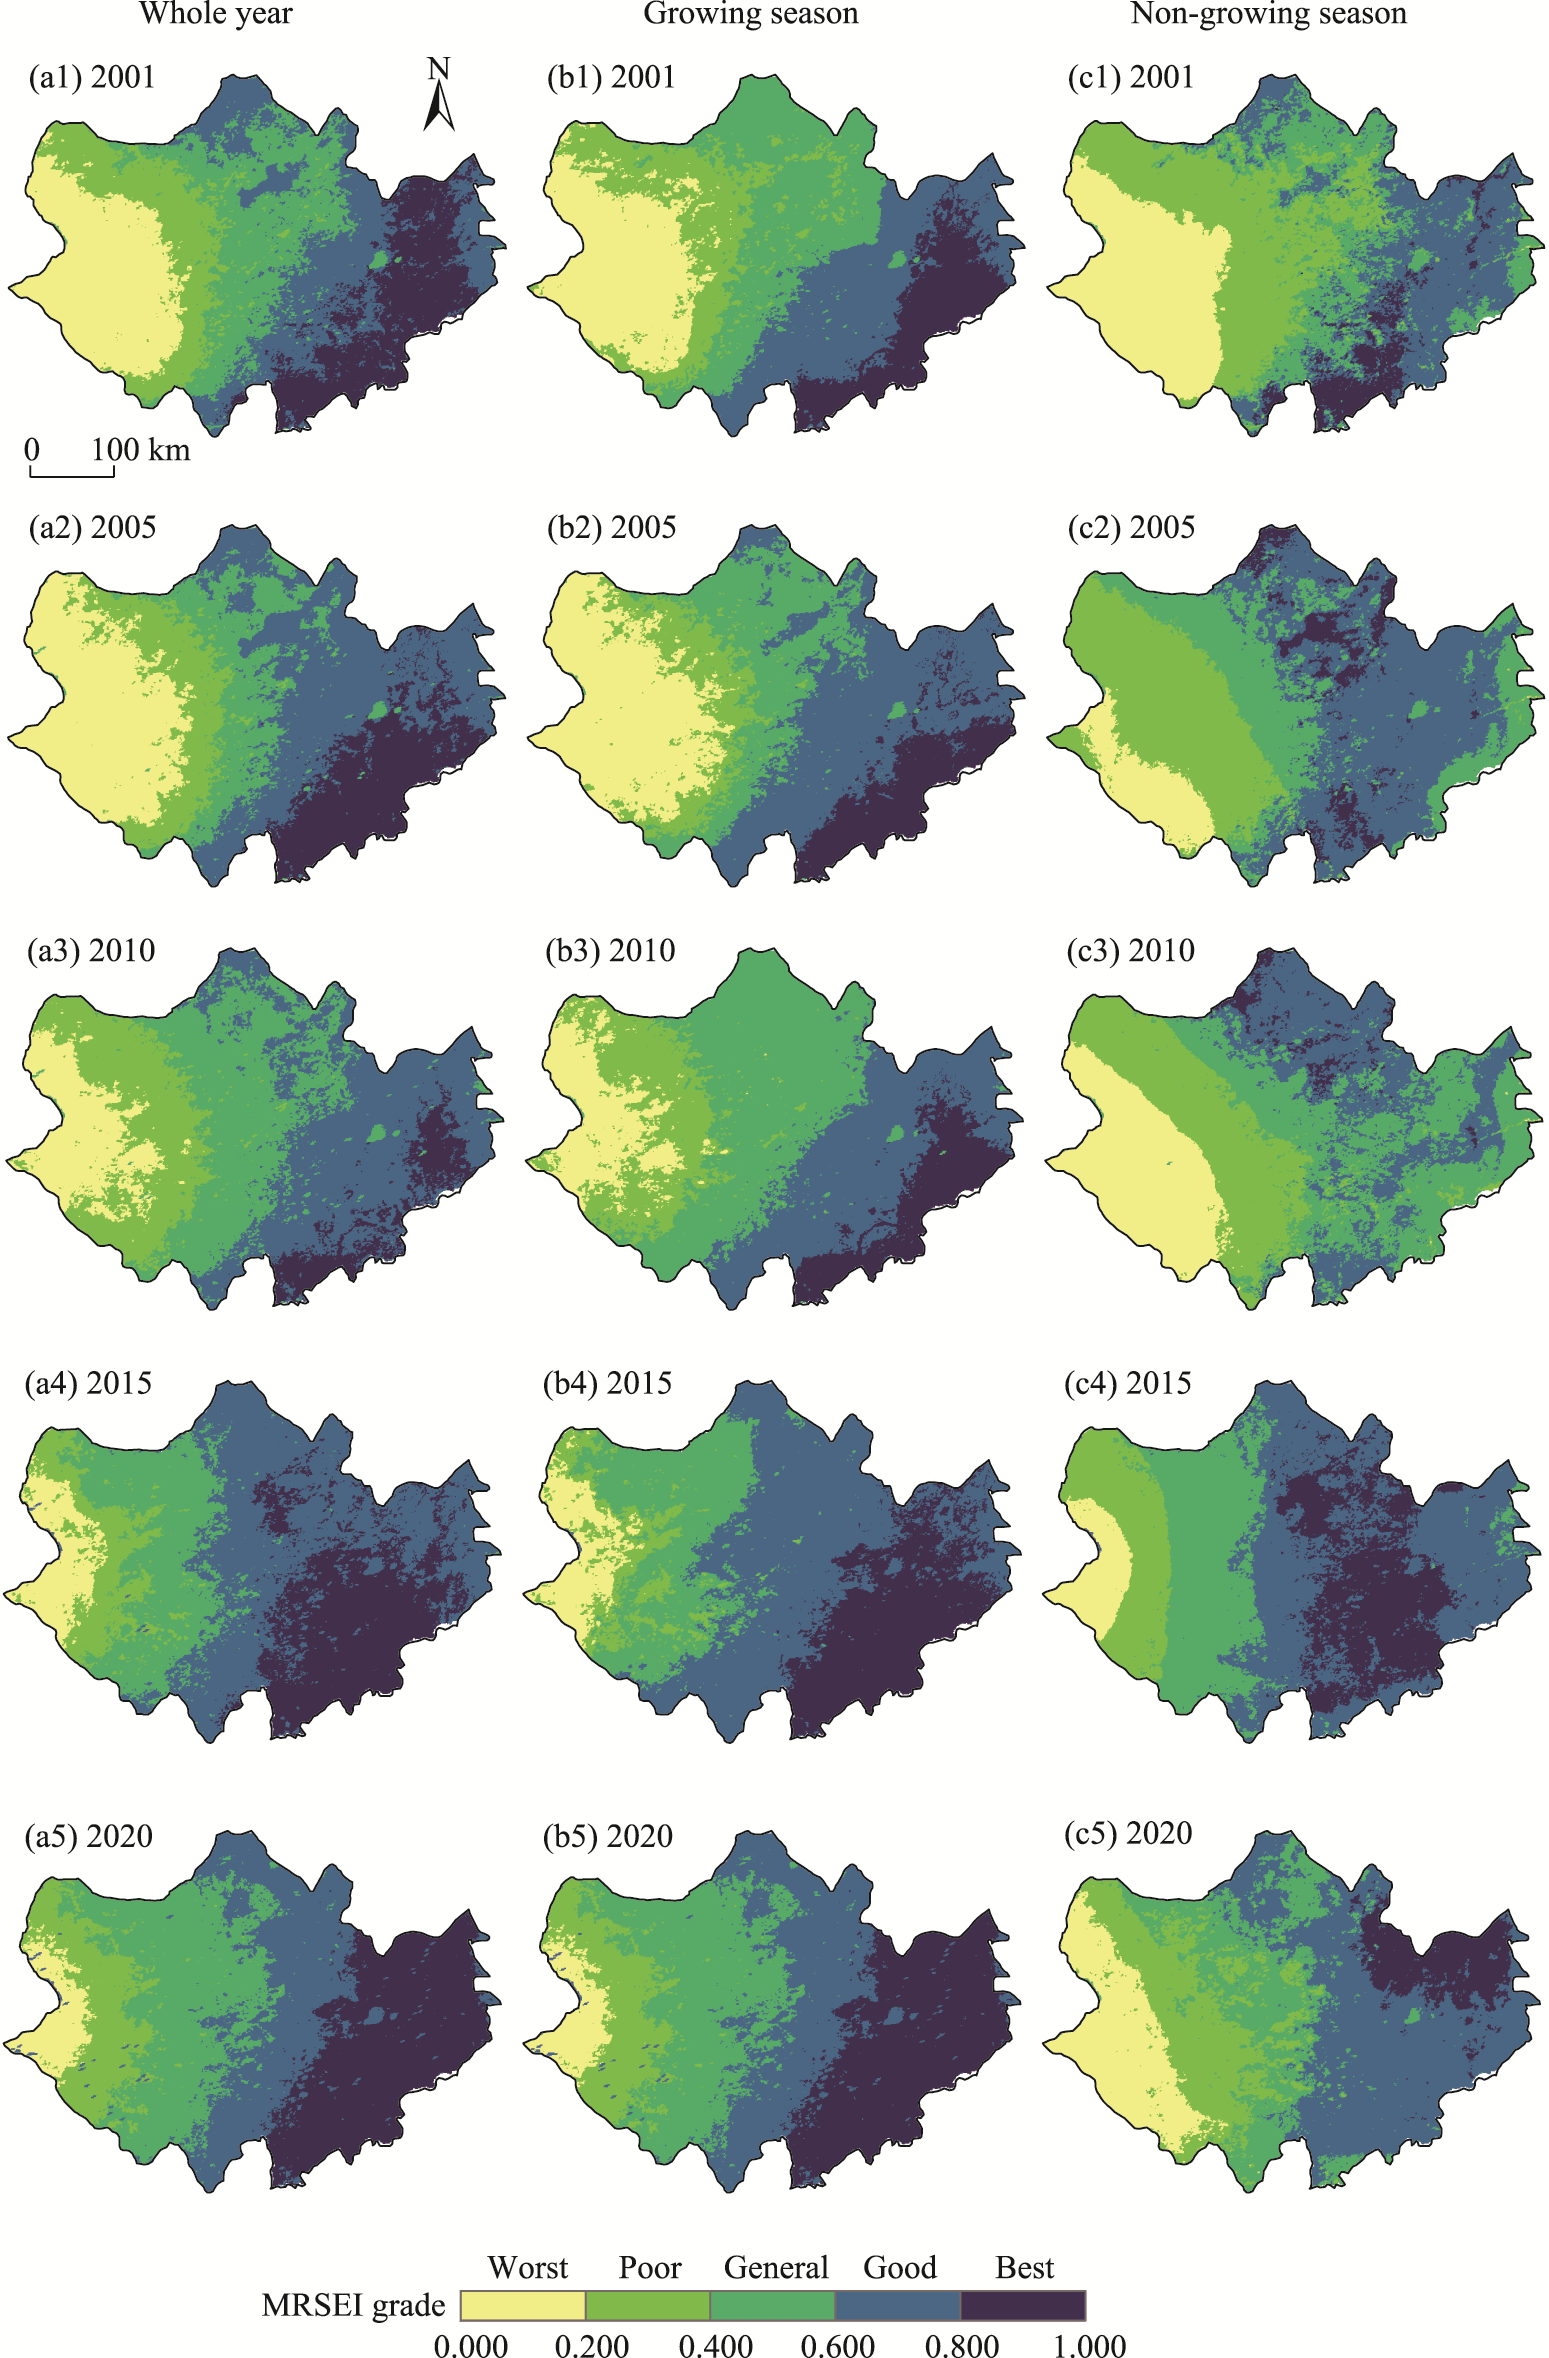
Abstract Otindag Sandy Land in China is an important ecological barrier to Beijing; the changes in its ecological quality are major concerns for sustainable development and planning of this area. Based on principal component analysis and path analysis, we first generated a modified remote sensing ecological index (MRSEI) coupled with satellite and ground observational data during 2001-2020 that integrated four local indicators (greenness, wetness, and heatness that reflect vegetation status, water, and heat conditions, respectively, as well as soil erosion). Then, we assessed the ecological quality in Otindag Sandy Land during 2001-2020 based on the MRSEI at different time scales (i.e., the whole year, growing season, and non-growing season). MRSEI generally increased with an upward rate of 0.006/a during 2001-2020, with clear seasonal and spatial variations. Ecological quality was significantly improved in most regions of Otindag Sandy Land but degraded in the southern part. Regions with ecological degradation expanded to 18.64% of the total area in the non-growing season. The area with the worst grade of MRSEI shrunk by 15.83% of the total area from 2001 to 2020, while the area with the best grade of MRSEI increased by 9.77% of the total area. The temporal heterogeneity of ecological conditions indicated that the improvement process of ecological quality in the growing season may be interrupted or deteriorated in the following non-growing season. The implementation of ecological restoration measures in Otindag Sandy Land should not ignore the seasonal characteristics and spatial heterogeneity of local ecological quality. The results can explore the effectiveness of ecological restoration and provide scientific guides on sustainable development measures for drylands.
|
|
Received: 28 January 2023
Published: 31 August 2023
|
|
Corresponding Authors:
* ZHANG Fangmin (E-mail: Fmin.zhang@nuist.edu.cn)
|
|
|
| [1] |
Allen R G, Pereira L S, Raes D, et al. 1998. Crop evapotranspiration:Guidelines for computing crop requirements. In: FAO Irrigation and Drainage Paper 56. Rome: FAO, 17-25.
|
|
|
| [2] |
Chen J Q, John R, Sun G, et al. 2018. Prospects for the sustainability of social-ecological systems (SES) on the Mongolian Plateau: five critical issues. Environmental Research Letters, 13(12): 123004, doi: 10.1088/1748-9326/aaf27b.
doi: 10.1088/1748-9326/aaf27b
|
|
|
| [3] |
Chen J Q. 2021. Biophysical Models and Applications in Ecosystem Analysis. East Lansing: Michigan State University Press, 89-118.
|
|
|
| [4] |
Chen J Q, John R, Yuan J, et al. 2022. Sustainability challenges for the social-environmental systems across the Asian Drylands Belt. Environmental Research Letters, 17(2): 023001, doi: 10.1088/1748-9326/ac472f.
doi: 10.1088/1748-9326/ac472f
|
|
|
| [5] |
Chen Z F, Wang W G, Fu J Y. 2020. Vegetation response to precipitation anomalies under different climatic and biogeographical conditions in China. Scientific Reports, 10(1): 830, doi: 10.1038/s41598-020-57910-1.
doi: 10.1038/s41598-020-57910-1
pmid: 31965046
|
|
|
| [6] |
Cong W W, Li X Y, Pan X B, et al. 2022. A new scientific framework of dryland ecological quality assessment based on 1OAO principle. Ecological Indicators, 136: 108595, doi: 10.1016/j.ecolind.2022.108595.
doi: 10.1016/j.ecolind.2022.108595
|
|
|
| [7] |
Coutts A M, Harris R J, Phan T, et al. 2016. Thermal infrared remote sensing of urban heat: Hotspots, vegetation, and an assessment of techniques for use in urban planning. Remote Sensing of Environment, 186: 637-651.
doi: 10.1016/j.rse.2016.09.007
|
|
|
| [8] |
Fan Y, Chen J Q, Shirkey G, et al. 2016. Applications of structural equation modeling (SEM) in ecological studies: an updated review. Ecological Processes, 5: 19, doi: 10.1186/s13717-016-0063-3.
doi: 10.1186/s13717-016-0063-3
|
|
|
| [9] |
Fernandes T J G, del Campo A D, Herrera R, et al. 2016. Simultaneous assessment, through sap flow and stable isotopes, of water use efficiency (WUE) in thinned pines shows improvement in growth, tree-climate sensitivity and WUE, but not in WUEi. Forest Ecology and Management, 361: 298-308.
doi: 10.1016/j.foreco.2015.11.029
|
|
|
| [10] |
Fick S E, Hijmans R J. 2017. WorldClim 2: new 1-km spatial resolution climate surfaces for global land areas. International Journal of Climatology, 37(12): 4302-4315.
doi: 10.1002/joc.2017.37.issue-12
|
|
|
| [11] |
Guo B B, Zhang J, Meng X Y, et al. 2020. Long-term spatio-temporal precipitation variations in China with precipitation surface interpolated by ANUSPLIN. Scientific Reports, 10(1): 81, doi: 10.1038/s41598-019-57078-3.
doi: 10.1038/s41598-019-57078-3
pmid: 31919374
|
|
|
| [12] |
Hang X, Li Y C, Luo X C, et al. 2020. Assessing the ecological quality of Nanjing during its urbanization process by using satellite, meteorological, and socioeconomic data. Journal of Meteorological Research, 34(2): 280-293.
doi: 10.1007/s13351-020-9150-6
|
|
|
| [13] |
Huang J, Chen J H, Zhang F M. 2021. Spatio-temporal evolution of climate-induced reduction risk for winter wheat in Anhui Province based on principal component analysis. Chinese Journal of Applied Ecology, 32(9): 3185-3194. (in Chinese)
|
|
|
| [14] |
Hutchinson M F, Xu T. 2013. Anusplin version 4.4 user guide. [2022-03-30]. http://fennerschool.anu.edu.au/files/anusplin44.pdf.
|
|
|
| [15] |
IPCC. 2019. Climate Change and Land: an IPCC special report on climate change, desertification, land degradation, sustainable land management, food security, and greenhouse gas fluxes in terrestrial ecosystems. In: Climate Change and Land. Shukla P R, Skea J, Calvo Buendia E, et al. Geneva: IPCC.
|
|
|
| [16] |
Jiang F, Zhang Y Q, Li J Y, et al. 2021. Research on remote sensing ecological environmental assessment method optimized by regional scale. Environmental Science and Pollution Research, 28(48): 68174-68187.
doi: 10.1007/s11356-021-15262-x
|
|
|
| [17] |
John R, Chen J Q, Ou-Yang Z T, et al. 2013. Vegetation response to extreme climate events on the Mongolian Plateau from 2000 to 2010. Environmental Research Letters, 8(3): 035033, doi: 10.1088/1748-9326/8/3/035033.
doi: 10.1088/1748-9326/8/3/035033
|
|
|
| [18] |
John R, Chen J, Lu N, et al. 2009. Land cover/land use change in semi-arid Inner Mongolia: 1992-2004. Environmental Research Letters, 4(4): 045010, doi: 10.1088/1748-9326/4/4/045010.
doi: 10.1088/1748-9326/4/4/045010
|
|
|
| [19] |
Liu S L, Wang T. 2010. Regionalization for aeolian desertification control and countermeasures in the Otindag Sandy Land Region, China. Journal of Desert Research, 30(5): 999-1005. (in Chinese)
|
|
|
| [20] |
Lou J P, Wang X M, Cai D W. 2019. Spatial and temporal variation of wind erosion climatic erosivity and its response to ENSO in the Otindag Desert, China. Atmosphere, 10: 614, doi: 10.3390/atmos10100614.
doi: 10.3390/atmos10100614
|
|
|
| [21] |
Lu C X, Zhao T Y, Shi X L, et al. 2018. Ecological restoration by afforestation may increase groundwater depth and create potentially large ecological and water opportunity costs in arid and semiarid China. Journal of Cleaner Production, 176: 1213-1222.
doi: 10.1016/j.jclepro.2016.03.046
|
|
|
| [22] |
Ma W Y, Wang X M, Zhou N, et al. 2017. Relative importance of climate factors and human activities in impacting vegetation dynamics during 2000-2015 in the Otindag Sandy Land, northern China. Journal of Arid Land, 9(4): 558-567.
|
|
|
| [23] |
Mamat Z, Halik Ü, Keyimu M, et al. 2018. Variation of the floodplain forest ecosystem service value in the lower reaches of Tarim River, China. Land Degradation & Development, 29(1): 47-57.
doi: 10.1002/ldr.2835
|
|
|
| [24] |
Masroor M, Sajjad H, Rehman S, et al. 2022. Analysing the relationship between drought and soil erosion using vegetation health index and RUSLE models in Godavari middle sub-basin, India. Geoscience Frontiers, 13(2): 101312, doi: 10.1016/j.gsf.2021.101312.
doi: 10.1016/j.gsf.2021.101312
|
|
|
| [25] |
Niu L N, Shao Q Q, Ning J, et al. 2023. The assessment of ecological restoration effects on Beijing-Tianjin Sandstorm Source Control Project area during 2000-2019. Ecological Engineering, 186: 106831, doi: 10.1016/j.ecoleng.2022.106831.
doi: 10.1016/j.ecoleng.2022.106831
|
|
|
| [26] |
Priyadarshi N, Chowdary V M, Srivastava Y K, et al. 2018. Reconstruction of time series MODIS EVI data using de-noising algorithms. Geocarto International, 33(10): 1095-1113.
doi: 10.1080/10106049.2017.1333535
|
|
|
| [27] |
Qureshi S, Alavipanah S K, Konyushkova M, et al. 2020. A remotely sensed assessment of surface ecological change over the Gomishan Wetland, Iran. Remote Sensing, 12(18): 2989, doi: 10.3390/rs12182989.
doi: 10.3390/rs12182989
|
|
|
| [28] |
Shao W Y, Wang Q Z, Guan Q Y, et al. 2022. Distribution of soil available nutrients and their response to environmental factors based on path analysis model in arid and semi-arid area of northwest China. Science of The Total Environment, 827: 154254, doi: 10.1016/j.scitotenv.2022.154254.
doi: 10.1016/j.scitotenv.2022.154254
|
|
|
| [29] |
Shi L, Zhang Z J, Zhang C Y, et al. 2004. Effects of sand burial on survival, growth, gas exchange and biomass allocation of Ulmus pumila seedlings in the Hunshandak Sandland, China. Annals of Botany, 94(4): 553-560.
doi: 10.1093/aob/mch174
pmid: 15329332
|
|
|
| [30] |
Sun B, Wang Y, Li Z Y, et al. 2019. Estimating soil organic carbon density in the Otindag Sandy Land, Inner Mongolia, China, for modelling spatiotemporal variations and evaluating the influences of human activities. CATENA, 179: 85-97.
doi: 10.1016/j.catena.2019.03.034
|
|
|
| [31] |
Tang L P, Ke X L, Chen Y Y, et al. 2021. Which impacts more seriously on natural habitat loss and degradation? Cropland expansion or urban expansion? Land Degradation & Development, 32(2): 946-964.
|
|
|
| [32] |
Tian Q J, Min X J. 1998. Advances in study on vegetation indices. Advances in Earth Science, 13(4): 327-333. (in Chinese)
doi: 10.11867/j.issn.1001-8166.1998.04.0327
|
|
|
| [33] |
Toy T J, Osterkamp W R. 1995. The applicability of RUSLE to geomorphic studies. Journal of Soil and Water Conservation, 50(5): 498-503.
|
|
|
| [34] |
Wang J, Ma J L, Xie F F, et al. 2020. Improvement of remote sensing ecological index in arid regions: Taking Ulan Buh Desert as an example. Chinese Journal of Applied Ecology, 31(11): 3795-3804. (in Chinese)
doi: 10.13287/j.1001-9332.202011.011
|
|
|
| [35] |
Wang J, Liu D X, Ma J L, et al. 2021. Development of a large-scale remote sensing ecological index in arid areas and its application in the Aral Sea Basin. Journal of Arid Land, 13(1): 40-55.
doi: 10.1007/s40333-021-0052-y
|
|
|
| [36] |
Wang X M, Lou J P, Ma W Y, et al. 2017. The impact of reclamation on aeolian desertification of four species in the Otindag Desert, China. CATENA, 157: 189-194.
doi: 10.1016/j.catena.2017.05.024
|
|
|
| [37] |
Wei W, Shi S N, Zhang X Y, et al. 2020. Regional-scale assessment of environmental vulnerability in an arid inland basin. Ecological Indicators, 109: 105792, doi: 10.1016/j.ecolind.2019.105792.
doi: 10.1016/j.ecolind.2019.105792
|
|
|
| [38] |
Wen H, Chen J Q, Wang Z F. 2020. Disproportioned performances of protected areas in the Beijing-Tianjin-Hebei Region. Sustainability, 12(16), 6404, doi: 10.3390/su12166404.
doi: 10.3390/su12166404
|
|
|
| [39] |
Wu R N, Cong W W, Li Y H, et al. 2019. The scientific conceptual framework for ecological quality of the dryland ecosystem: Concepts, indicators, monitoring and assessment. Journal of Resources and Ecology, 10(2): 196-201.
doi: 10.5814/j.issn.1674-764X.2019.02.010
|
|
|
| [40] |
Wu S P, Gao X, Lei J Q, et al. 2022. Ecological environment quality evaluation of the Sahel region in Africa based on remote sensing ecological index. Journal of Arid Land, 14(1): 14-33.
doi: 10.1007/s40333-022-0057-1
|
|
|
| [41] |
Wu Z T, Wu J J, Liu J H, et al. 2013. Increasing terrestrial vegetation activity of ecological restoration program in the Beijing-Tianjin Sand Source Region of China. Ecological Engineering, 52: 37-50.
doi: 10.1016/j.ecoleng.2012.12.040
|
|
|
| [42] |
Xu H Q. 2013. A remote sensing index for assessment of regional ecological changes. China Environmental Science, 33(5): 889-897. (in Chinese)
|
|
|
| [43] |
Xu H Q, Wang M Y, Shi T T, et al. 2018. Prediction of ecological effects of potential population and impervious surface increases using a remote sensing based ecological index (RSEI). Ecological Indicators, 93: 730-740.
doi: 10.1016/j.ecolind.2018.05.055
|
|
|
| [44] |
Xu H Q, Wang Y F, Guan H D, et al. 2019. Detecting ecological changes with a remote sensing based ecological index (RSEI) produced time series and change vector analysis. Remote Sensing, 11(20): 2345, doi: 10.3390/rs11202345.
doi: 10.3390/rs11202345
|
|
|
| [45] |
Xu L L, Yu G M, Zhang W J, et al. 2020. Change features of time-series climate variables from 1962 to 2016 in Inner Mongolia, China. Journal of Arid Land, 12(1): 58-72.
doi: 10.1007/s40333-019-0124-4
|
|
|
| [46] |
Yang X Y, Meng F, Fu P J, et al. 2022a. Time-frequency optimization of RSEI: A case study of Yangtze River Basin. Ecological Indicators, 141: 109080, doi: 10.1016/j.ecolind.2022.109080.
doi: 10.1016/j.ecolind.2022.109080
|
|
|
| [47] |
Yang X Y, Meng F, Fu P J, et al. 2022b. Instability of remote sensing ecological index and its optimisation for time frequency and scale. Ecological Informatics, 72: 101870, doi: 10.1016/j.ecoinf.2022.101870.
doi: 10.1016/j.ecoinf.2022.101870
|
|
|
| [48] |
Yao K X, Halike A, Chen L M, et al. 2022. Spatiotemporal changes of eco-environmental quality based on remote sensing-based ecological index in the Hotan Oasis, Xinjiang. Journal of Arid Land, 14(3): 262-283.
doi: 10.1007/s40333-022-0011-2
|
|
|
| [49] |
Ye X, Kuang H H. 2022. Evaluation of ecological quality in southeast Chongqing based on modified remote sensing ecological index. Scientific Reports, 12(1): 15694, doi: 10.1038/s41598-022-19851-9.
doi: 10.1038/s41598-022-19851-9
pmid: 36127382
|
|
|
| [50] |
Yuan Z H, Bao G, Yin S, et al. 2016. Vegetation changes in Otindag sand country during 2000-2014. Acta Prataculturae Sinica, 25(1): 33-46. (in Chinese)
|
|
|
| [51] |
Zhang Q, Yang Z S, Hao X C, et al. 2019. Conversion features of evapotranspiration responding to climate warming in transitional climate regions in northern China. Climate Dynamics, 52(7): 3891-3903.
doi: 10.1007/s00382-018-4364-3
|
|
|
| [52] |
Zhao X, Wang P, Yasir M, et al. 2022. Decision support system based on spatial and temporal pattern evolution of ecological environmental quality in the Yellow River Delta from 2000 to 2020. Soft Computing, 26(20): 11033-11044.
doi: 10.1007/s00500-022-07399-9
|
|
|
| [53] |
Zhao X H, Zhang F M, Han D C, et al. 2021. Evapotranspiration changes and its attribution in semi-arid regions of Inner Mongolia. Arid Zone Reseaech, 38(6): 1614-1623. (in Chinese)
|
|
|
| [54] |
Zheng Z H, Wu Z F, Chen Y B, et al. 2022. Instability of remote sensing based ecological index (RSEI) and its improvement for time series analysis. Science of The Total Environment, 814: 152595, doi: 10.1016/j.scitotenv.2021.152595.
doi: 10.1016/j.scitotenv.2021.152595
|
|
|
| [55] |
Zhu D Y, Chen T, Wang Z W, et al. 2021. Detecting ecological spatial-temporal changes by Remote Sensing Ecological Index with local adaptability. Journal of Environmental Management, 299: 113655, doi: 10.1016/j.jenvman.2021.113655.
doi: 10.1016/j.jenvman.2021.113655
|
|
|
| [56] |
Zhuang Q W, Shao Z F, Huang X, et al. 2021. Evolution of soil salinization under the background of landscape patterns in the irrigated northern slopes of Tianshan Mountains, Xinjiang, China. CATENA, 206: 105561, doi: 10.1016/j.catena.2021.105561.
doi: 10.1016/j.catena.2021.105561
|
|
|
|
Viewed |
|
|
|
Full text
|
|
|
|
|
Abstract
|
|
|
|
|
Cited |
|
|
|
|
| |
Shared |
|
|
|
|
| |
Discussed |
|
|
|
|