| Research article |
|

|
|
|
| Temporal and spatial variation and prediction of water yield and water conservation in the Bosten Lake Basin based on the PLUS-InVEST model |
CHEN Jiazhen1,2, KASIMU Alimujiang1,2,*( ), REHEMAN Rukeya3, WEI Bohao1, HAN Fuqiang1, ZHANG Yan1 ), REHEMAN Rukeya3, WEI Bohao1, HAN Fuqiang1, ZHANG Yan1 |
1School of Geography and Tourism, Xinjiang Normal University, Urumqi 830054, China
2Xinjiang Key Laboratory of Lake Environment and Resources in Arid Zone, Urumqi 830054, China
3School of Geography and Tourism, Shaanxi Normal University, Xi'an 710062, China |
|
|
|
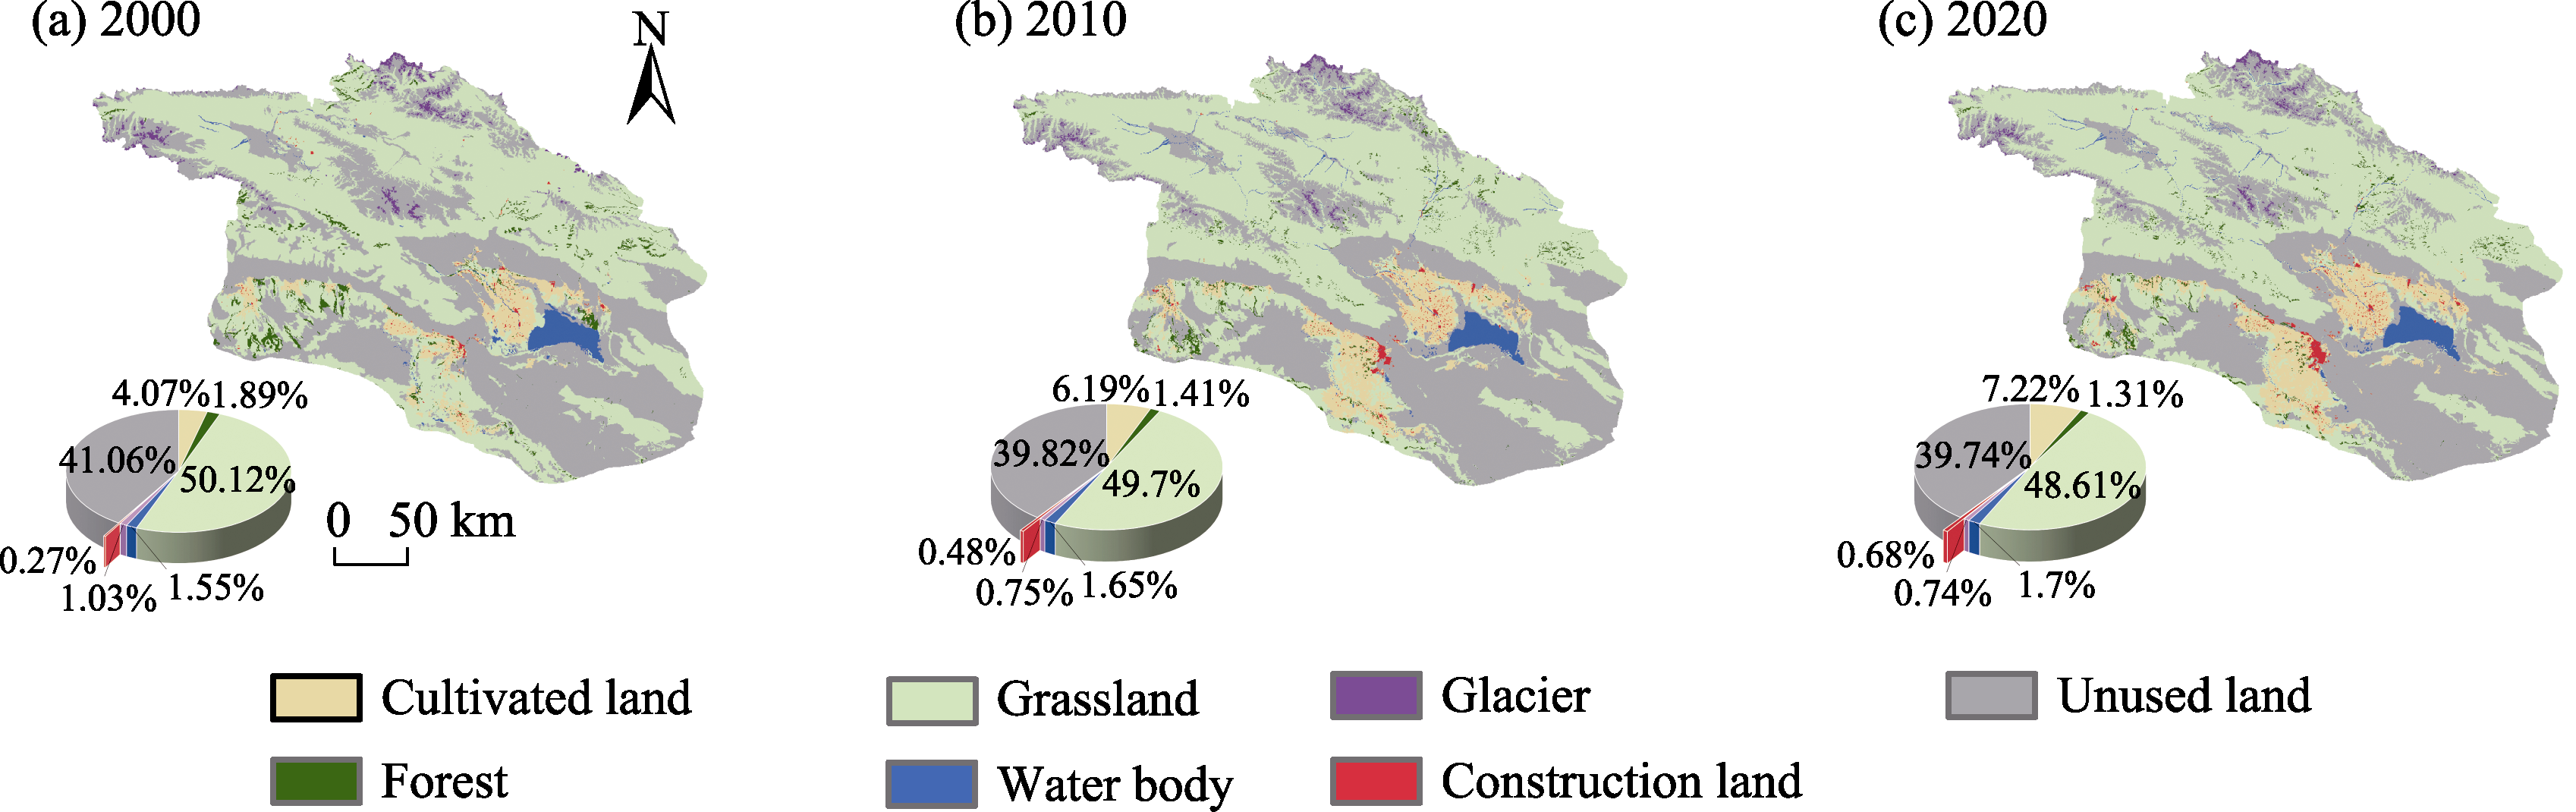
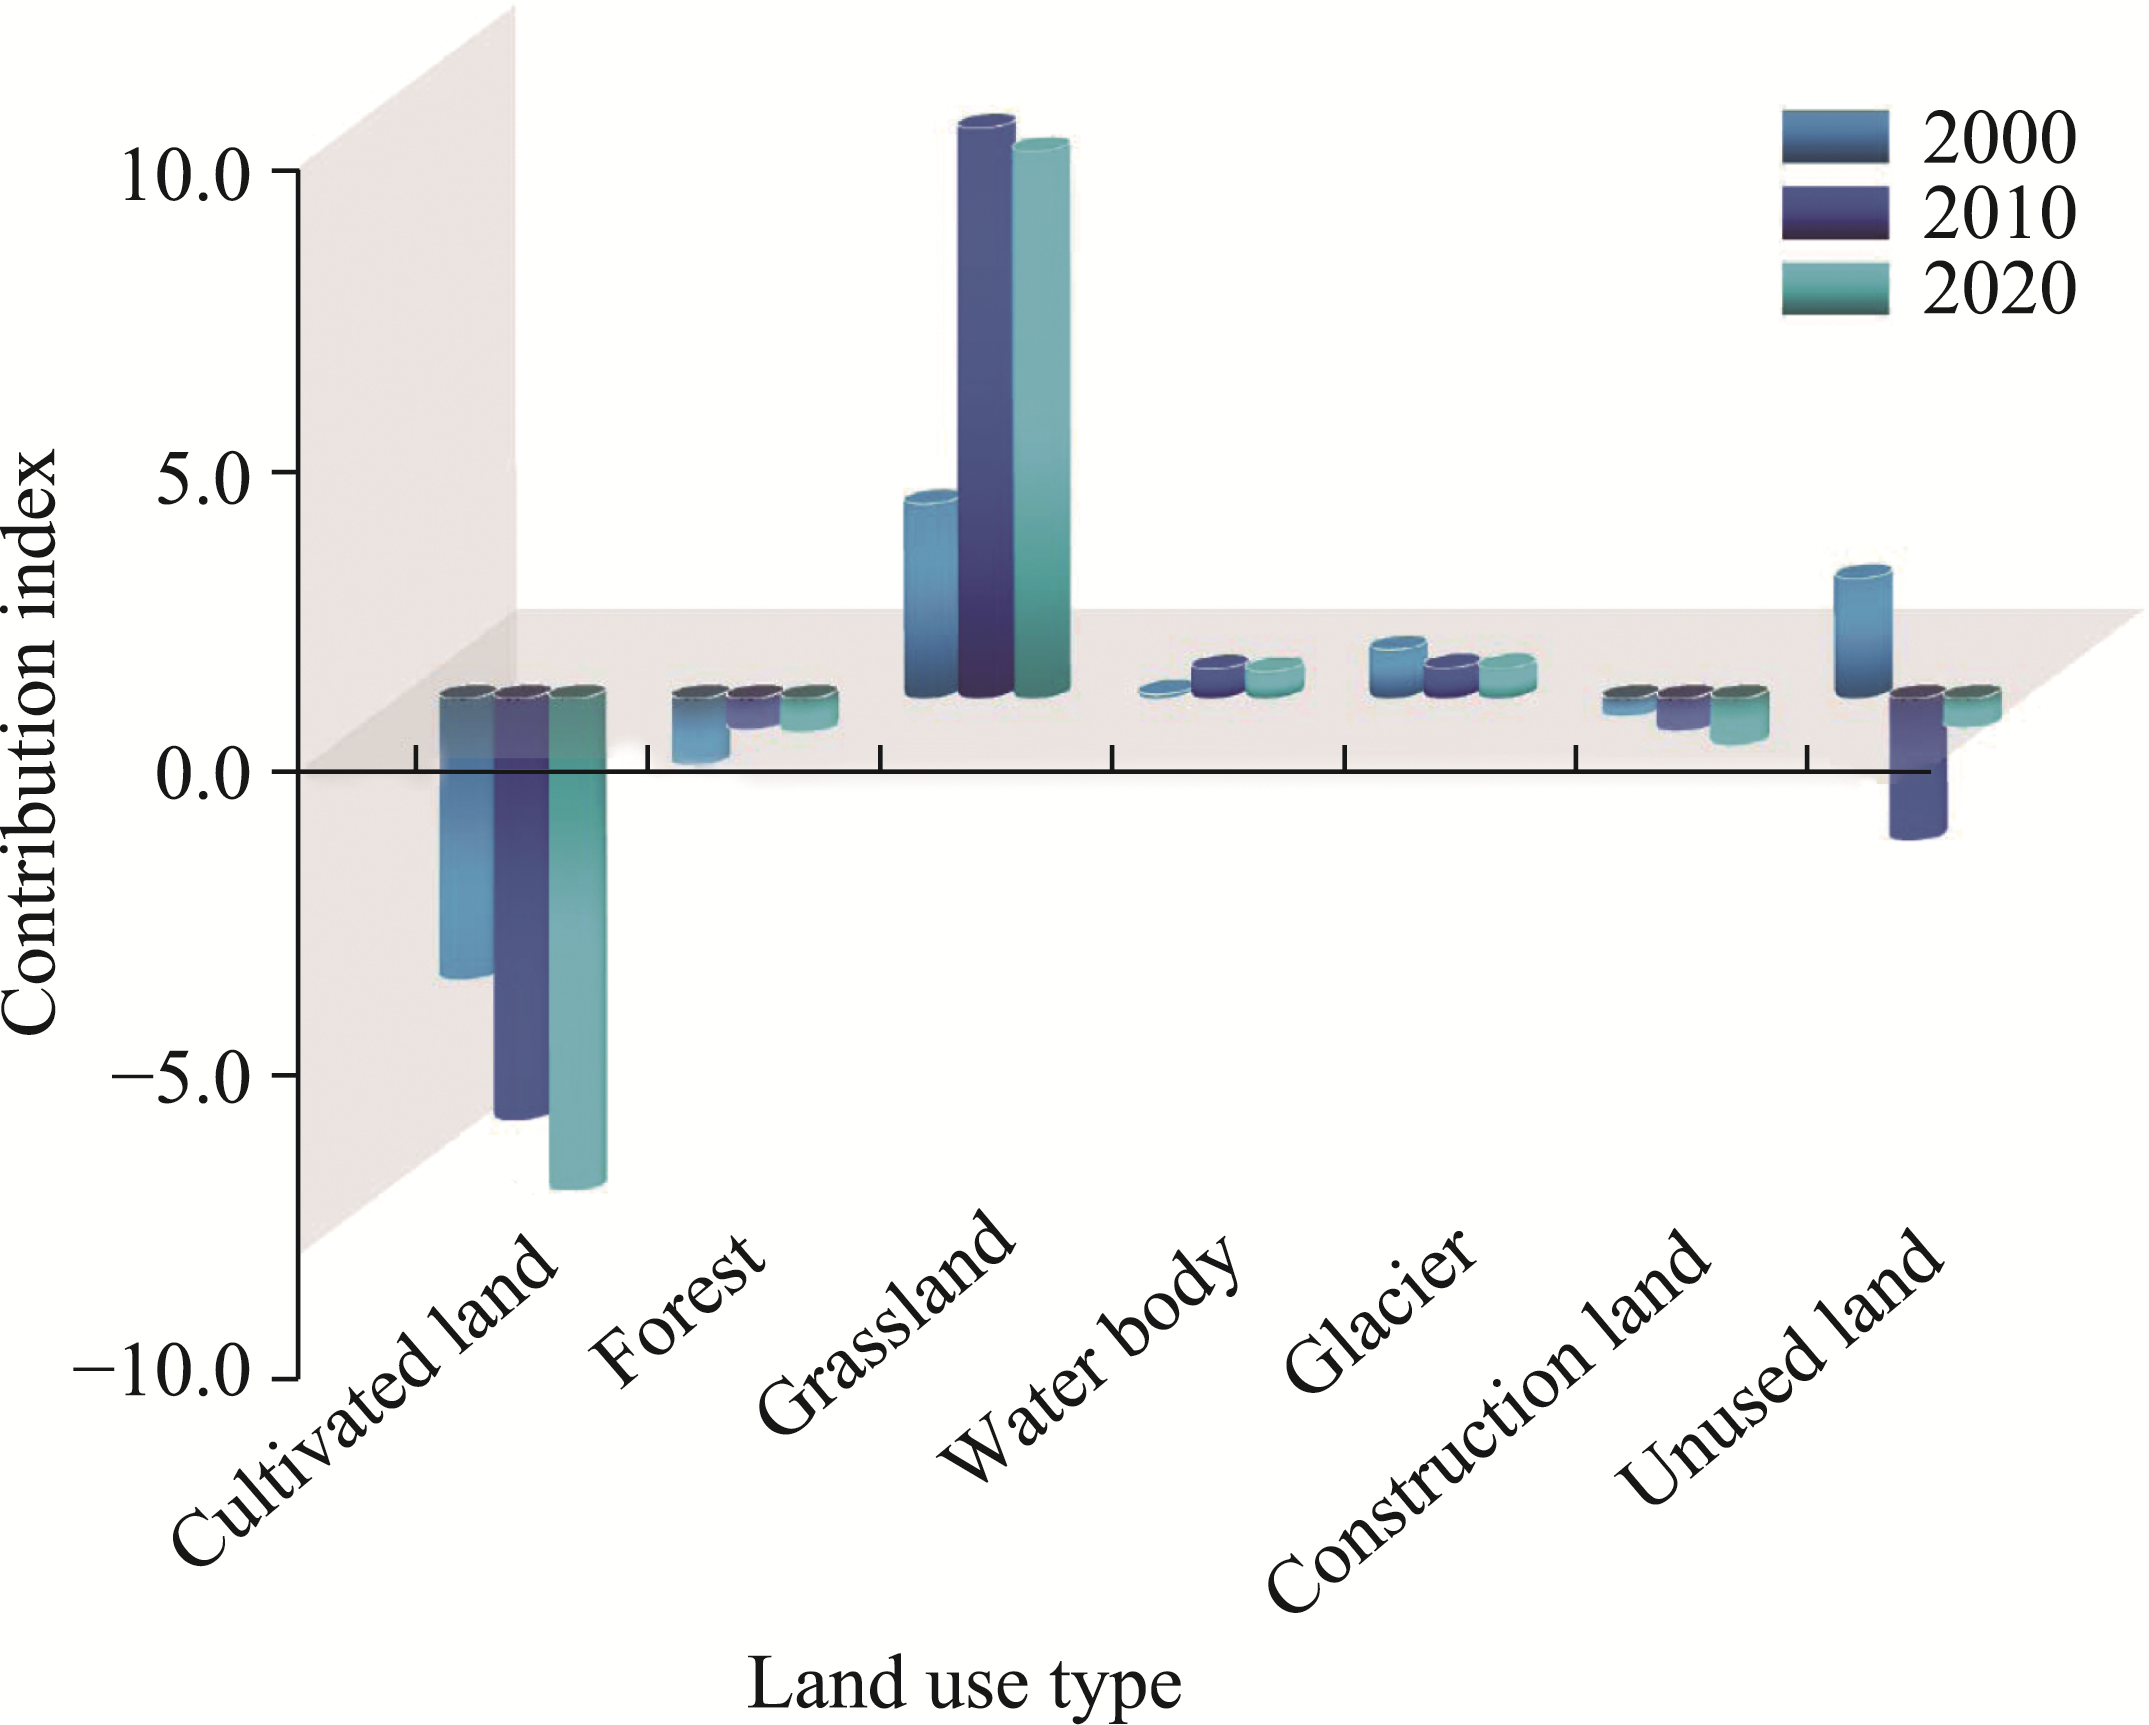
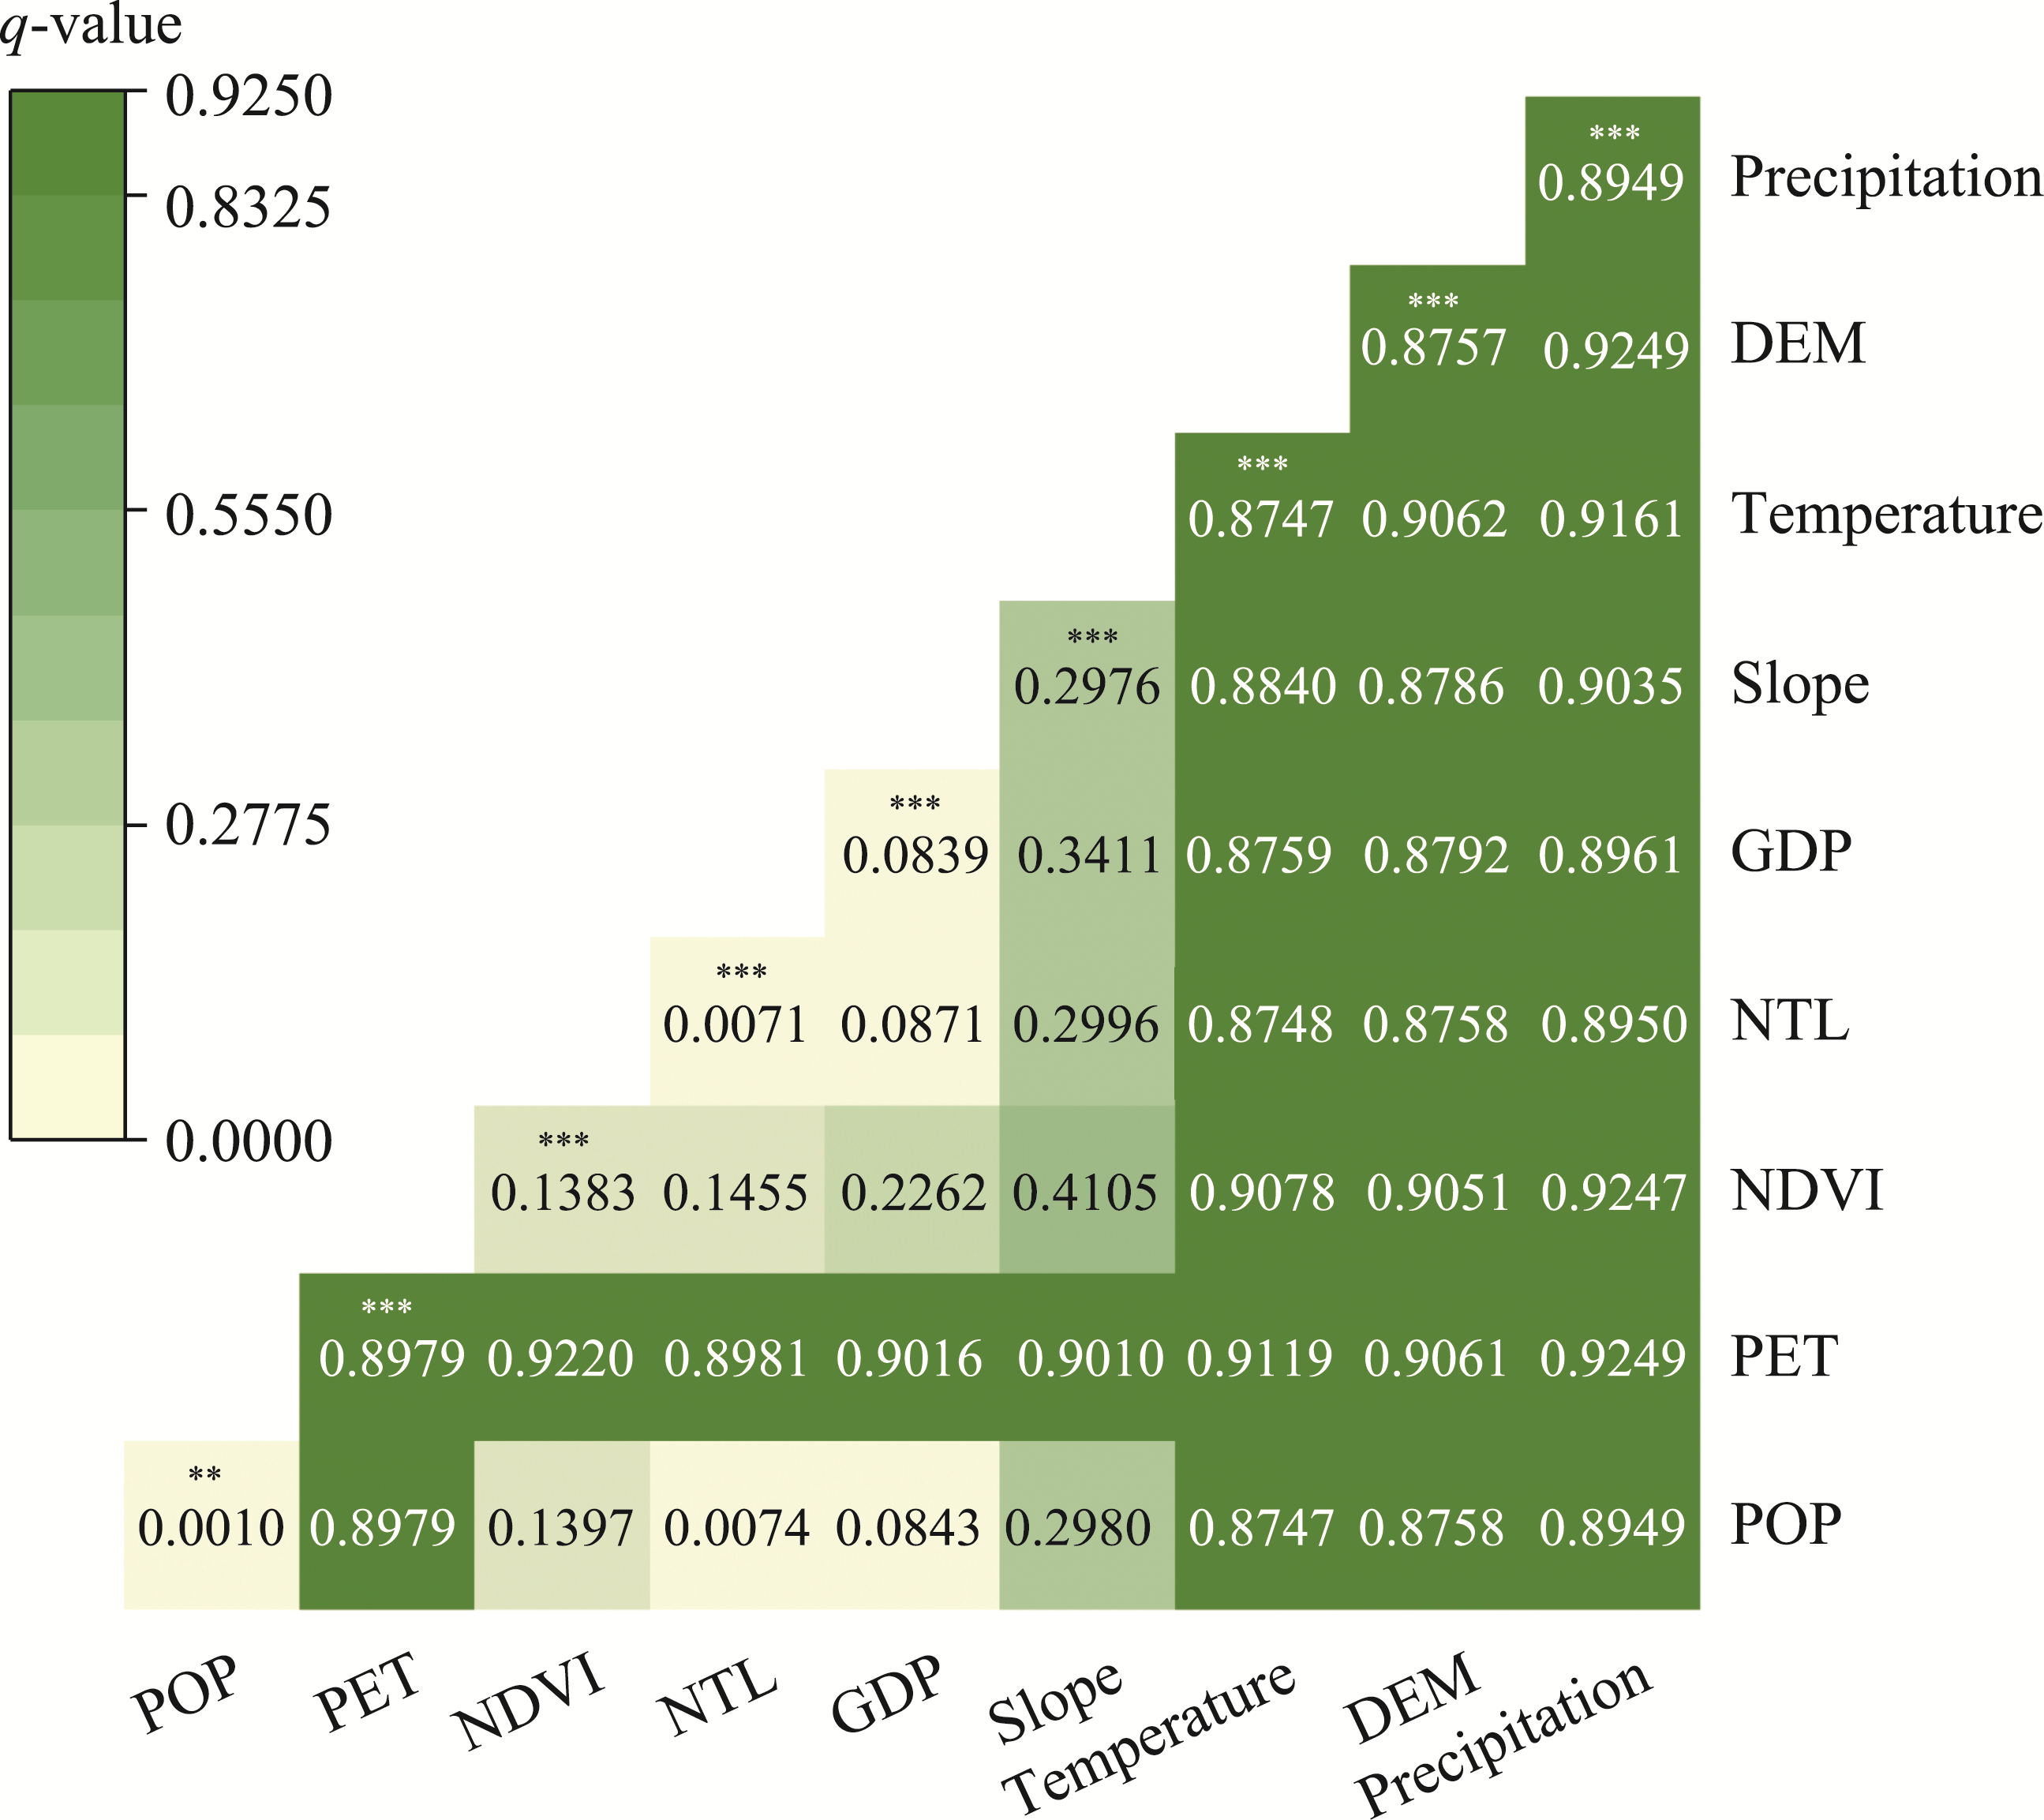
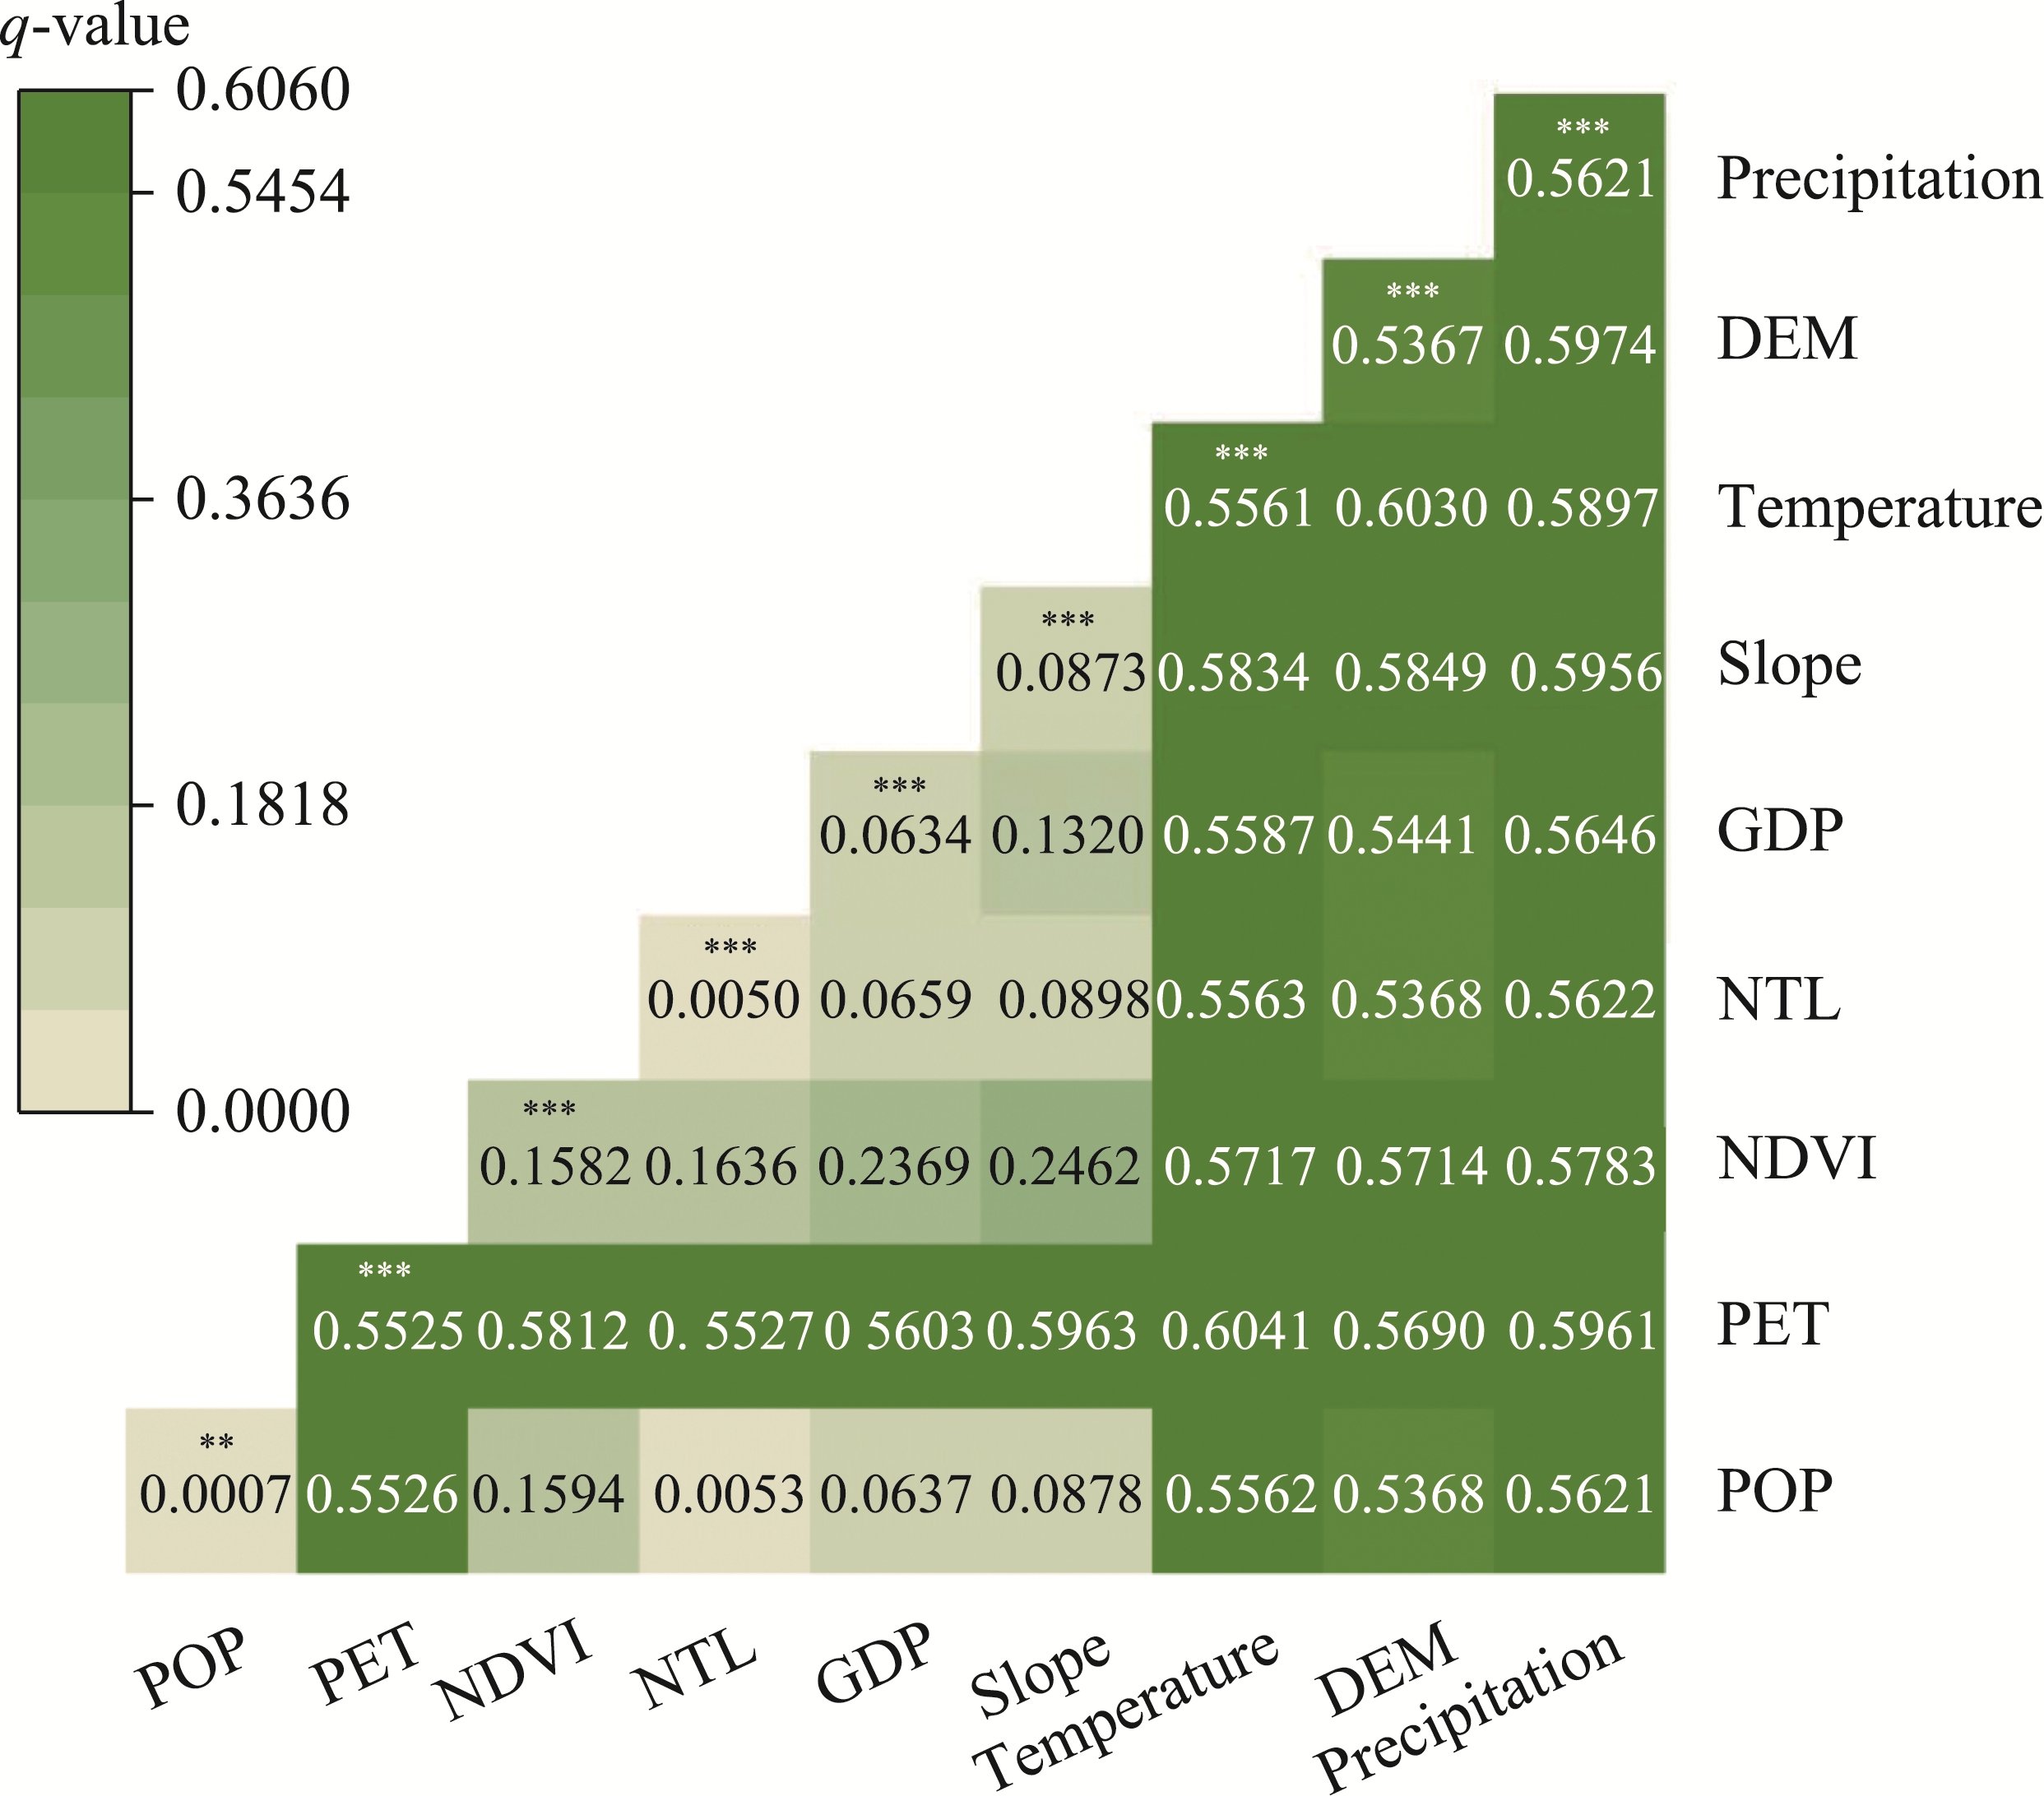
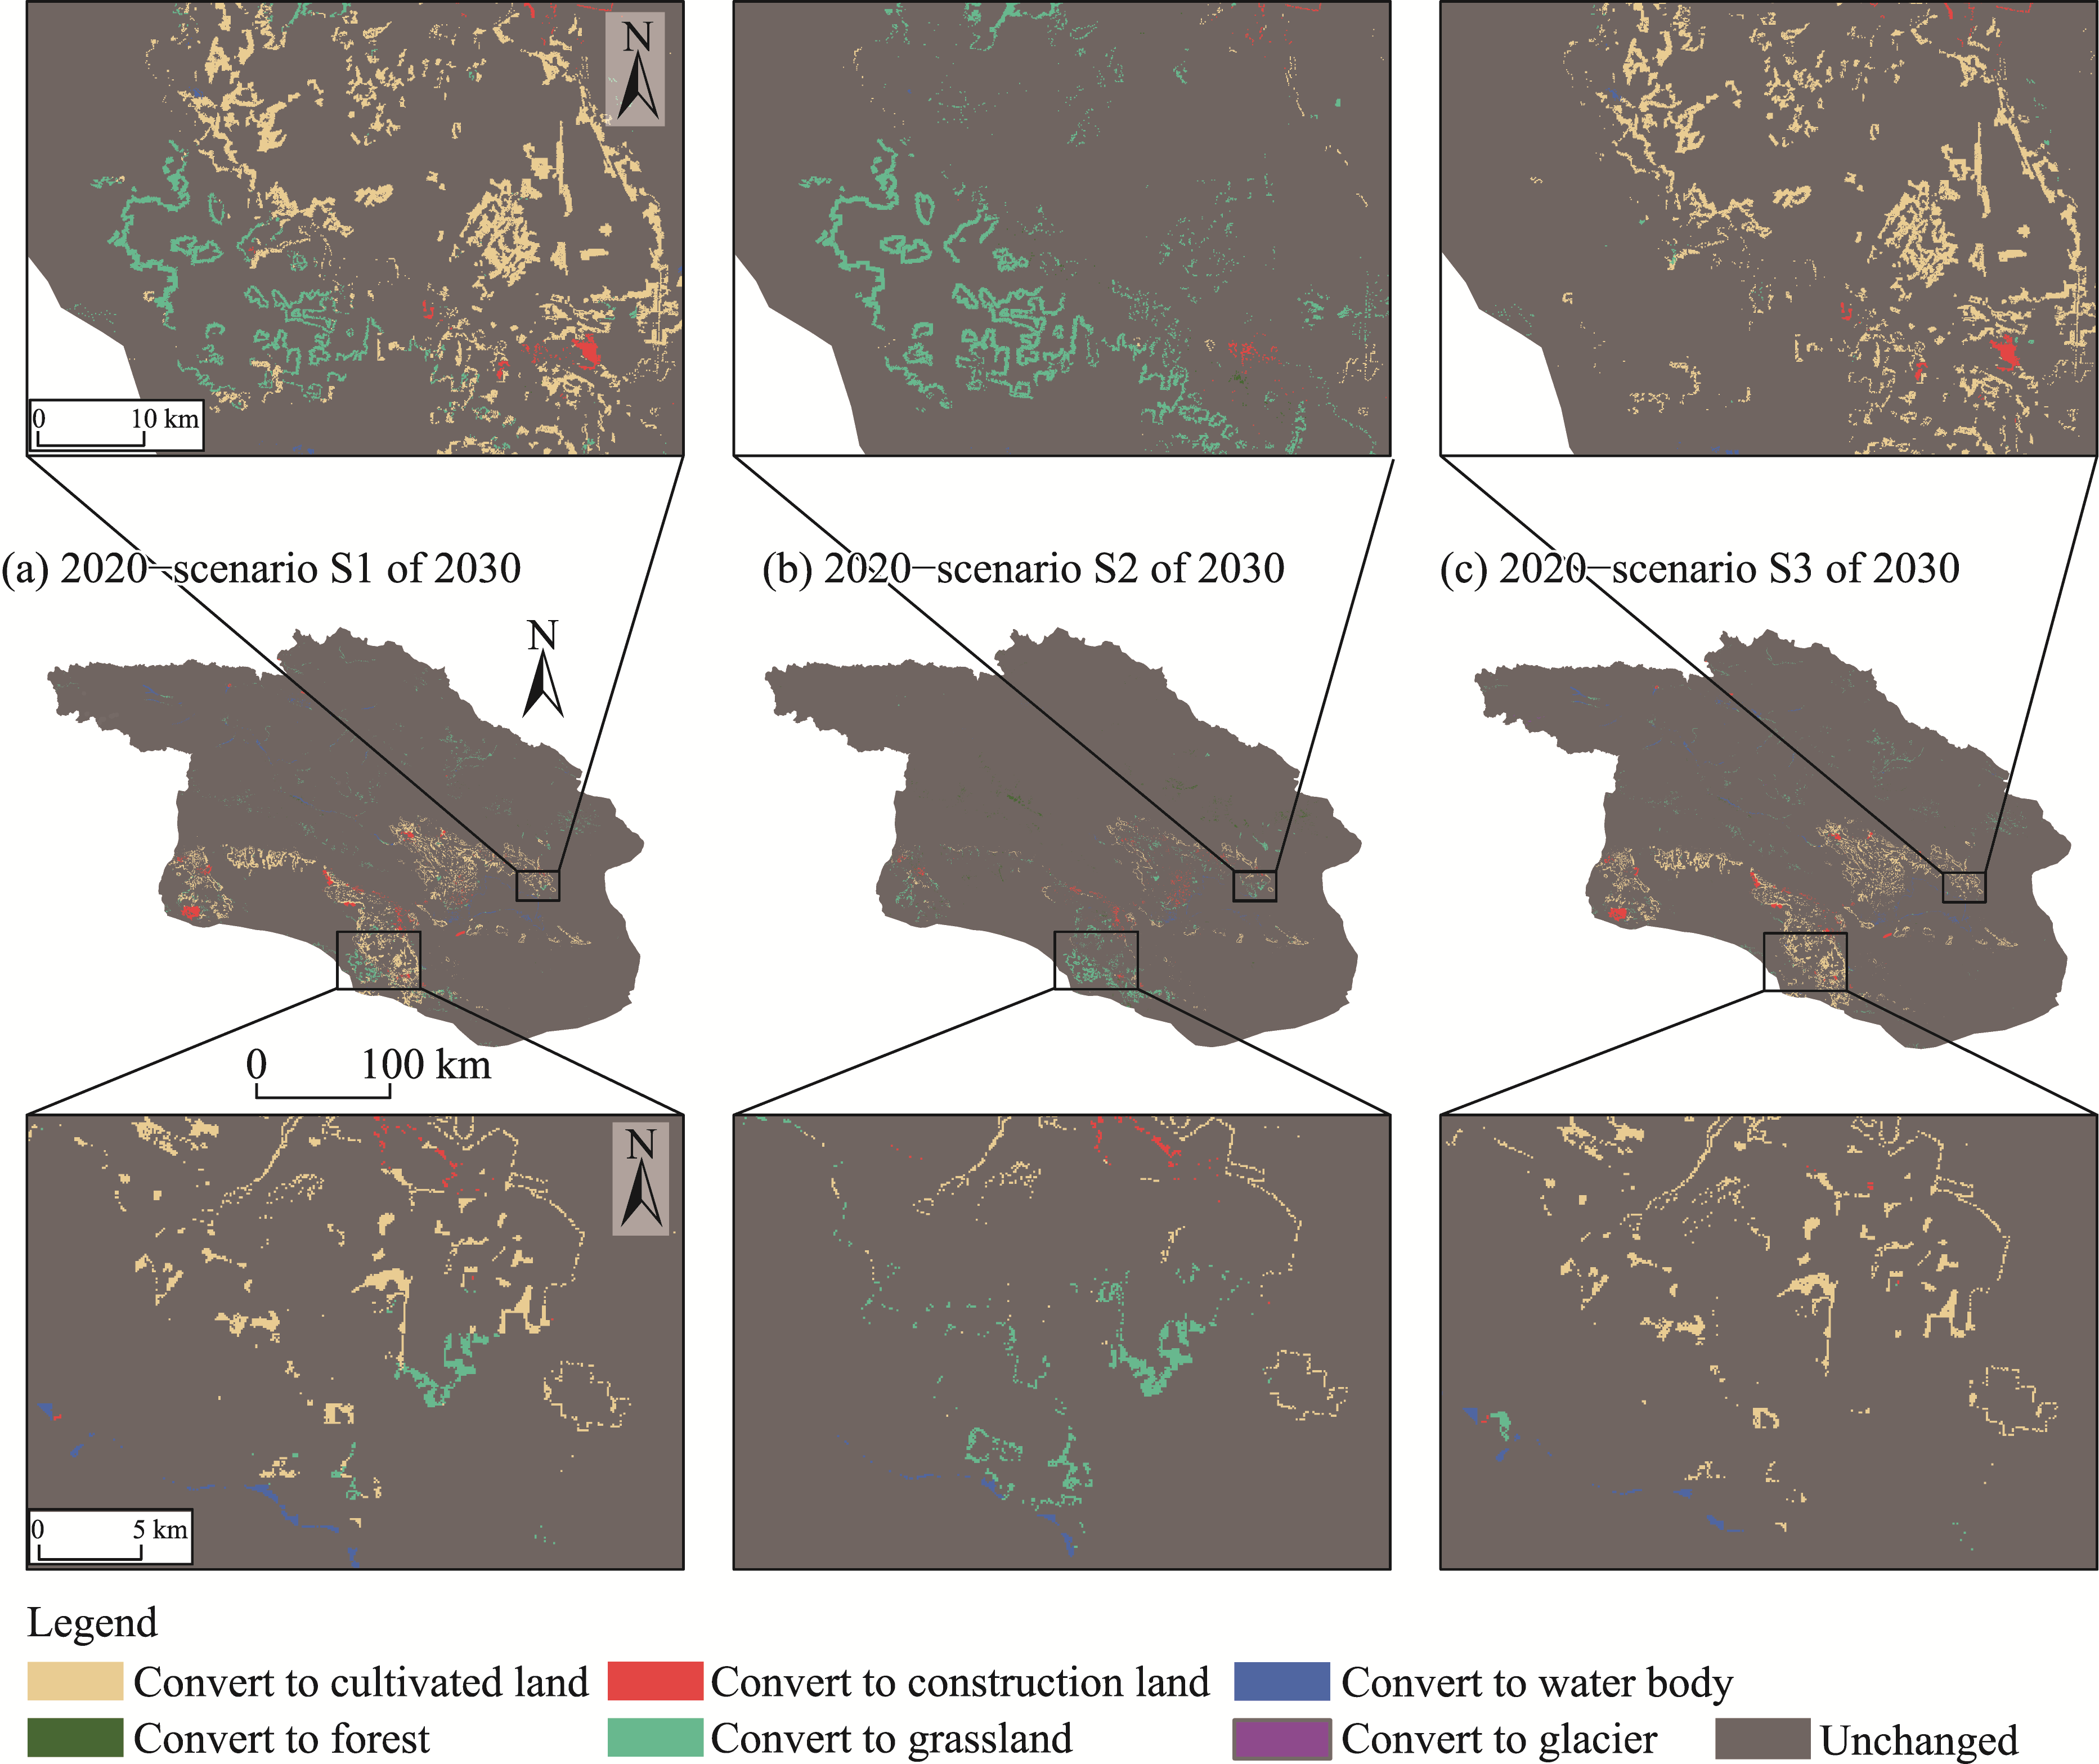
Abstract To comprehensively evaluate the alterations in water ecosystem service functions within arid watersheds, this study focused on the Bosten Lake Basin, which is situated in the arid region of Northwest China. The research was based on land use/land cover (LULC), natural, socioeconomic, and accessibility data, utilizing the Patch-level Land Use Simulation (PLUS) and Integrated Valuation of Ecosystem Services and Tradeoffs (InVEST) models to dynamically assess LULC change and associated variations in water yield and water conservation. The analyses included the evaluation of contribution indices of various land use types and the investigation of driving factors that influence water yield and water conservation. The results showed that the change of LULC in the Bosten Lake Basin from 2000 to 2020 showed a trend of increasing in cultivated land and construction land, and decreasing in grassland, forest, and unused land. The unused land of all the three predicted scenarios of 2030 (S1, a natural development scenario; S2, an ecological protection scenario; and S3, a cultivated land protection scenario) showed a decreasing trend. The scenarios S1 and S3 showed a trend of decreasing in grassland and increasing in cultivated land; while the scenario S2 showed a trend of decreasing in cultivated land and increasing in grassland. The water yield of the Bosten Lake Basin exhibited an initial decline followed by a slight increase from 2000 to 2020. The areas with higher water yield values were primarily located in the northern section of the basin, which is characterized by higher altitude. Water conservation demonstrated a pattern of initial decrease followed by stabilization, with the northeastern region demonstrating higher water conservation values. In the projected LULC scenarios of 2030, the estimated water yield under scenarios S1 and S3 was marginally greater than that under scenario S2; while the level of water conservation across all three scenarios remained rather consistent. The results showed that Hejing County is an important water conservation function zone, and the eastern part of the Xiaoyouledusi Basin is particularly important and should be protected. The findings of this study offer a scientific foundation for advancing sustainable development in arid watersheds and facilitating efficient water resource management.
|
|
Received: 26 February 2024
Published: 30 June 2024
|
|
Corresponding Authors:
*KASIMU Alimujiang (E-mail: alimkasim@xjnu.edu.cn)
|
|
|
| [1] |
Aghsaei H, Mobarghaee Dinan N, Moridi A, et al. 2020. Effects of dynamic land use/land cover change on water resources and sediment yield in the Anzali wetland catchment, Gilan, Iran. Science of the Total Environment, 712: 136449, doi: 10.1016/j.scitotenv.2019.136449.
|
|
|
| [2] |
Allen R G, Pereira L S, Raes D, et al. 1998. FAO Irrigation and Drainage Paper No. 56—Crop Evapotranspiration (Guidelines for Computing Crop Water Requirements). Rome: FAO (Food and Agriculture Organization of the United Nations), 156.
|
|
|
| [3] |
An L, Zhong S, Shen L. 2022. Dynamic effects of climate and land use policies on water yield in drylands—A case study in the northwest of China. Water, 14: 3940, doi: 10.3390/w14233940.
|
|
|
| [4] |
Baw-puh F. 1981. On the calculation of the evaporation from land surface. Chinese Journal of Atmospheric Science, 5(1): 23-31. (in Chinese)
|
|
|
| [5] |
Cao Y J, Ma Y G, Bao A M, et al. 2023. Evaluation of the water conservation function in the Ili River Delta of Central Asia based on the InVEST model. Journal of Arid Land, 15(12): 1455-1473.
doi: 10.1007/s40333-023-0074-8
|
|
|
| [6] |
Chen H B, Wang T X, An J, et al. 2023. Changes of glacier area in Kaidu River Basin and its contribution to runoff during melting seasons. Journal of China Hydrology, doi: 10.19797/j.cnki.1000-0852.20230131. (in Chinese)
|
|
|
| [7] |
Chen S X, Rusuli Y, Zhang F, et al. 2022. Impacts of climate change and human activities on runoff in the upper reaches of Kaidu River based on SWAT model. Hubei Agricultural Sciences, 61(5): 171-176. (in Chinese)
|
|
|
| [8] |
Cosby B J, Hornberger G M, Clapp R B, et al. 1984. A statistical exploration of the relationships of soil moisture characteristics to the physical properties of soils. Water Resources Research, 20(6): 682-690.
|
|
|
| [9] |
Dixon A P, Faber-Langendoen D, Josse C, et al. 2014. Distribution mapping of world grassland types. Journal of Biogeography, 41(11): 2003-2019.
|
|
|
| [10] |
Donohue R J, Roderick M L, McVicar T R. 2012. Roots, storms and soil pores: Incorporating key ecohydrological processes into Budyko's hydrological model. Journal of Hydrology, 436-437: 35-50.
|
|
|
| [11] |
Duolaiti X, Kasimu A, Reheman R, et al. 2023. Assessment of water yield and water purification services in the arid zone of Northwest China: The case of the Ebinur Lake Basin. Land, 12(3): 533, doi: 10.3390/land12030533.
|
|
|
| [12] |
Gao L N, Tao F, Liu R R, et al. 2022. Multi-scenario simulation and ecological risk analysis of land use based on the PLUS model: A case study of Nanjing. Sustainable Cities and Society, 85: 104055, doi: 10.1016/j.scs.2022.104055.
|
|
|
| [13] |
Guo J T, Zhang Z Q, Wang S P, et al. 2014. Appling SWAT model to explore the impact of changes in land use and climate on the streamflow in a watershed of Northern China. Acta Ecologica Sinica, 34(6): 1559-1567. (in Chinese)
|
|
|
| [14] |
Hu C M, Narengerile, You L. 2019. Study of ecological water levels of Bosten Lake for water quality management. Acta Ecologica Sinica, 39(2): 748-755. (in Chinese)
|
|
|
| [15] |
Hu W M, Li G, Gao Z H, et al. 2020. Assessment of the impact of the Poplar Ecological Retreat Project on water conservation in the Dongting Lake wetland region using the InVEST model. Science of the Total Environment, 733: 139423, doi: 10.1016/j.scitotenv.2020.139423.
|
|
|
| [16] |
Hu Y X, Yu X X, Liao W, et al. 2022. Spatio-temporal patterns of water yield and its influencing factors in the Han River Basin. Resources and Environment in the Yangtze Basin, 31(1): 73-82. (in Chinese)
|
|
|
| [17] |
Janjić J, Tadić L. 2023. Fields of application of SWAT hydrological model—A review. Earth, 4(2): 331-344.
|
|
|
| [18] |
Kadeer R, Rusuli Y, Wufu A, et al. 2017. MODIS data-based study of the spatial distribution of land surface temperature in Bosten lake basin area. Acta Scientiarum Naturalium Universitatis Sunyatseni, 56(5): 127-138. (in Chinese)
|
|
|
| [19] |
Karnieli A, Ben-Asher J. 1993. A daily runoff simulation in semi-arid watersheds based on soil water deficit calculations. Journal of Hydrology, 149(1-4): 9-25.
|
|
|
| [20] |
Kent K M. 1972. Chapter 15:Travel time, time of concentration and lag. SCS National Engineering Handbook, Section 4, Hydrology. [2024-01-05]. https://babel.hathitrust.org/cgi/pt?id=mdp.39015012634476&seq=9.
|
|
|
| [21] |
Li M Y, Liang D, Xia J, et al. 2021. Evaluation of water conservation function of Danjiang River Basin in Qinling Mountains, China based on InVEST model. Journal of Environmental Management, 286: 112212, doi: 10.1016/j.jenvman.2021.112212.
|
|
|
| [22] |
Li Y A, Tan Y, Jiang F Q, et al. 2003. Study on hydrological features of the Kaidu River and the Bosten Lake in the second half of 20th century. Journal of Glaciology and Geocryology, 2: 215-218. (in Chinese)
|
|
|
| [23] |
Liang H W, Kasimu A, ZHAO H M, et al. 2022. Analysis of the spatial and temporal differences in surface temperature and the contribution of surface coverage in the urban agglomeration on the northern slope of the Tianshan Mountains. Arid Zone Research, 39(2): 388-399. (in Chinese)
|
|
|
| [24] |
Liang X, Guan Q F, Clarke K C, et al. 2021. Understanding the drivers of sustainable land expansion using a patch-generating land use simulation (PLUS) model: A case study in Wuhan, China. Computers, Environment and Urban Systems, 85: 101569, doi: 10.1016/j.compenvurbsys.2020.101569.
|
|
|
| [25] |
Lu N, Sun G, Feng X M, et al. 2013. Water yield responses to climate change and variability across the North-South Transect of Eastern China (NSTEC). Journal of Hydrology, 481: 96-105.
|
|
|
| [26] |
Maurya S, Srivastava P K, Gupta M, et al. 2016. Integrating soil hydraulic parameter and microwave precipitation with morphometric analysis for watershed prioritization. Water Resources Management, 30(14): 5385-5405.
|
|
|
| [27] |
Ming A, Rowell I, Lewin S, et al. 2021. Key Messages from the IPCC AR6 Climate Science Report. Cambridge Centre for Climate Science, University of Cambridge. Cambridge, UK.
|
|
|
| [28] |
Ministry of Environmental Protection of the People's Republic of China, National Development and Reform Commission of the People's Republic of China. 2017. Technical Guidelines for the Delineation of Ecological Red Line. [2024-01-12]. https://www.mee.gov.cn/gkml/hbb/bgt/201707/W020170728397753220005.pdf.
|
|
|
| [29] |
O'Neill B C, Tebaldi C, Vuuren D P, et al. 2016. The scenario model intercomparison project (ScenarioMIP) for CMIP6. Geoscientific Model Development, 9(9): 3461-3482.
|
|
|
| [30] |
Pokhrel Y, Felfelani F, Satoh Y, et al. 2021. Global terrestrial water storage and drought severity under climate change. Nature Climate Change, 11(3): 226-233.
|
|
|
| [31] |
Redhead J W, Stratford C, Sharps K, et al. 2016. Empirical validation of the InVEST water yield ecosystem service model at a national scale. Science of the Total Environment, 569-570: 1418-1426.
|
|
|
| [32] |
Reheman R, Kasimu A, Duolaiti X, et al. 2023. Research on the change in prediction of water production in urban agglomerations on the northern slopes of the Tianshan Mountains based on the InVEST-PLUS model. Water, 15(4): 776, doi: 10.3390/w15040776.
|
|
|
| [33] |
Sun S L, Liu Y B, Chen H S, et al. 2022. Causes for the increases in both evapotranspiration and water yield over vegetated mainland China during the last two decades. Agricultural and Forest Meteorology, 324: 109118, doi: 10.1016/j.agrformet.2022.109118.
|
|
|
| [34] |
Teo H C, Raghavan S V, He X G, et al. 2022. Large-scale reforestation can increase water yield and reduce drought risk for water-insecure regions in the Asia-Pacific. Global Change Biology, 28(21): 6385-6403.
|
|
|
| [35] |
Vigerstol K L, Aukema J E. 2011. A comparison of tools for modeling freshwater ecosystem services. Journal of Environmental Management, 92(10): 2403-2409.
doi: 10.1016/j.jenvman.2011.06.040
pmid: 21763063
|
|
|
| [36] |
Wang J, Xu C D. 2017. Geodetector: Principle and prospective. Acta Geographica Sinica, 72: 116-134. (in Chinese)
doi: 10.11821/dlxb201701010
|
|
|
| [37] |
Wang X F, Chu B Y, Feng X M, et al. 2021. Spatiotemporal variation and driving factors of water yield services on the Qingzang Plateau. Geography and Sustainability, 2(1): 31-39.
|
|
|
| [38] |
Wang X X, Shen H T, Li X Y, et al. 2013. Concepts, processes and quantification methods of the forest water conservation at the multiple scales. Acta Ecologica Sinica, 33(4): 1019-1030. (in Chinese)
|
|
|
| [39] |
Wang Y, Chen Y N, Ding J L, et al. 2015. Land-use conversion and its attribution in the Kaidu-Kongqi River Basin, China. Quaternary International, 380: 216-223.
|
|
|
| [40] |
Wei B H, Kasimu A, Fang C L, et al. 2023a. Establishing and optimizing the ecological security pattern of the urban agglomeration in arid regions of China. Journal of Cleaner Production, 427: 139301, doi: 10.1016/j.jclepro.2023.139301.
|
|
|
| [41] |
Wei B H, Kasimu A, Reheman R, et al. 2023b. Spatiotemporal characteristics and prediction of carbon emissions/absorption from land use change in the urban agglomeration on the northern slope of the Tianshan Mountains. Ecological Indicators, 151: 110329, doi: 10.1016/j.ecolind.2023.110329.
|
|
|
| [42] |
Wei Q Q, Abudureheman M, Halike A, et al. 2022. Temporal and spatial variation analysis of habitat quality on the PLUS-InVEST model for Ebinur Lake Basin, China. Ecological Indicators, 145: 109632, doi: 10.1016/j.ecolind.2022.109632.
|
|
|
| [43] |
Wu K S, Wang D, Lu H Y, et al. 2023. Temporal and spatial heterogeneity of land use, urbanization, and ecosystem service value in China: A national-scale analysis. Journal of Cleaner Production, 418: 137911, doi: 10.1016/j.jclepro.2023.137911.
|
|
|
| [44] |
Wu L Y, Zhang X, Hao F H, et al. 2020. Evaluating the contributions of climate change and human activities to runoff in typical semi-arid area, China. Journal of Hydrology, 590: 125555, doi: 10.1016/j.jhydrol.2020.125555.
|
|
|
| [45] |
Xiao Y, Ouyang Z Y. 2019. Spatial-temporal patterns and driving forces of water retention service in China. Chinese Geographical Science, 20(1): 100-111.
|
|
|
| [46] |
Yang H B, Yang D W, Lei Z D, et al. 2008. New analytical derivation of the mean annual water-energy balance equation. Water Resources Research, 44(3), W03410, doi: 10.1029/2007WR006135.
|
|
|
| [47] |
Yang H F, Nie S N, Deng S Q, et al. 2023. Evaluation of water yield and its driving factors in the Yangtze River Basin, China. Environmental Earth Sciences, 82: 429, doi: 10.1007/s12665-023-11113-9.
|
|
|
| [48] |
Yang J, Xie B P, Zhang D G, et al. 2021. Climate and land use change impacts on water yield ecosystem service in the Yellow River Basin, China. Environmental Earth Sciences, 80: 72, doi: 10.1007/s12665-020-09277-9.
|
|
|
| [49] |
Yu Z T, Wang X J, Zhao C Y, et al. 2015. Carbon burial in Bosten Lake over the past century: Impacts of climate change and human activity. Chemical Geology, 419: 132-141.
|
|
|
| [50] |
Zhang F, Rusuli Y, Tuersun A. 2021. Spatio-temporal change of ecosystem service value in Bosten Lake Watershed based on land use. Acta Ecologica Sinica, 41(13): 5254-5265. (in Chinese)
|
|
|
| [51] |
Zhang L, Hickel K, Dawes W R, et al. 2004. A rational function approach for estimating mean annual evapotranspiration. Water Resources Research, 40(2): WR002710, doi: 10.1029/2003WR002710.
|
|
|
|
Viewed |
|
|
|
Full text
|
|
|
|
|
Abstract
|
|
|
|
|
Cited |
|
|
|
|
| |
Shared |
|
|
|
|
| |
Discussed |
|
|
|
|