| Research article |
|

|
|
|
| Occurrence of flash drought in reservoirs in the semi-arid area of the Ceará State, Brazil |
Suellen Teixeira Nobre GONÇALVES*( ), Francisco das Chagas VASCONCELOS JÚNIOR, Cleiton da Silva SILVEIRA, José Micael Ferreira da COSTA, Antonio Duarte MARCOS JUNIOR ), Francisco das Chagas VASCONCELOS JÚNIOR, Cleiton da Silva SILVEIRA, José Micael Ferreira da COSTA, Antonio Duarte MARCOS JUNIOR |
1Department of Civil Engineering, Federal University of Ceará (UFC), Fortaleza 60020-181, Brazil
2Ceará Foundation for Meteorology and Water Resources (FUNCEME), Fortaleza 60015-221, Brazil |
|
|
|
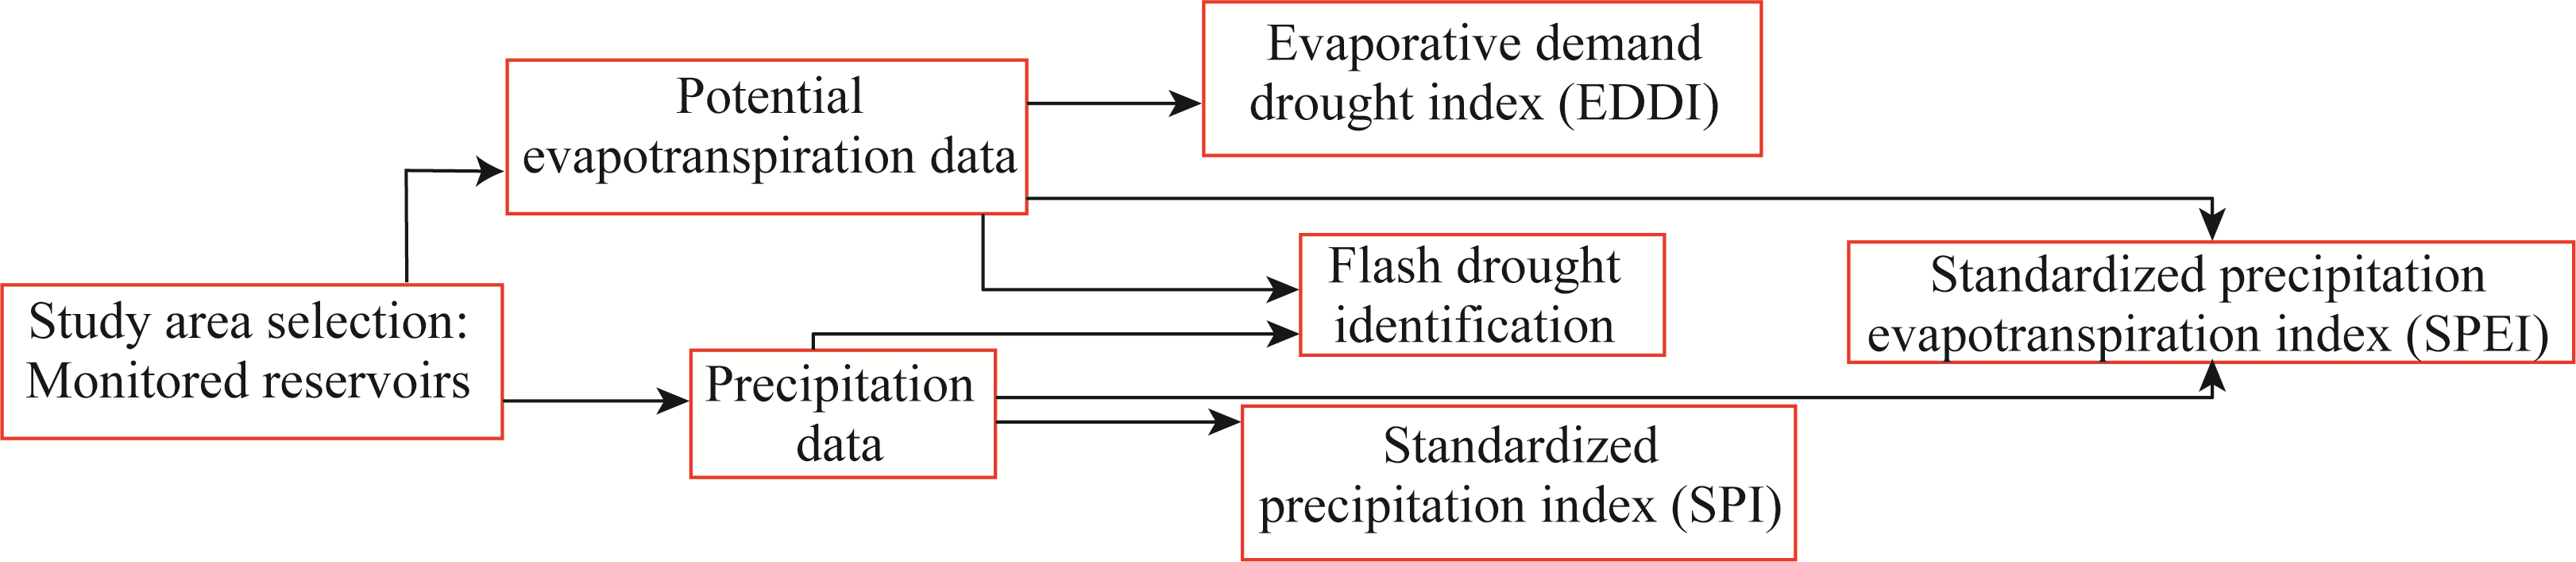
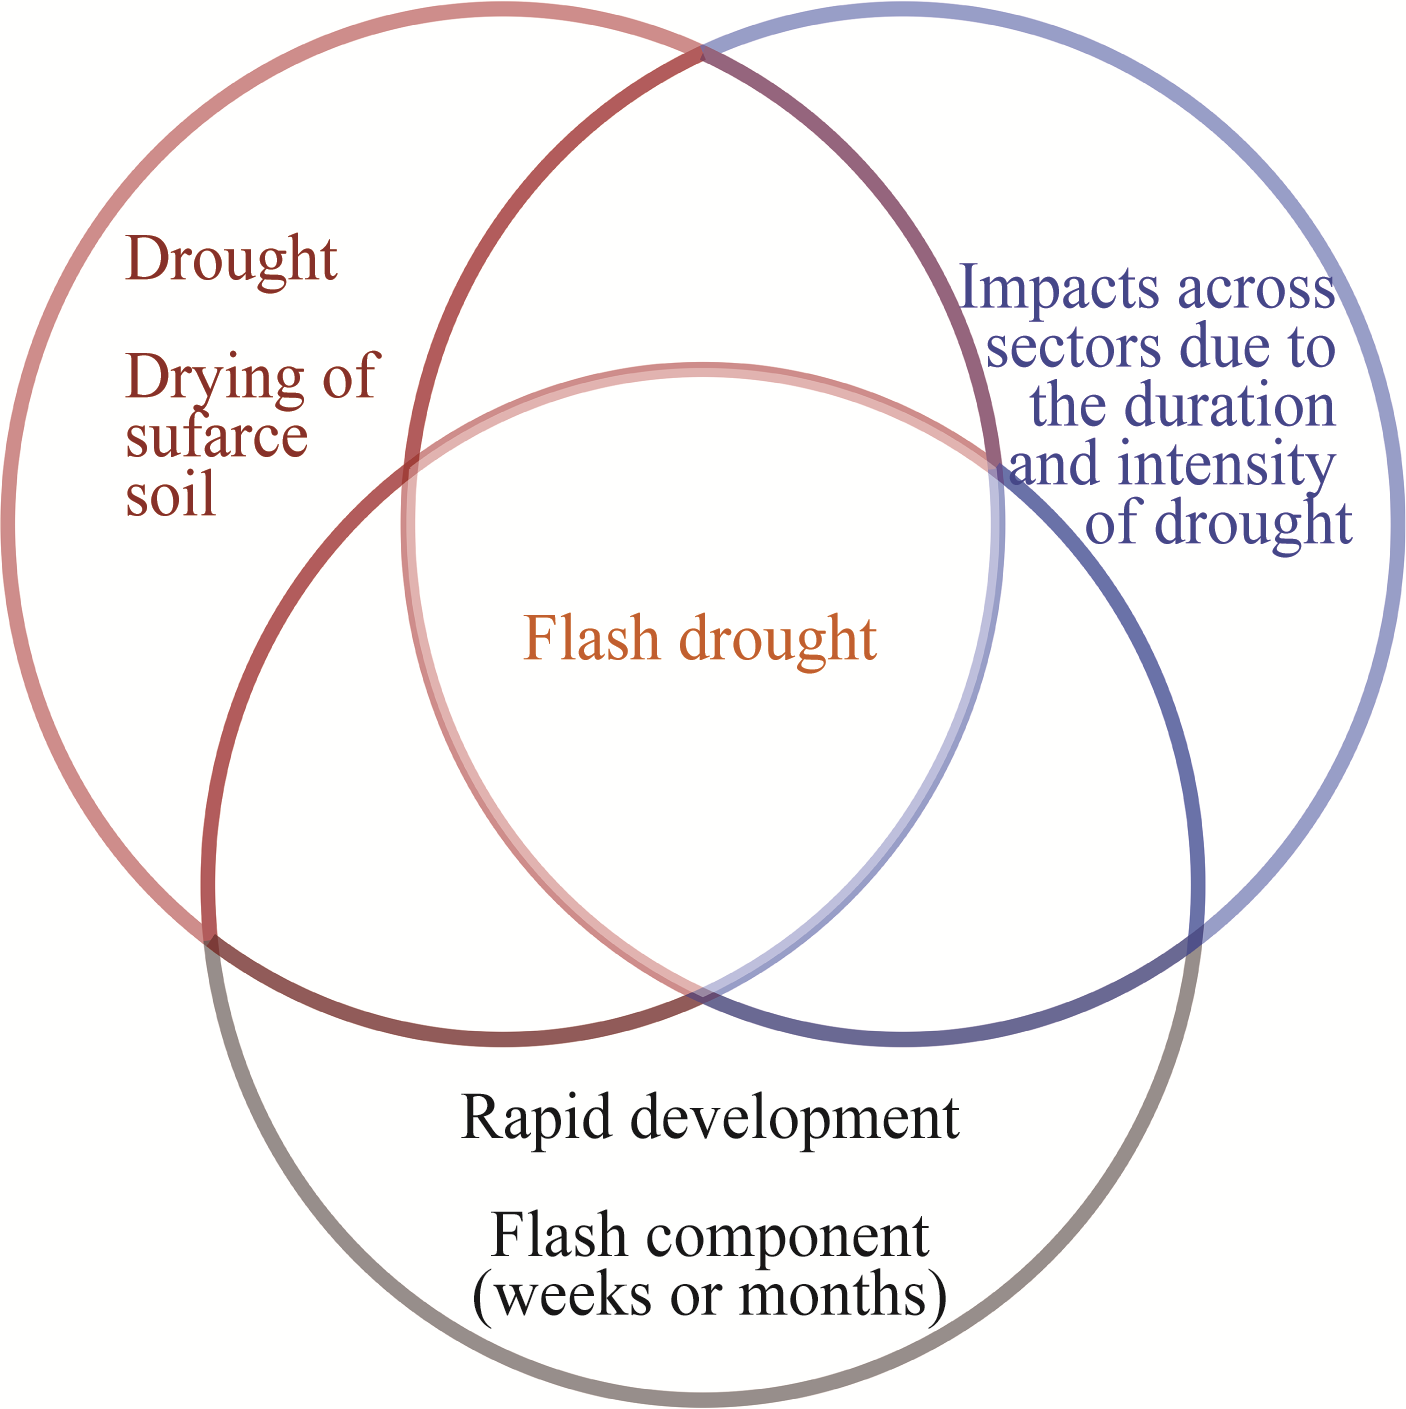
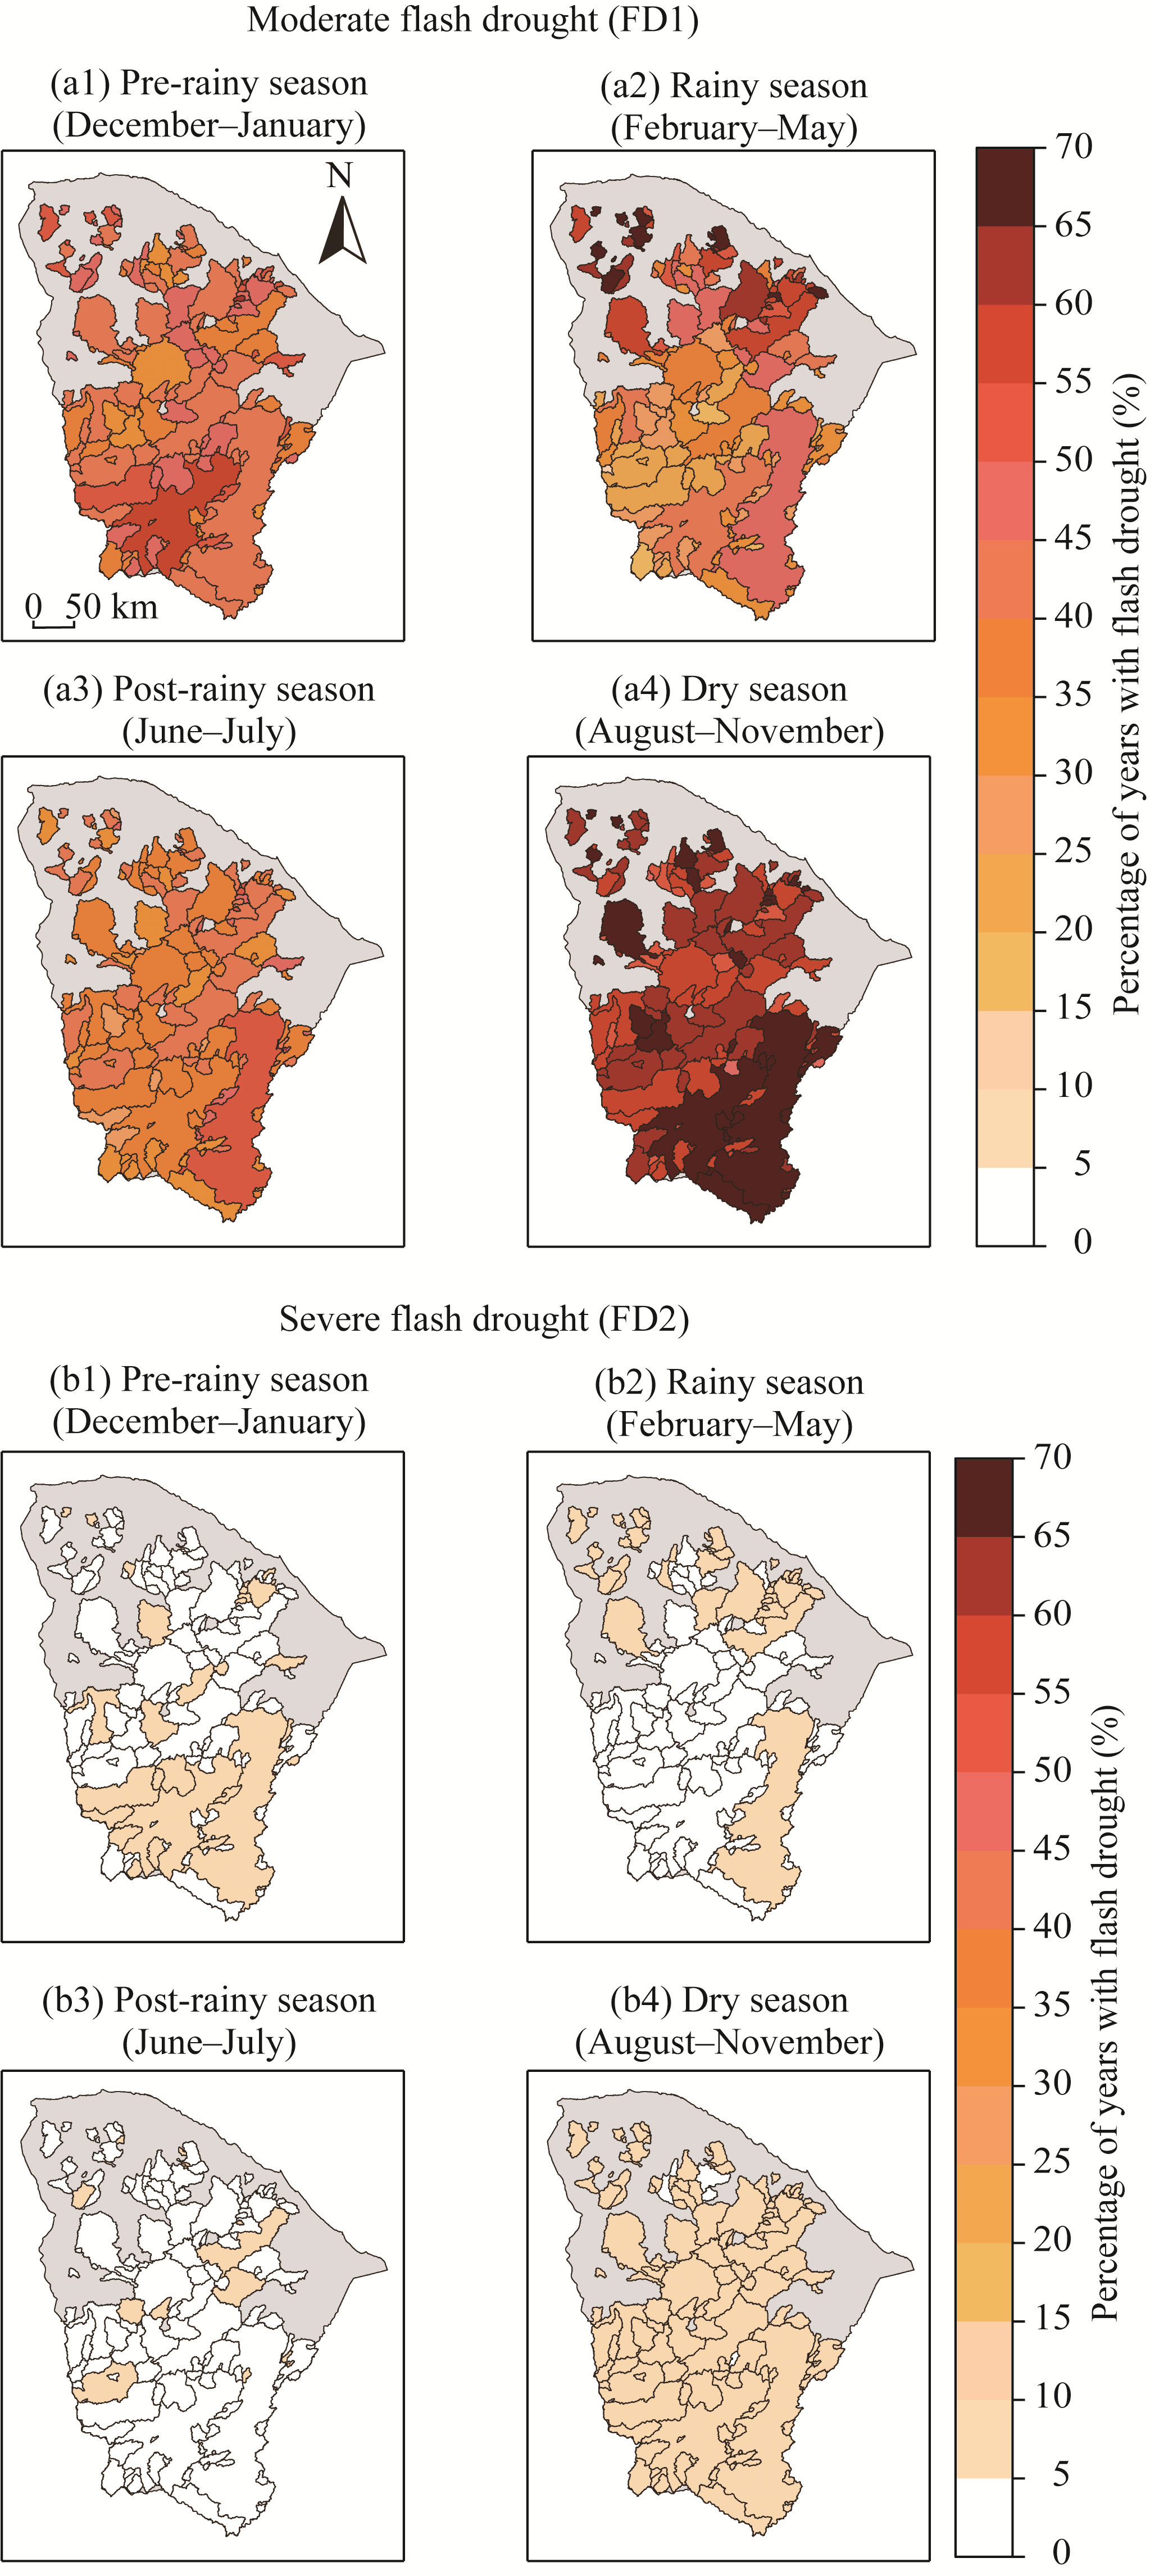
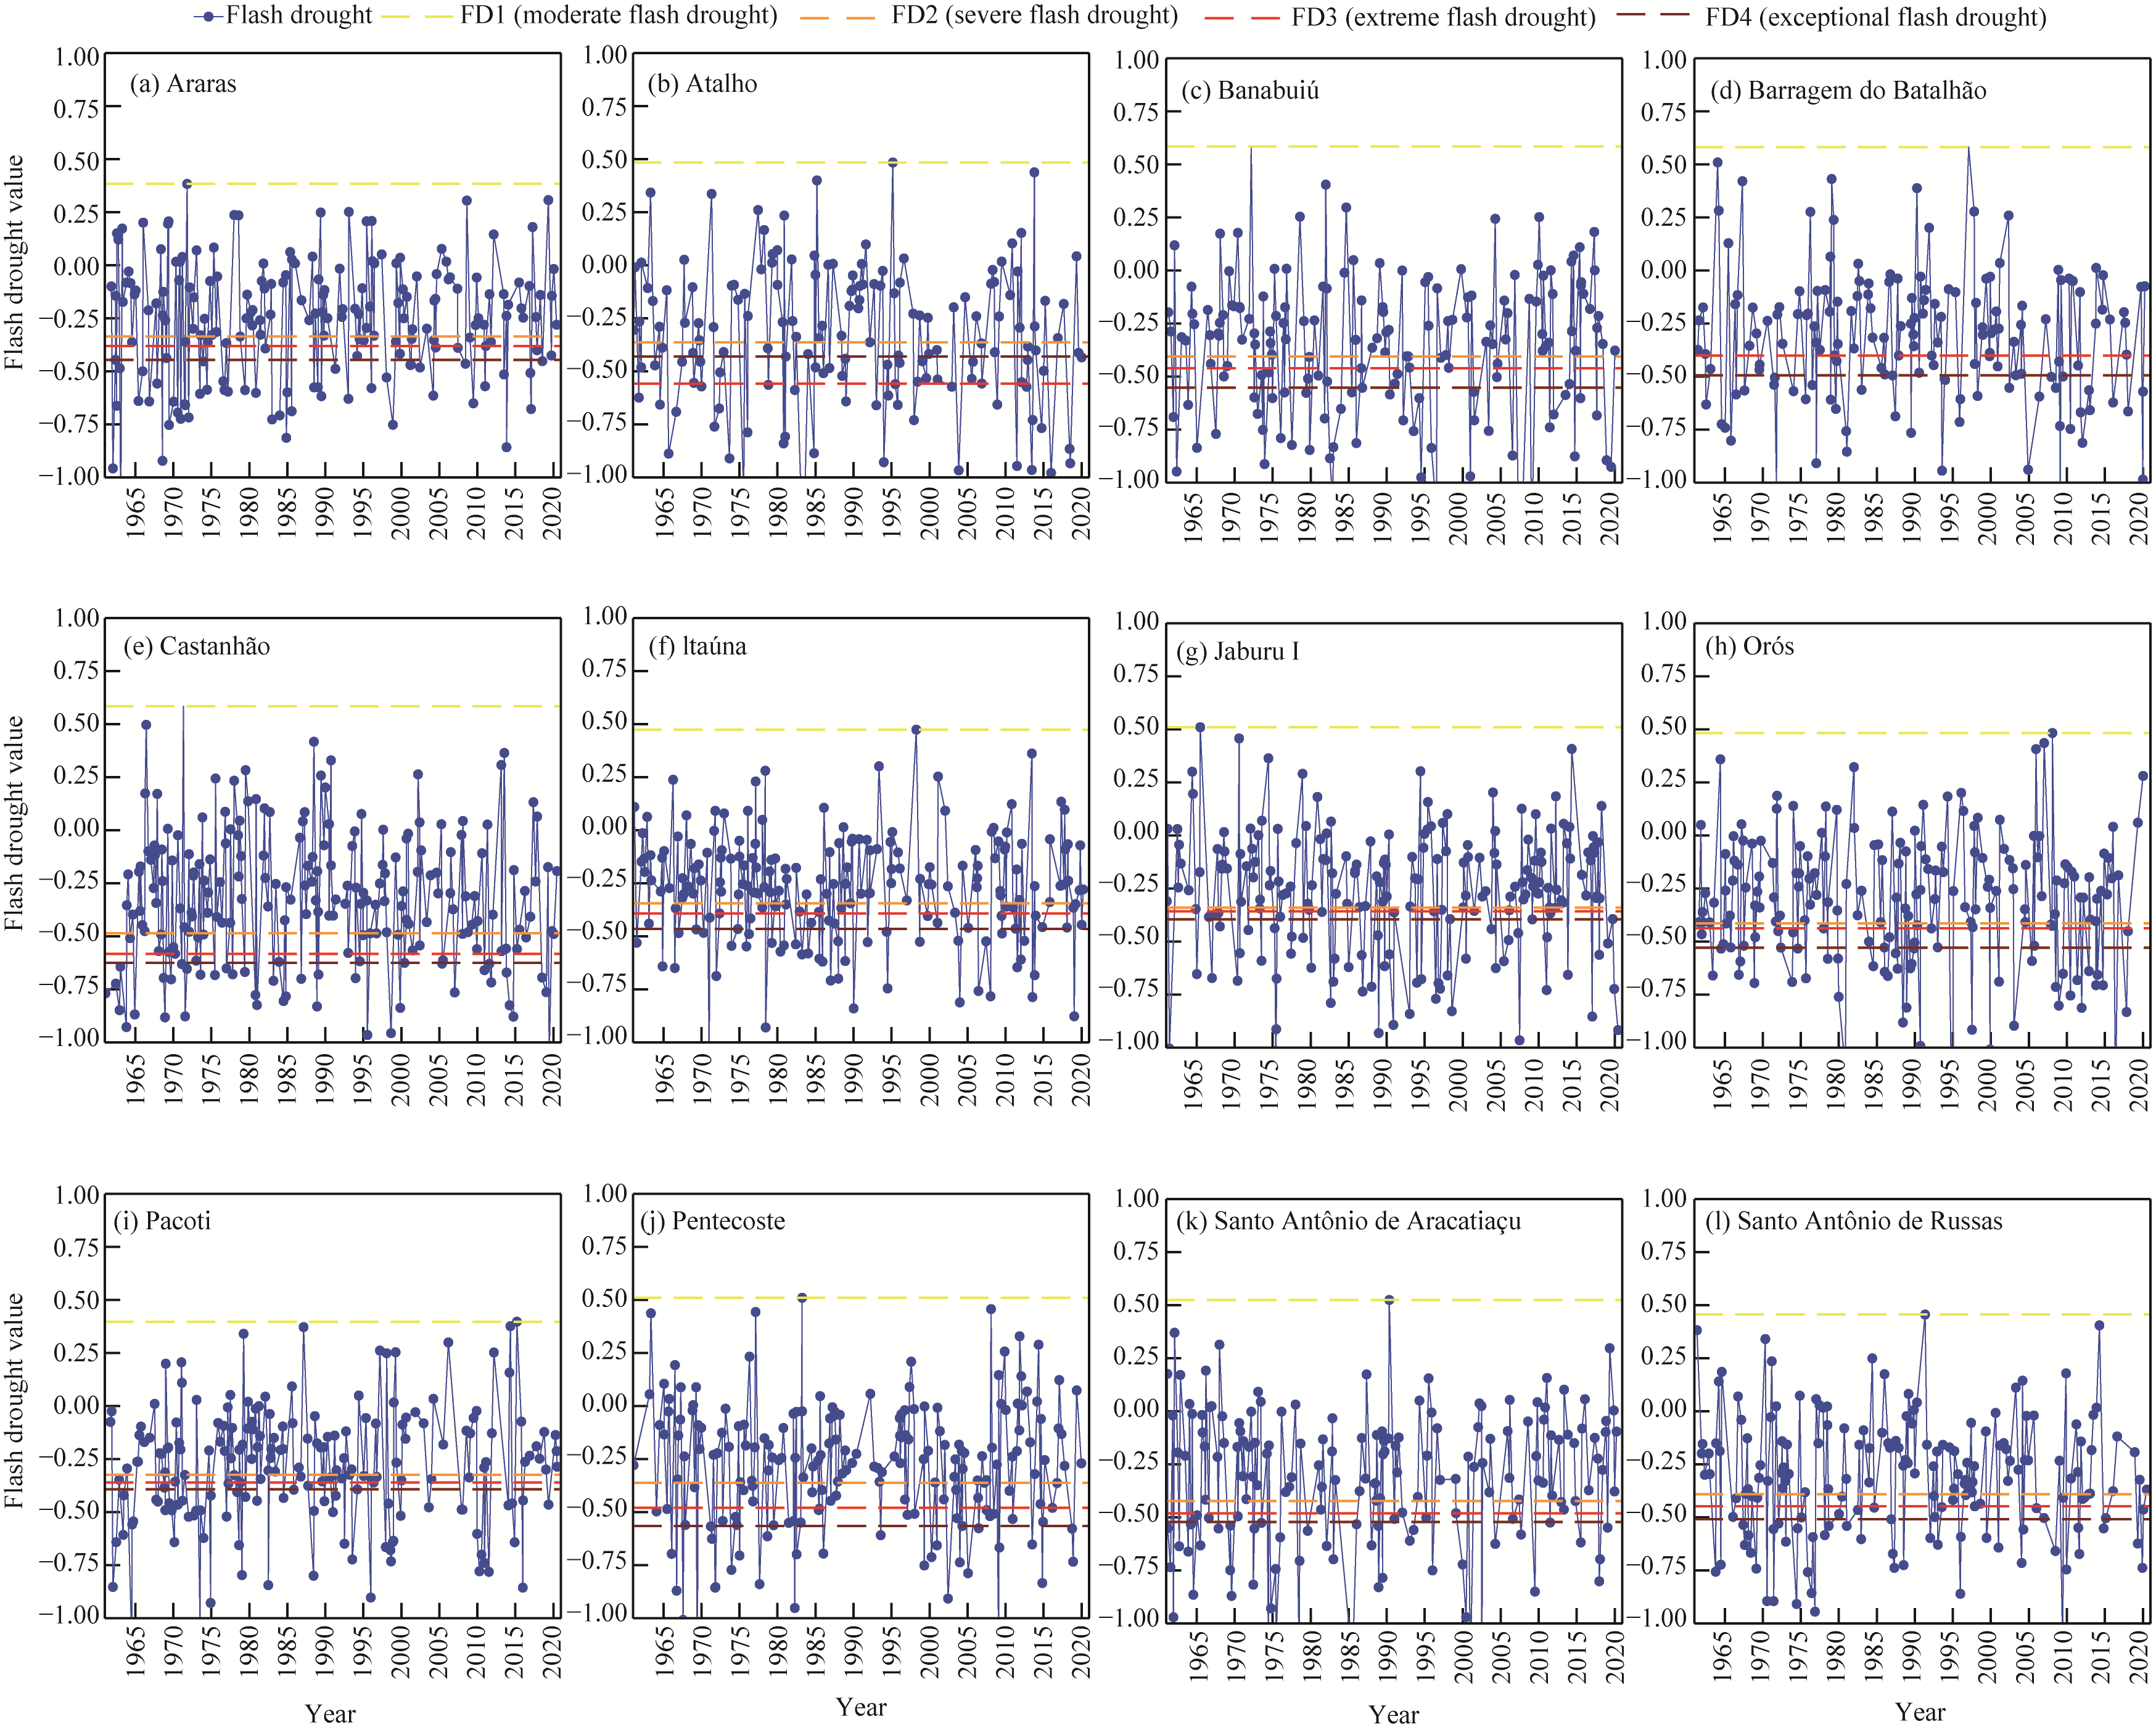
Abstract Precipitation is scarce in semi-arid areas, which results in serious drought. Occurrence of flash drought is quite often in these areas, and flash drought may also cause significant disasters. However, monitoring flash drought is still weak and remains a challenge. This study aims to identify, evaluate, and monitor flash drought events that occurred from 1961 to 2020 in reservoirs of the Ceará State, Brazil. The Christian's method, standardized precipitation index (SPI), standardized precipitation evapotranspiration index (SPEI), and evaporative demand drought index (EDDI) were used to assess the severity and persistence of flash drought. Moreover, analyses conducted in 2001, 2008, 2011, 2012, 2016, and 2020 revealed the complexity and interaction of flash drought with environmental and meteorological factors. The results indicated that in dry years such as 2001, 2012, and 2016, drought indices pointed to the intensification of drought conditions, with impacts on major reservoirs in the area, such as Banabuiú, Castanhão, and Orós. Low precipitation, associated with high evaporative demand, intensified water stress, reducing water availability for the population and local ecosystems. In wet years such as 2008, 2011, and 2020, SPEI and EDDI indicated higher moisture levels and drought relief, favoring the recovery of reservoirs. It was also observed that most flash drought episodes evolved into conventional droughts, highlighting their persistence and potential long-term impact. Moreover, the months of May and November presented a higher frequency of flash drought during the wet and dry periods, respectively, negatively impacting most of the studied reservoirs. These findings underscore the need for effective drought monitoring and mitigation strategies to reduce its impacts on agriculture and water resources in the semi-arid area. Early detection and analysis of flash drought are important for improving water resource management and for continuous adaptation to changing drought conditions.
|
|
Received: 03 November 2024
Published: 31 July 2025
|
|
Corresponding Authors:
*Suellen Teixeira Nobre GONÇALVES (E-mail: suellen.nobre@gmail.com)
|
|
|
| [1] |
Abramowitz M, Stegun I A. 1965. Handbook of Mathematical Functions. New York: Dover.
|
|
|
| [2] |
Assunção B V da. 2011. Atmospheric dynamics in south-central Brazil in summer and the influences of the El Niño Southern Oscillation (ENSO). Journal of the Department of Geography, 22: 135-157. (in Portuguese)
|
|
|
| [3] |
Ballarin A S, Godoy M R V, Zaerpour M, et al. 2024. Drought intensification in Brazilian catchments: Implications for water and land management. Environmental Research Letters, 19(5): 054030, doi: 10.1088/1748-9326/ad3e18.
|
|
|
| [4] |
Barbosa H A. 2023. Flash drought and its characteristics in northeastern South America during 2004-2022 using satellite-based products. Atmosphere, 14(11): 1629, doi: 10.3390/atmos14111629.
|
|
|
| [5] |
Barbosa H A, Buriti C O, Kumar T L. 2024. Deep learning for flash drought detection: A case study in northeastern Brazil. Atmosphere, 15(7): 761, doi: 10.3390/atmos15070761.
|
|
|
| [6] |
Basara J B, Maybourn J N, Peirano C M, et al. 2013. Drought and associated impacts in the Great Plains of the United States: A review. International Journal of Geosciences, 4(6B): 72-81.
|
|
|
| [7] |
Chang F C, Wallace J M. 1987. Meteorological conditions during heat waves and droughts in the United States Great Plains. Monthly Weather Review, 115(7): 1253-1269.
|
|
|
| [8] |
Chikabvumbwa S R, Salehnia N, Gholami A, et al. 2024. Characterization of hydro-meteorological droughts based on dynamic future scenarios and effective rainfall over Central Malawi. Theoretical and Applied Climatology, 155(3): 1959-1975.
|
|
|
| [9] |
Christian J I, Basara J B, Otkin J A, et al. 2019a. A methodology for flash drought identification: application of flash drought frequency across the United States. Journal of Hydrometeorology, 20(5): 833-846.
|
|
|
| [10] |
Christian J I, Basara J B, Otkin J A, et al. 2019b. Regional characteristics of flash droughts across the United States. Environmental Research Communications, 1(12): 12125004, doi: 10.1088/2515-7620/ab50ca.
|
|
|
| [11] |
Christian J I, Basara J B, Hunt E D, et al. 2020. Flash drought development and cascading impacts associated with the 2010 Russian heatwave. Environmental Research Letters, 15(9): 094078, doi: 10.1088/1748-9326/ab9faf.
|
|
|
| [12] |
Christian J I, Basara J B, Hunt E D, et al. 2021. Global distribution, trends, and drivers of flash drought occurrence. Nature Communications, 12(1): 6330, doi: 10.1038/s41467-021-26692-z.
|
|
|
| [13] |
Christian J I, Hobbins M, Hoell A, et al. 2024. Flash drought: A state of the science review. Wiley Interdisciplinary Reviews: Water, 11(3): e1714, doi: 10.1002/wat2.1714.
|
|
|
| [14] |
COGERH(Ceará Water Resources Company). 2024. Ceará Hydrological Portal: Monitored Reservoirs. [2024-10-19]. http://www.hidro.ce.gov.br/.(in Portuguese)
|
|
|
| [15] |
Coutinho M D L, da Silva Costa M, dos Santos Gomes A C, et al. 2017. Case study: Extreme event in the state of Ceará between January 3rd and 4th, 2015. Brazilian Journal of Climatology, 20(13): 182-198. (in Portuguese)
|
|
|
| [16] |
De Medeiros C N, Gomes D D M, Albuquerque E L S, et al. 2012. Ceará's Water Resources: Integration, Management and Potential. Fortaleza: IPECE. (in Portuguese)
|
|
|
| [17] |
De Melo A D. 2005. Operation of reservoirs in the semi-arid region considering water quality criteria. MSc Thesis. Federal University of Campina Grande. (in Portuguese)
|
|
|
| [18] |
De Nys E, Engle N L, Quintana C M, et al. 2016. Drought in Brazil:Proactive Management and Policy. Brasília: CRC Press.
|
|
|
| [19] |
Ford T W, Labosier C F. 2017. Meteorological conditions associated with the onset of flash drought in the eastern United States. Agricultural and Forest Meteorology, 247: 414-423.
|
|
|
| [20] |
Ford T W, Otkin J A, Quiring S M, et al. 2023. Flash drought indicator intercomparison in the United States. Journal of Applied Meteorology and Climatology, 62(12): 1713-1730.
|
|
|
| [21] |
FUNCEME(Ceará Foundation for Meteorology and Water Resources). 2024. Rainfall Calendar in the State of Ceará. [2024-10-04]. http://funceme.br/app/calendario/produto/ceara/media/anual. (in Portuguese)
|
|
|
| [22] |
Getahun Y S, Li M H. 2024. Flash drought evaluation using evaporative stress and evaporative demand drought indices: A case study from Awash River Basin (ARB), Ethiopia. Theoretical and Applied Climatology, 155(1): 85-104.
|
|
|
| [23] |
Gonçalves S T N, Vasconcelos F D C J, Sakamoto M S, et al. 2021. Drought monitoring indices and methodologies: A review. Brazilian Journal of Meteorology, 36: 495-511.
|
|
|
| [24] |
Gonçalves S T N, Vasconcelos F D C J, Silveira C D S, et al. 2023a. Evaluation of drought indices in the hydrological monitoring of strategic reservoirs in Ceará, Brazil. Brazilian Journal of Meteorology, 38: e38230018, doi: 10.1590/0102-77863810018. (in Portuguese)
|
|
|
| [25] |
Gonçalves S T N, Vasconcelos F D C J, Silveira C D S, et al. 2023b. Comparative analysis of drought indices in hydrological monitoring in Ceará's semi-arid basins, Brazil. Water, 15(7): 1259, doi: 10.3390/w15071259.
|
|
|
| [26] |
Gutierrez A P A, Engle N L, De Nys E, et al. 2014. Drought preparedness in Brazil. Weather and Climate Extremes, 3: 95-106.
|
|
|
| [27] |
Hamidifar H. 2024. Water crisis in Iran:Causes, consequences, and solutions. In: IzahS C, OgwuM C, LoukasA, et al. Water Crises and Sustainable Management in the Global South. Singapore: Springer, 85-109.
|
|
|
| [28] |
Hobbins M T, Wood A, McEvoy D J, et al. 2016. The evaporative demand drought index. Part I: Linking drought evolution to variations in evaporative demand. Journal of Hydrometeorology, 17(6): 1745-1761.
|
|
|
| [29] |
Hoffmann D G, Gallant A J, Hobbins M. 2021. Flash drought in CMIP 5 models. Journal of Hydrometeorology, 22(6): 1439-1454.
doi: 10.1175/JHM-D-20-0262.1
|
|
|
| [30] |
Kang H, Sridhar V, Ali S A. 2022. Climate change impacts on conventional and flash droughts in the Mekong River basin. Science of the Total Environment, 838(2): 155845, doi:10.1016/j.scitotenv.2022.155845.
|
|
|
| [31] |
Li X, He B B, Quan X W, et al. 2015. Use of the standardized precipitation evapotranspiration index (SPEI) to characterize the drying trend in southwest China from 1982-2012. Remote Sensing, 7(8): 10917-10937.
|
|
|
| [32] |
Lima I R de, Silveira C da S, Vasconcelos F das C J. 2020. Nexus: Water, climate, energy, and environment: A perspective on the Itataia-CE project. Brazilian Journal of Meteorology, 35: 449-457. (in Portuguese)
|
|
|
| [33] |
Lopes J E G, Santos R C P. 2002. Reservoir capacity. PhD Dissertation. São Paulo: Polytechnic School of the University of São Paulo. (in Portuguese)
|
|
|
| [34] |
Marengo J A, Cunha A P, Alves L M. 2016. The 2012-2015 drought in the semiarid region of Northeast Brazil in historical context. Revista Climanálise, 3(1): 49-54. (in Portuguese)
|
|
|
| [35] |
Marengo J A, Alves L M, Alvala R C, et al. 2018. Climatic characteristics of the 2010-2016 drought in the semiarid Northeast Brazil region. Annals of the Brazilian Academy of Sciences, 90(2): 1973-1985.
|
|
|
| [36] |
Martins E S P R, De Nys E, Molejón C, et al. 2015. Northeast Drought Monitor, in Search of a New Paradigm for Drought Management. Water Series, 10. Brasília: World Bank (in Portuguese)
|
|
|
| [37] |
Martins E S P R, Magalhães A R, Fontenele D, et al. 2017. The 2010-2017 multi-year drought in the northeast and its impacts. Strategic Partnerships, 22(44): 17-40. (in Portuguese)
|
|
|
| [38] |
McCabe G J, Betancourt J L, Gray S T, et al. 2008. Associations of multi-decadal sea-surface temperature variability with US drought. Quaternary International, 188(1): 31-40.
|
|
|
| [39] |
McEvoy D J, Huntington J L, Hobbins M T, et al. 2016. The evaporative demand drought index. Part II: CONUS-wide assessment against common drought indicators. Journal of Hydrometeorology, 17(6): 1763-1779.
|
|
|
| [40] |
McKee T B, Doesken N J, Kleist J. 1993. The relationship of drought frequency and duration to time scales. American Meteorological Society, 7(22): 179-183.
|
|
|
| [41] |
Mishra V, Aadhar S, Mahto S S, et al. 2021. Anthropogenic warming and intraseasonal summer monsoon variability amplify the risk of future flash droughts in India. NPJ Climate and Atmospheric Science, 4(1): 1(2021), doi: 10.1038/s41612-020-00158-3.
|
|
|
| [42] |
Mo K C, Lettenmaier D P. 2016. Precipitation deficit flash droughts over the United States. Journal of Hydrometeorology, 17(4): 1169-1184.
|
|
|
| [43] |
Mohammadi K, Jiang Y, Wang G. 2022. Flash drought early warning based on the trajectory of solar-induced chlorophyll fluorescence. Proceedings of the National Academy of Sciences of the United States of America, 119(32): e2202767119, doi: 10.1073/pnas.2202767119.
|
|
|
| [44] |
Nimer E. 1989. Climatology of Brazil (2nd ed.). Rio de Janeiro: IBGE, Department of Natural Resources and Environmental Studies. (in Portuguese)
|
|
|
| [45] |
NOAA(National Oceanic and Atmospheric Administration). 2011. National Weather Service, Climate Prediction. [2024-09-28]. http://www.cpc.ncep.noaa.gov/products/analysis_monitoring/ensostuff/ensoyears.shtml
|
|
|
| [46] |
NOAA(National Oceanic and Atmospheric Administration). 2021. Evaporative Demand Drought Index (EDDI). [2024-09-20]. https://psl.noaa.gov/eddi/.
|
|
|
| [47] |
NOAA(National Oceanic and Atmospheric Administration). 2024. ENSO: Recent Evolution, Current Status and Predictions. [2024-09-15]. https://www.cpc.ncep.noaa.gov/products/analysis_monitoring/lanina/enso_evolution-status-fcsts-web.pdf.
|
|
|
| [48] |
Noguera I, Domínguez-Castro F, Vicente-Serrano S M. 2021. Flash drought response to precipitation and atmospheric evaporative demand in Spain. Atmosphere, 12(2): 165, doi: 10.3390/atmos12020165.
|
|
|
| [49] |
Noguera I, Domínguez-Castro F, Vicente-Serrano S M, et al. 2022. Assessment of parametric approaches to calculate the evaporative demand drought index. International Journal of Climatology, 42(2): 834-849.
|
|
|
| [50] |
Nunes H M P. 2012. Assessment of wind potential off the northeast coast of Brazil. MSc Thesis. Brasília: University of Brasília. (in Portuguese)
|
|
|
| [51] |
Oliveira T A D,Souza Filho F D A D, Vasconcelos F D C. 2023. Analysis of the relationship between different drought indices: Case study in the Upper Jaguaribe Basin. Brazilian Journal of Meteorology, 38: e38230014, doi: 10.1590/0102-77863810014. (in Portuguese)
|
|
|
| [52] |
Otkin J A, Svoboda M, Hunt E D, et al. 2018a. Flash droughts: A review and assessment of the challenges imposed by rapid-onset droughts in the United States. Bulletin of the American Meteorological Society, 99(5): 911-919.
|
|
|
| [53] |
Otkin J A, Haigh T, Mucia A, et al. 2018b. Comparison of agricultural stakeholder survey results and drought monitoring datasets during the 2016 U.S. northern plains flash drought. Weather, Climate, and Society, 10(4): 867-883.
|
|
|
| [54] |
Park J, Lim Y J, Kim B J, et al. 2018. Appraisal of drought characteristics of representative drought indices using meteorological variables. KSCE Journal of Civil Engineering, 22(5): 2002-2009.
|
|
|
| [55] |
Parker T, Gallant A, Hobbins M, et al. 2021. Flash drought in Australia and its relationship to evaporative demand. Environmental Research Letters, 16(6): 064033, doi: 10.1088/1748-9326/abfe2c.
|
|
|
| [56] |
Patel N R, Chopra P, Dadhwal V K. 2007. Analyzing spatial patterns of meteorological drought using standardized precipitation index. Meteorological Applications: A Journal of Forecasting, Practical Applications, Training Techniques and Modelling, 14(4): 329-336.
|
|
|
| [57] |
Pendergrass A G, Meehl G A, Pulwarty R, et al. 2020. Flash droughts present a new challenge for subseasonal-to-seasonal prediction. Nature Climate Change, 10(3): 191-199.
|
|
|
| [58] |
Pessini P B. 2017. Study of meteorological drought events in the southern region of Brazil (Course Completion Work, Federal University of Santa Catarina, Florianópolis). [2024-08-25]. https://repositorio.ufsc.br/handle/123456789/182372. (in Portuguese)
|
|
|
| [59] |
Pontes Filho J D, Portela M M, Studart T M C, et al. 2019. A continuous drought probability monitoring system, CDPMS, based on copulas. Water, 11(9): 1925, doi: 10.3390/w11091925.
|
|
|
| [60] |
Rodrigues B D, Coutinho M D L, Sakamoto M S, et al. 2021. An analysis of rainfall in Ceará based on El Niño, La Niña and Servain Dipole events during the rainy season. Brazilian Journal of Climatology, 28: 507-519. (in Portuguese)
|
|
|
| [61] |
Santana A S D, Santos G R D. 2020. Impacts of the 2012-2017 drought in the semiarid region of the northeast: Notes on the approach of quantitative data and qualitative conclusions. Regional, Urban and Environmental Bulletin, 22: 120-129. (in Portuguese)
|
|
|
| [62] |
Santos K M S. 2020. Evaluation of the efficiency of the drought monitor for defining droughts in Sergipe. MSc Thesis. São Cristóvão: Federal University of Sergipe. (in Portuguese)
|
|
|
| [63] |
Silva B B da, Alves J J, Cavalcanti E P, et al. 2002. Wind energy potential for the prevailing direction in Northeast Brazil. Brazilian Journal of Agricultural and Environmental Engineering, 6(3): 431-439.
|
|
|
| [64] |
Silva G R. 2003. Wind characteristics of the northeast region: Analysis, modeling and applications for wind power plant Projects. MSc Thesis. Recife: Universidade Federal de Pernambuco. (in Portuguese)
|
|
|
| [65] |
Thornthwaite C W. 1948. An approach toward a rational classification of climate. Geographical Review, 38(1): 55-94.
|
|
|
| [66] |
van Loon A F. 2015. Hydrological drought explained. Water, 2(4): 359-392.
|
|
|
| [67] |
Vicente-Serrano S M, Beguería S, López-Moreno J I. 2010. A multiscalar drought index sensitive to global warming: The standardized precipitation evapotranspiration index. Journal of Climate, 23(7): 1696-1718.
|
|
|
| [68] |
Wieder W R, Boehnert J, Bonan G B, et al. 2014. Regridded harmonized world soil database v1.2. Oak Ridge National Laboratory Distributed Active Archive Center. [2024-09-18]. http://dx.doi.org/10.3334/ORNLDAAC/1247.
|
|
|
| [69] |
Wilhite D A, Glantz M H. 1985. Understanding the drought phenomenon: The role of definitions. Water International, 10(3): 111-120.
|
|
|
| [70] |
Wilhite D A. 2000. Drought as a natural hazard:Concepts and definitions. In: WilhiteD A. Drought:A Global Assessment. London: Routledge, 3-18.
|
|
|
| [71] |
Wilhite D A, Svoboda M D, Hayes M J. 2007. Understanding the complex impacts of drought: A key to enhancing drought mitigation and preparedness. Water Resources Management, 21: 763-774.
|
|
|
| [72] |
Xavier A C, Scanlon B R, King C W, et al. 2022. New improved Brazilian daily weather gridded data (1961-2020). International Journal of Climatology, 42(16): 8390-8404.
|
|
|
| [73] |
Yu J Y, Kao H Y, Lee T, et al. 2011. Subsurface ocean temperature indices for Central-Pacific and Eastern-Pacific types of El Niño and La Niña events. Theoretical and Applied Climatology, 103: 337-344.
|
|
|
|
Viewed |
|
|
|
Full text
|
|
|
|
|
Abstract
|
|
|
|
|
Cited |
|
|
|
|
| |
Shared |
|
|
|
|
| |
Discussed |
|
|
|
|