| Research article |
|


|
|
|
| Quantitative analysis of factors driving the variations in snow cover fraction in the Qilian Mountains, China |
JIN Zizhen1,2, QIN Xiang3,4,*( ), LI Xiaoying5, ZHAO Qiudong4,6, ZHANG Jingtian7, MA Xinxin1, WANG Chunlin1, HE Rui6, WANG Renjun3,4 ), LI Xiaoying5, ZHAO Qiudong4,6, ZHANG Jingtian7, MA Xinxin1, WANG Chunlin1, HE Rui6, WANG Renjun3,4 |
1Department of Geography, Xinzhou Normal University, Xinzhou 034000, China
2Key Laboratory of Ecological Safety and Sustainable Development in Arid Lands, Northwest Institute of Eco-Environment and Resources, Chinese Academy of Sciences, Lanzhou 730000, China
3Qilian Shan Station of Glaciology and Ecological Environment, State Key Laboratory of Cryospheric Sciences, Northwest Institute of Eco-Environment and Resources, Chinese Academy of Sciences, Lanzhou 730000, China
4State Key Laboratory of Cryospheric Sciences, Northwest Institute of Eco-Environment and Resources, Chinese Academy of Sciences, Lanzhou 730000, China
5Department of Computer Science, Xinzhou Normal University, Xinzhou 034000, China
6Key Laboratory of Ecohydrology of Inland River Basin, Northwest Institute of Eco-Environment and Resources, Chinese Academy of Sciences, Lanzhou 730000, China
7State Key Laboratory of Tibetan Plateau Earth System Science (LATPES), Institute of Tibetan Plateau Research, Chinese Academy of Sciences, Beijing 100101, China |
|
|
|
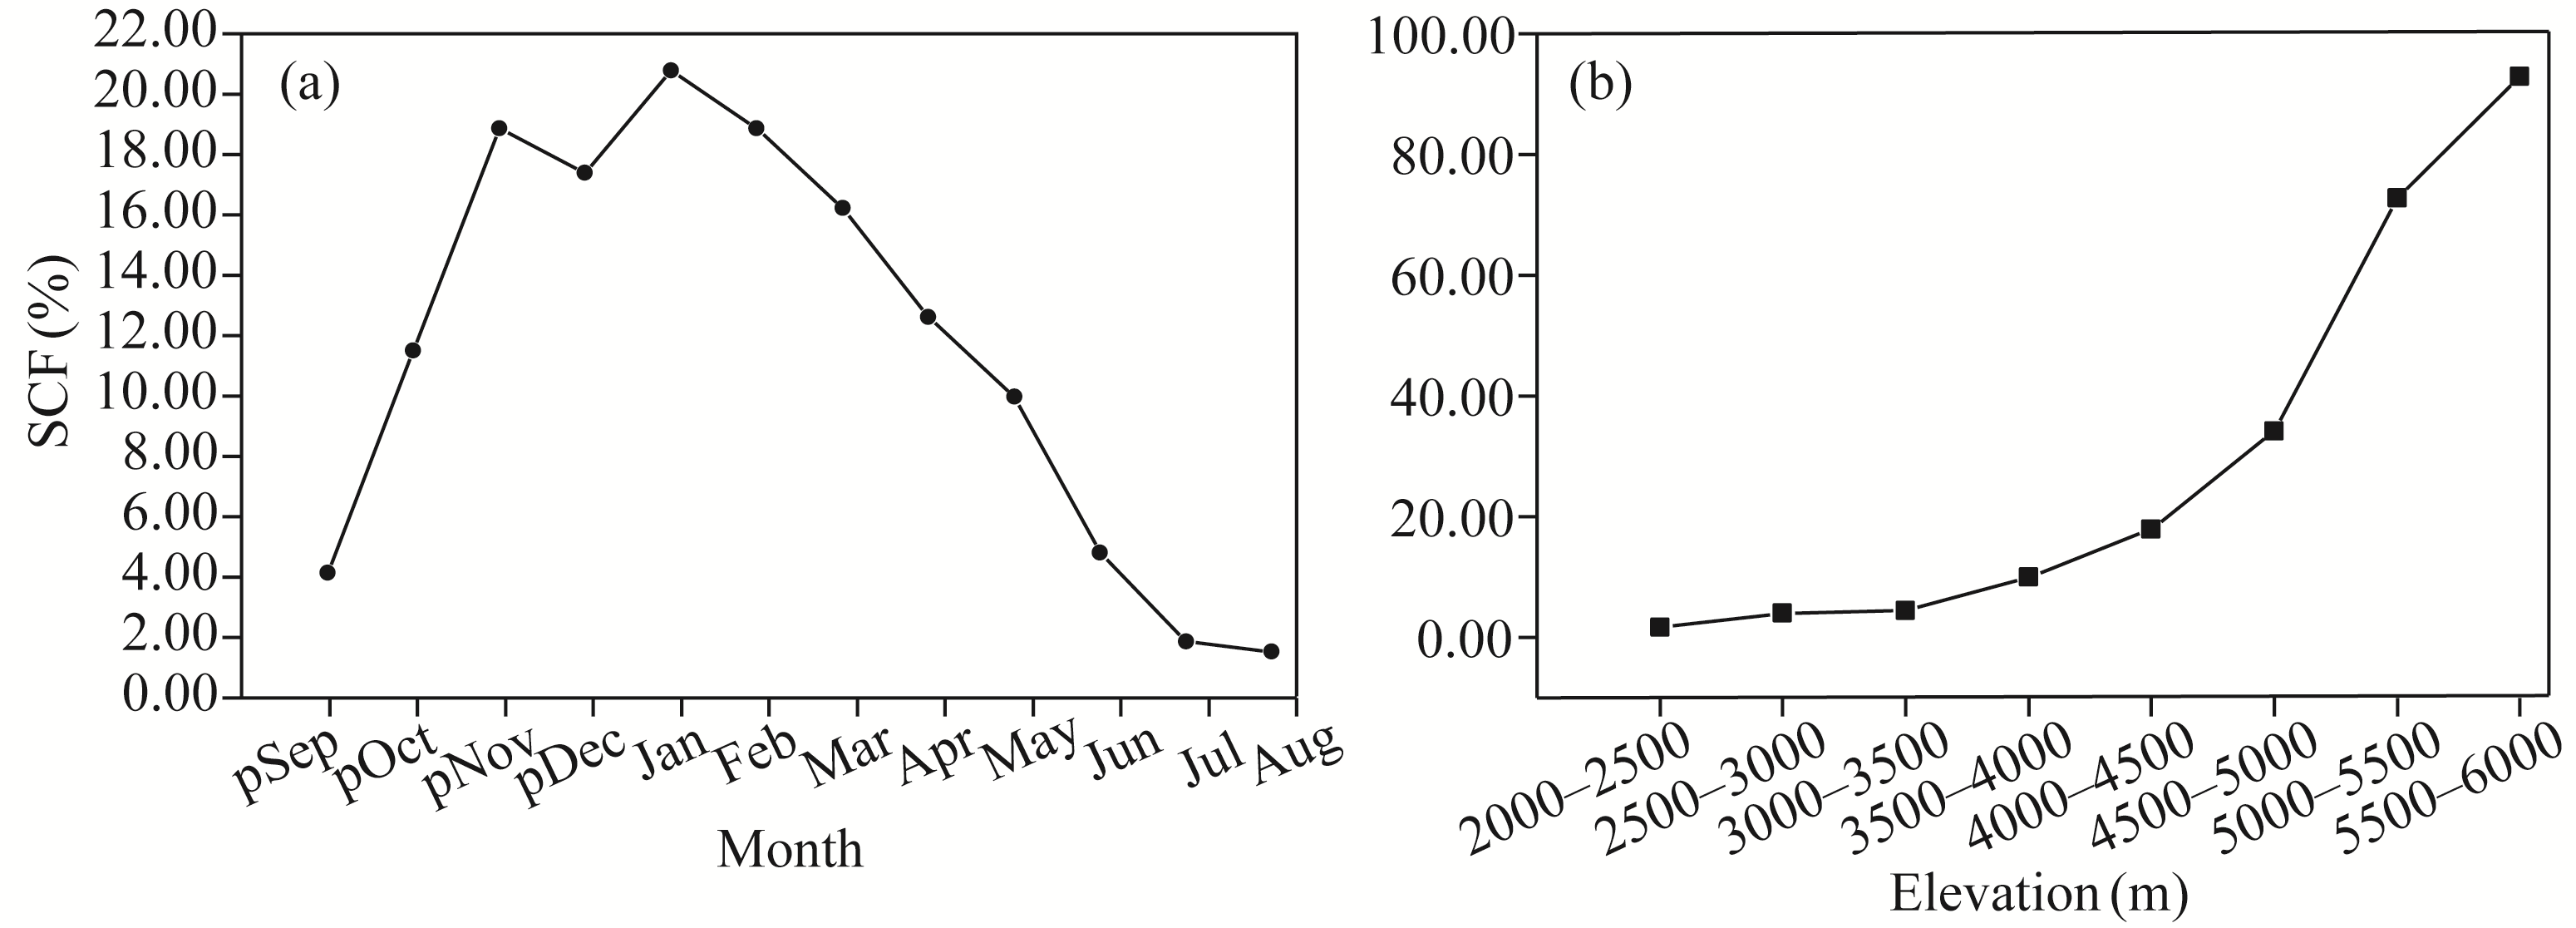
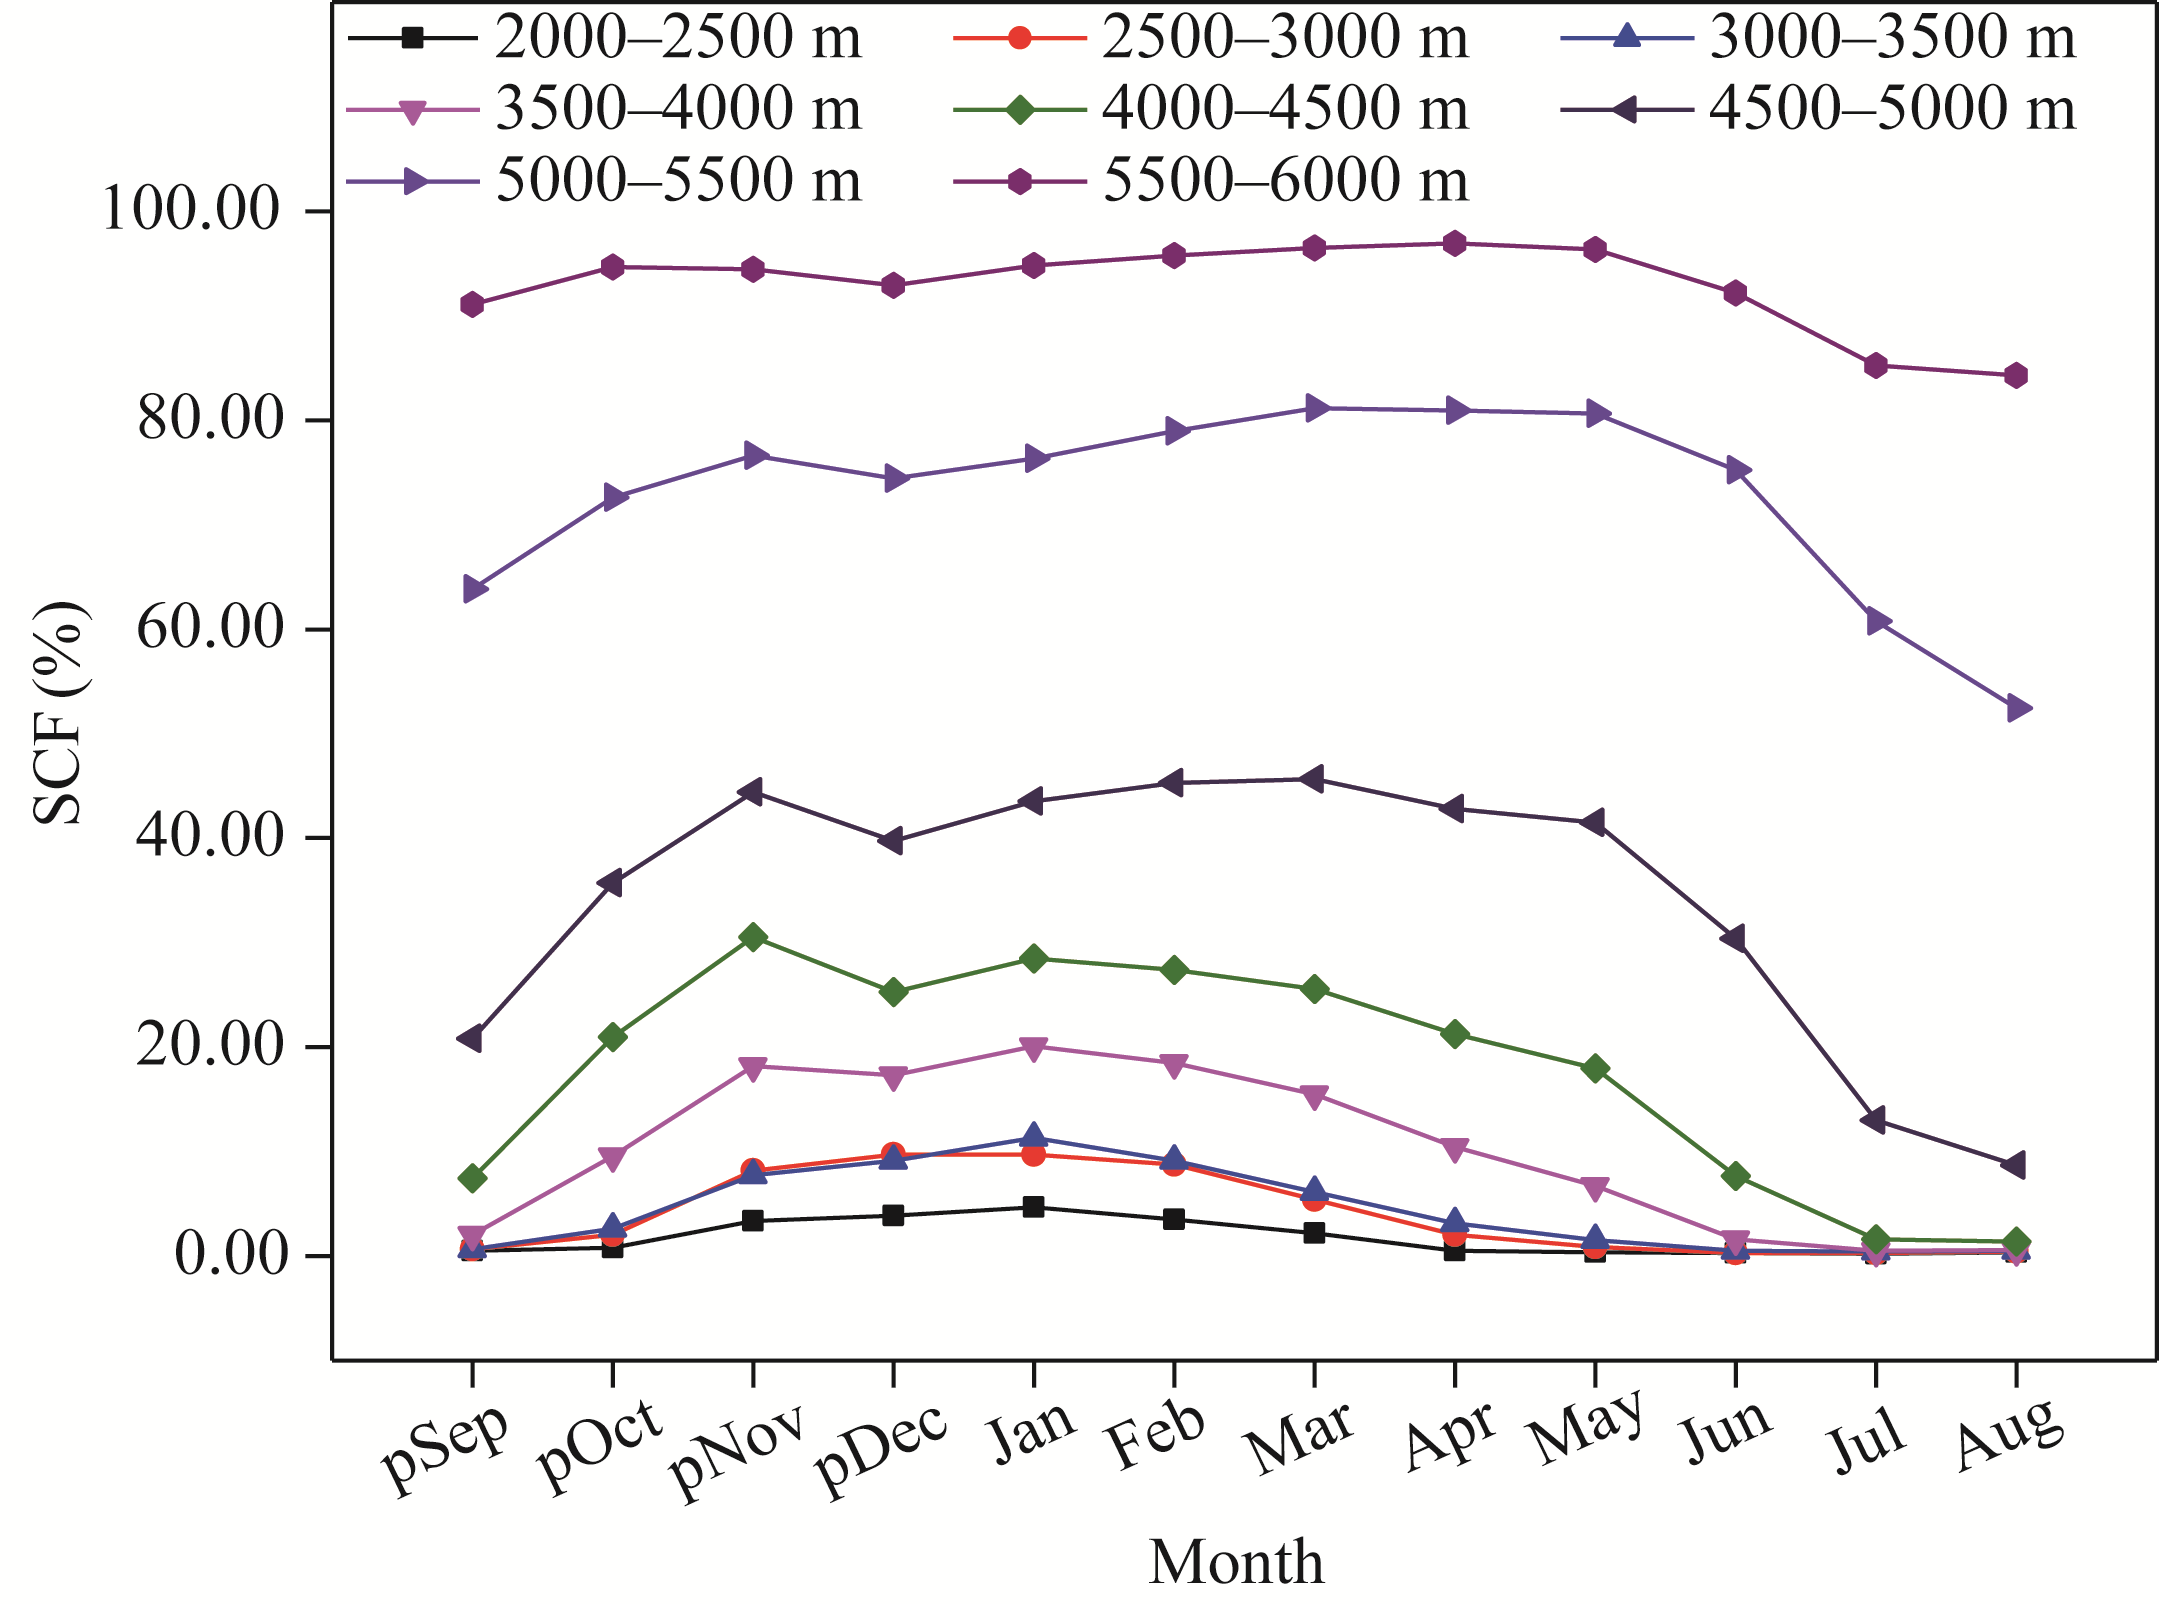
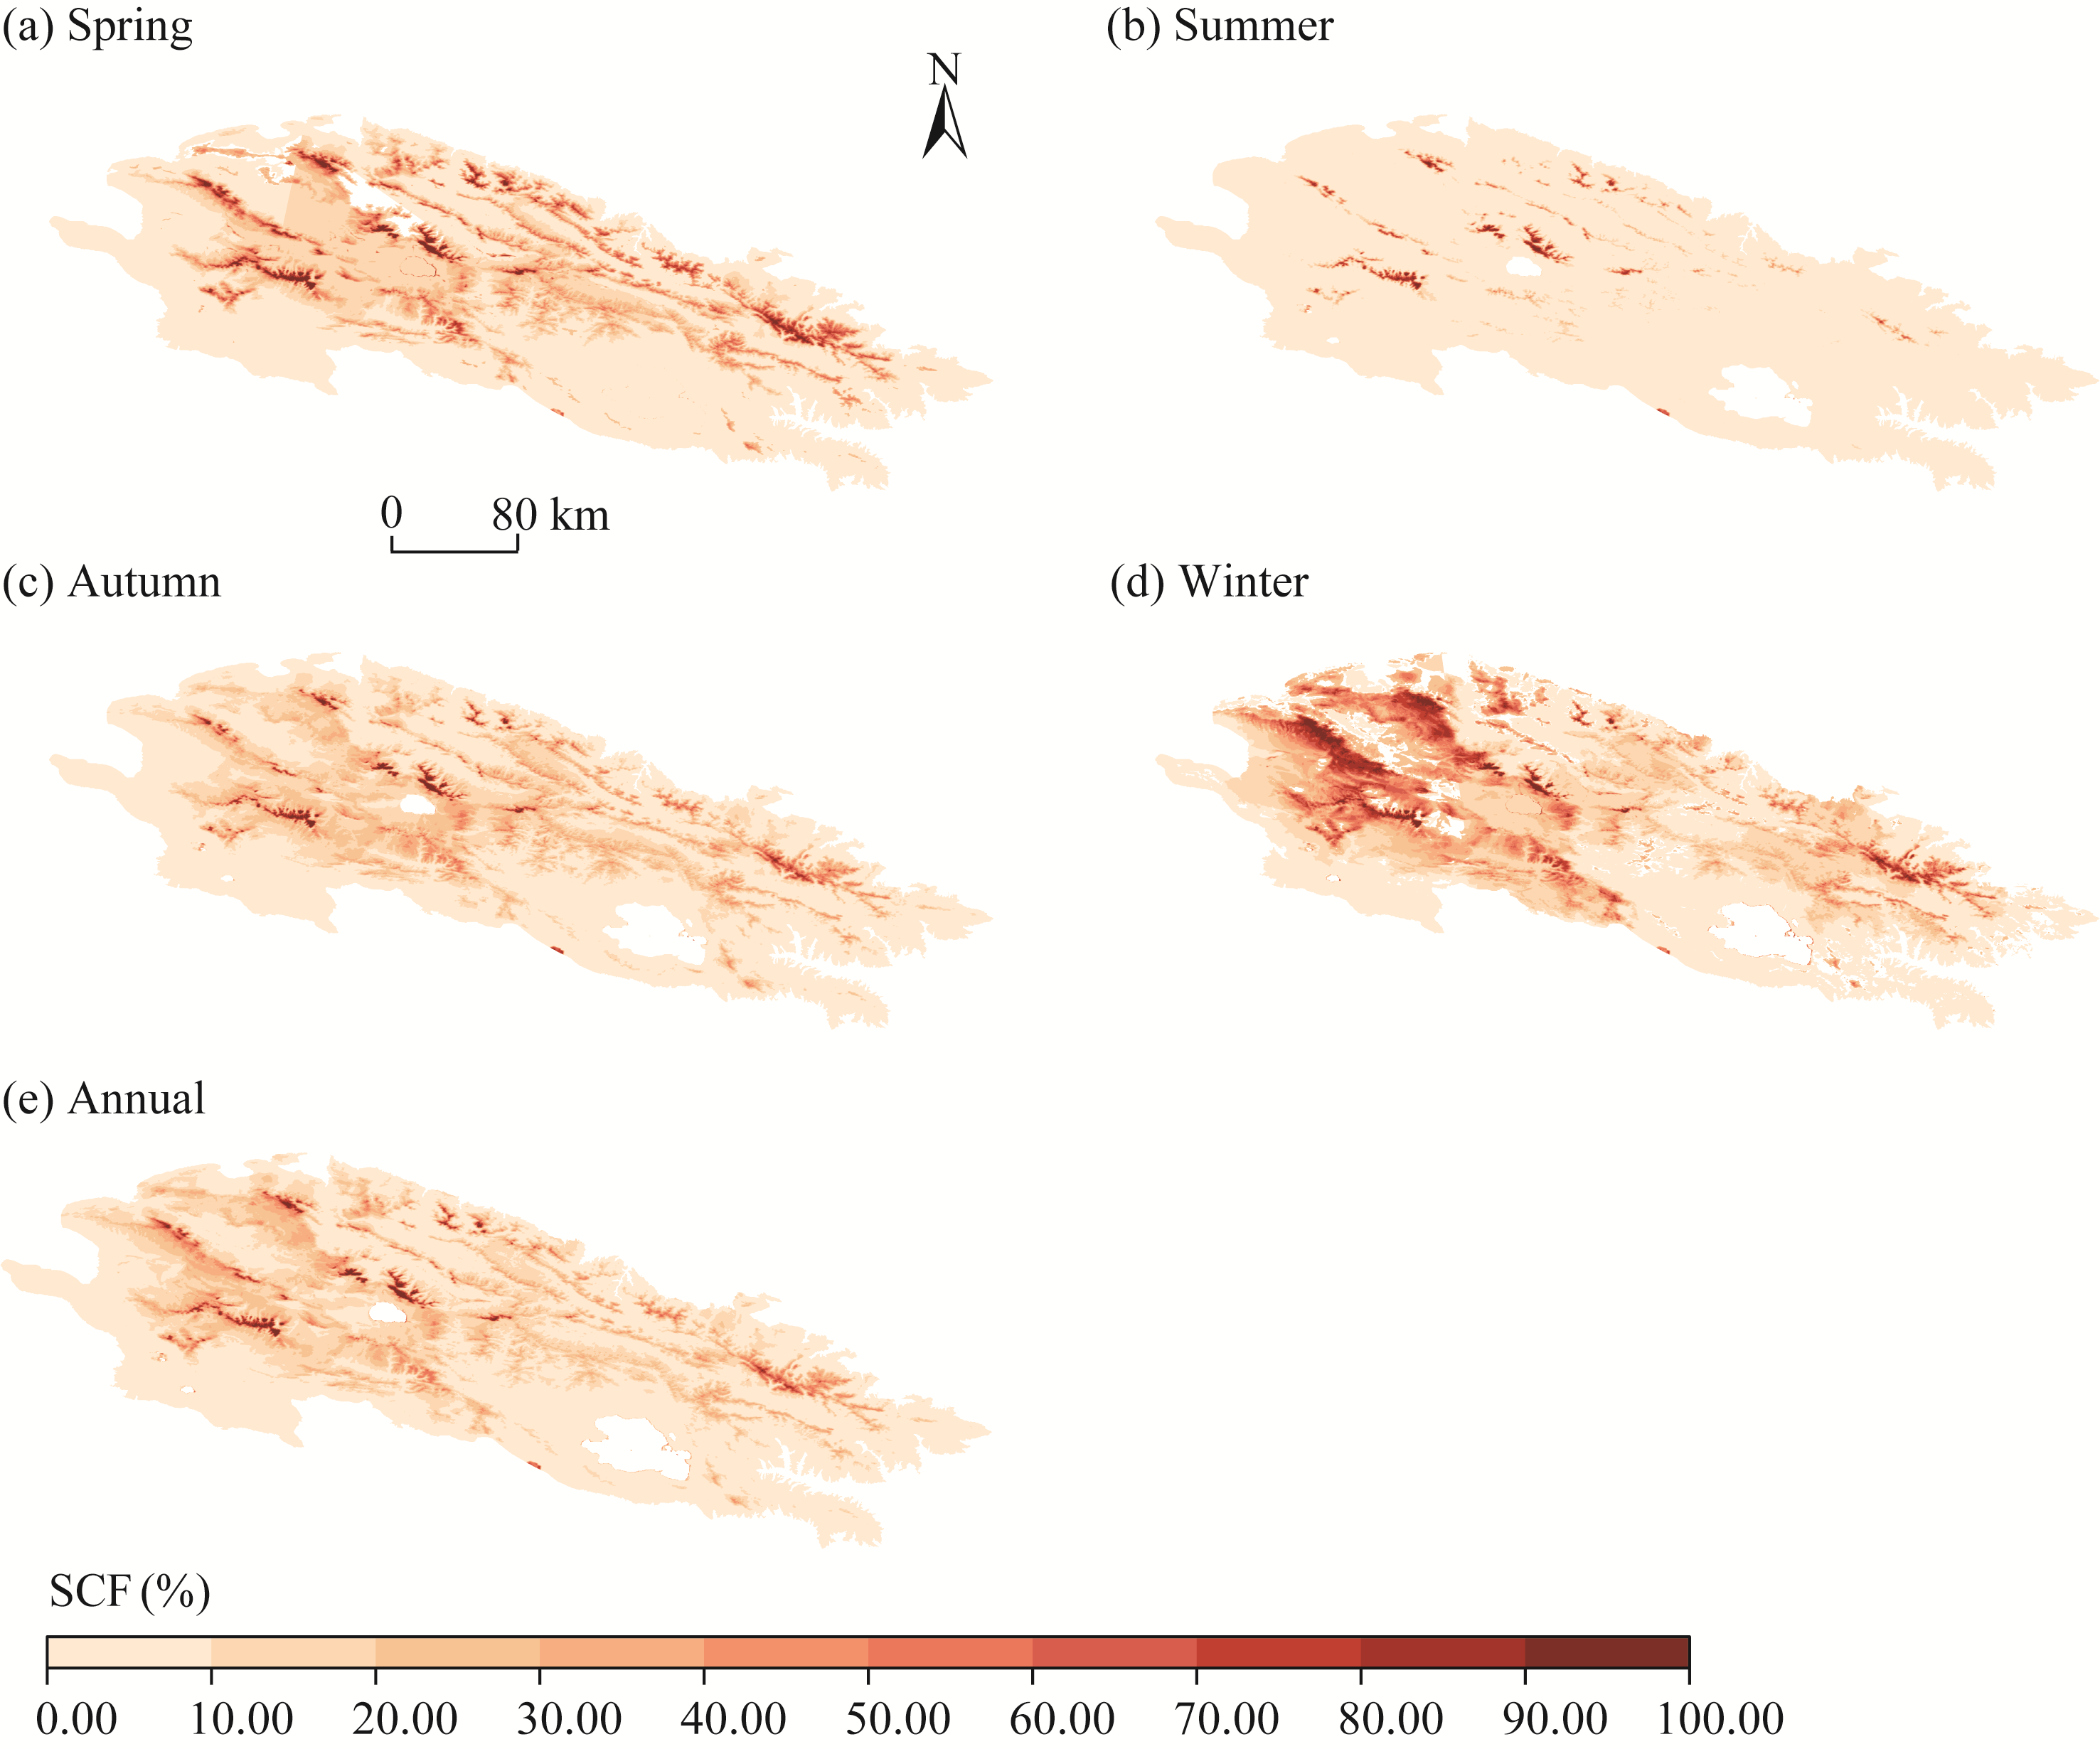
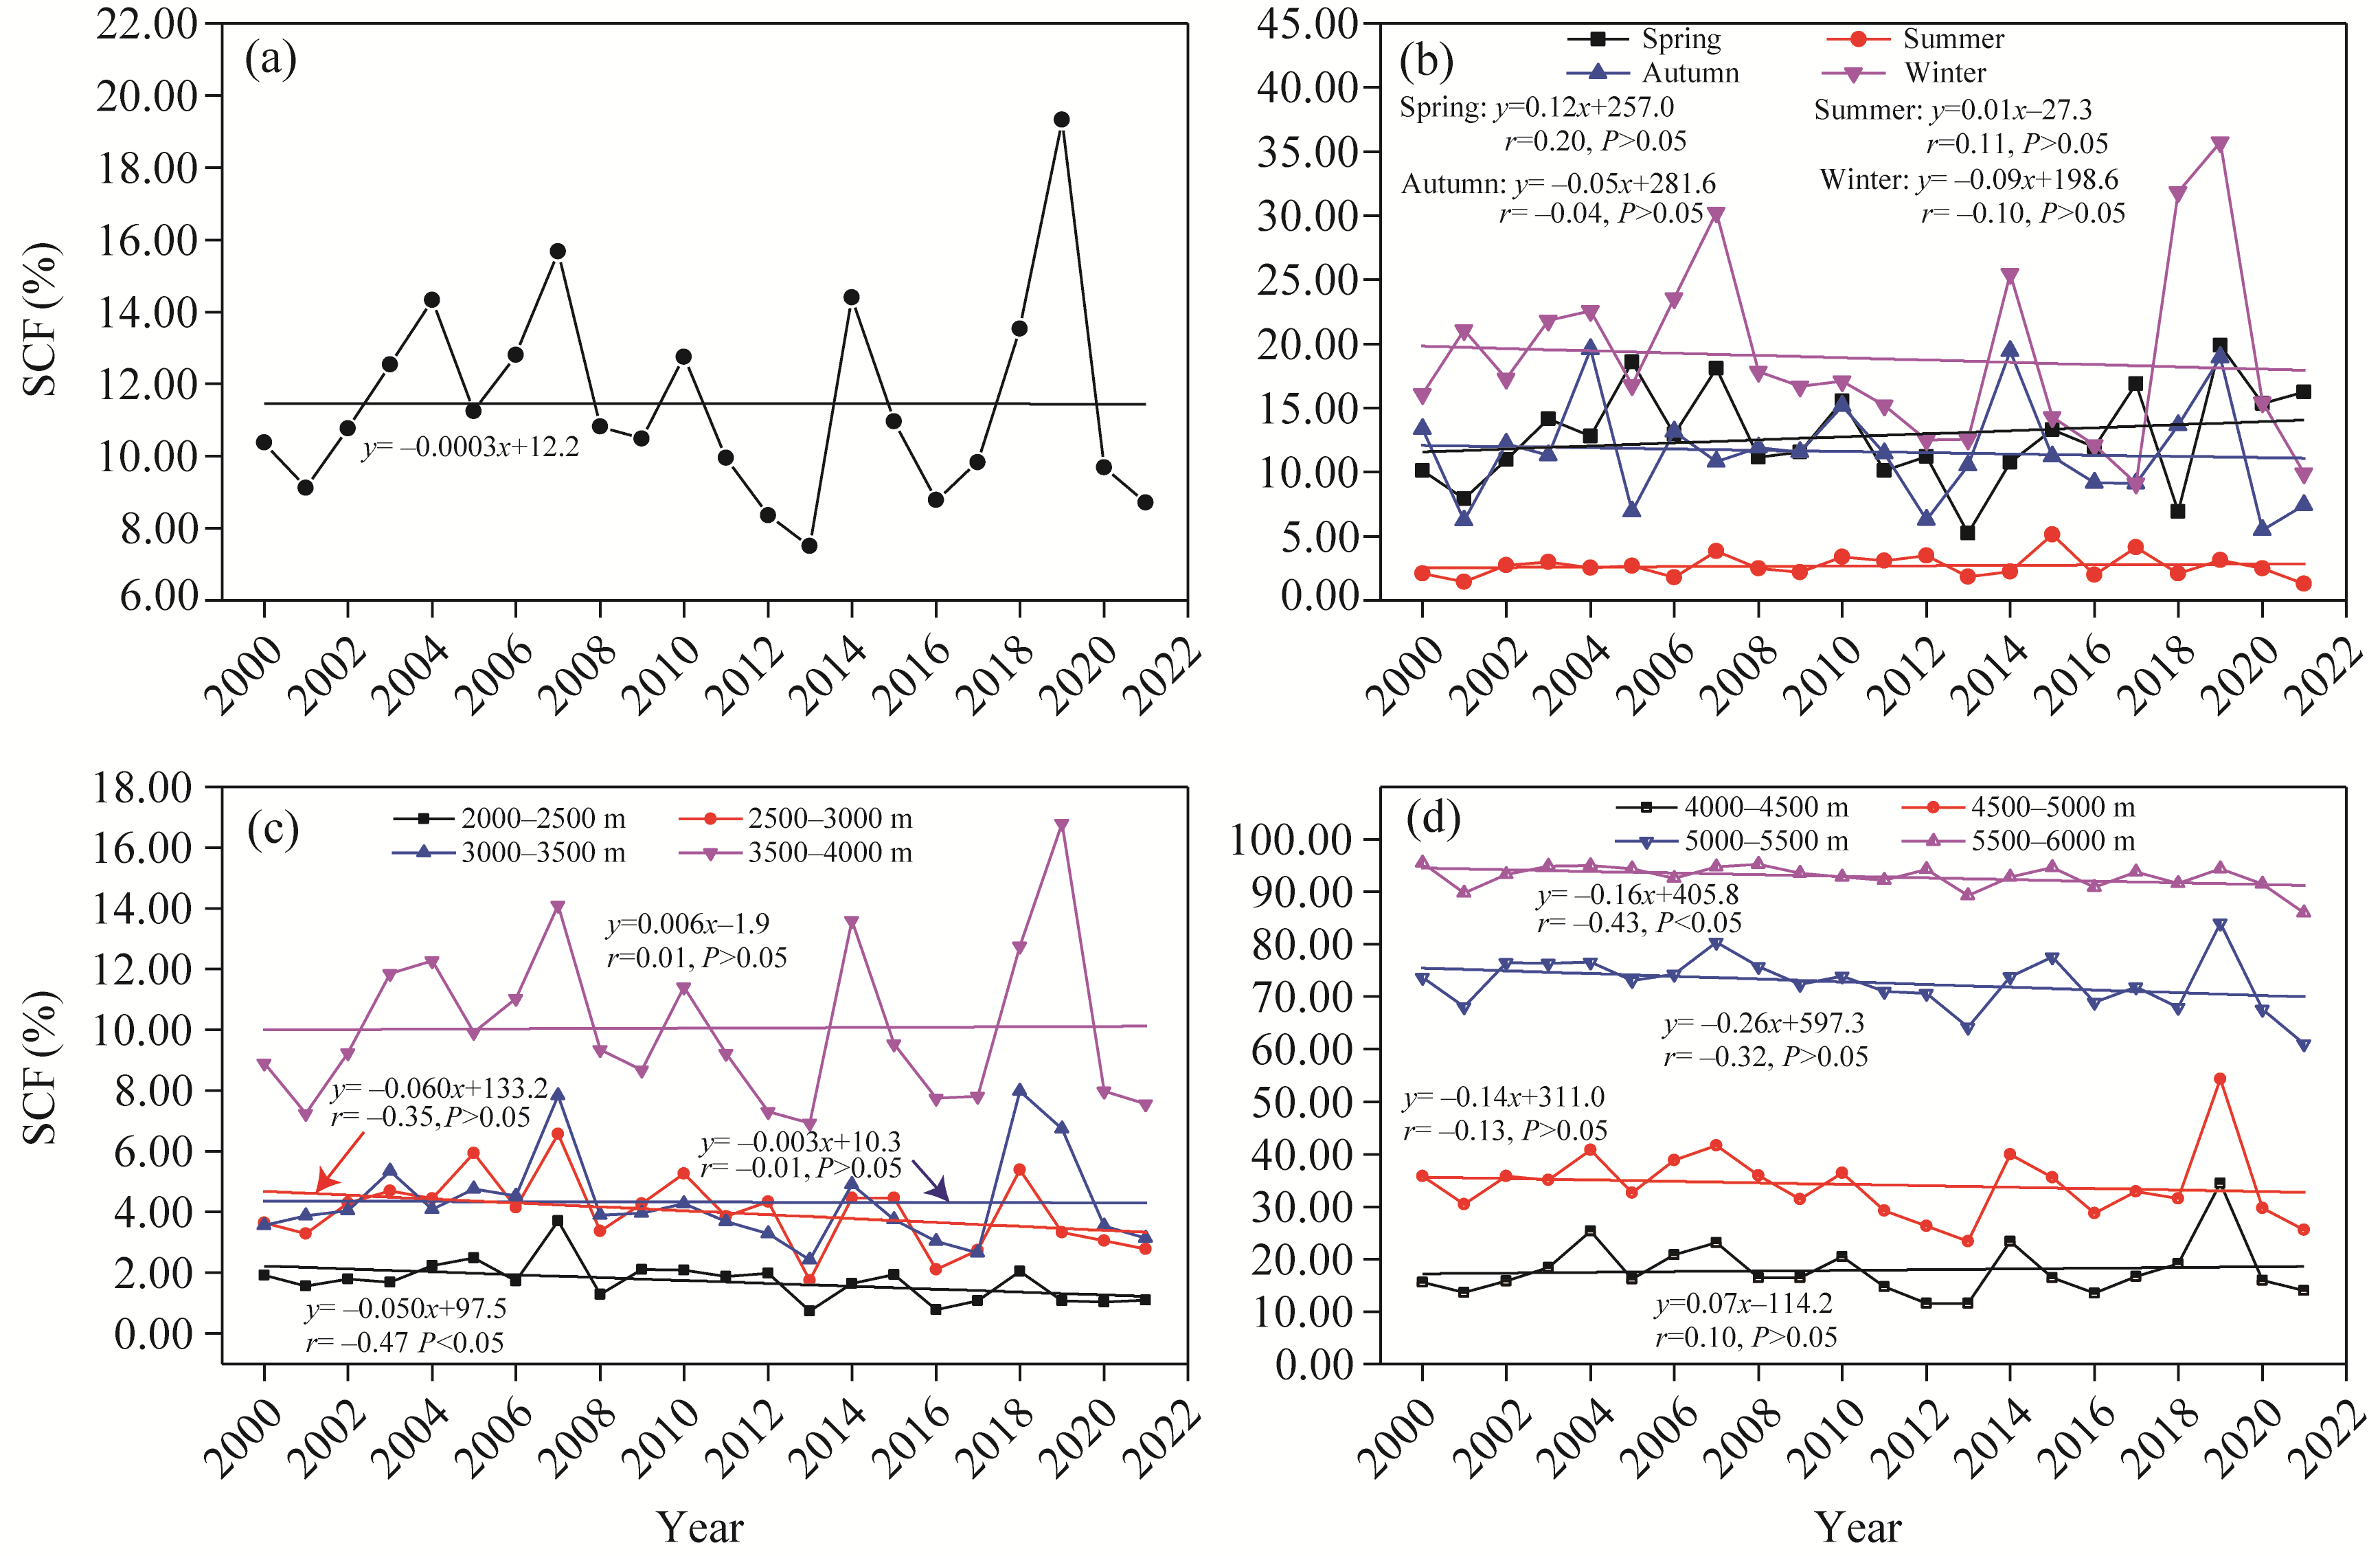
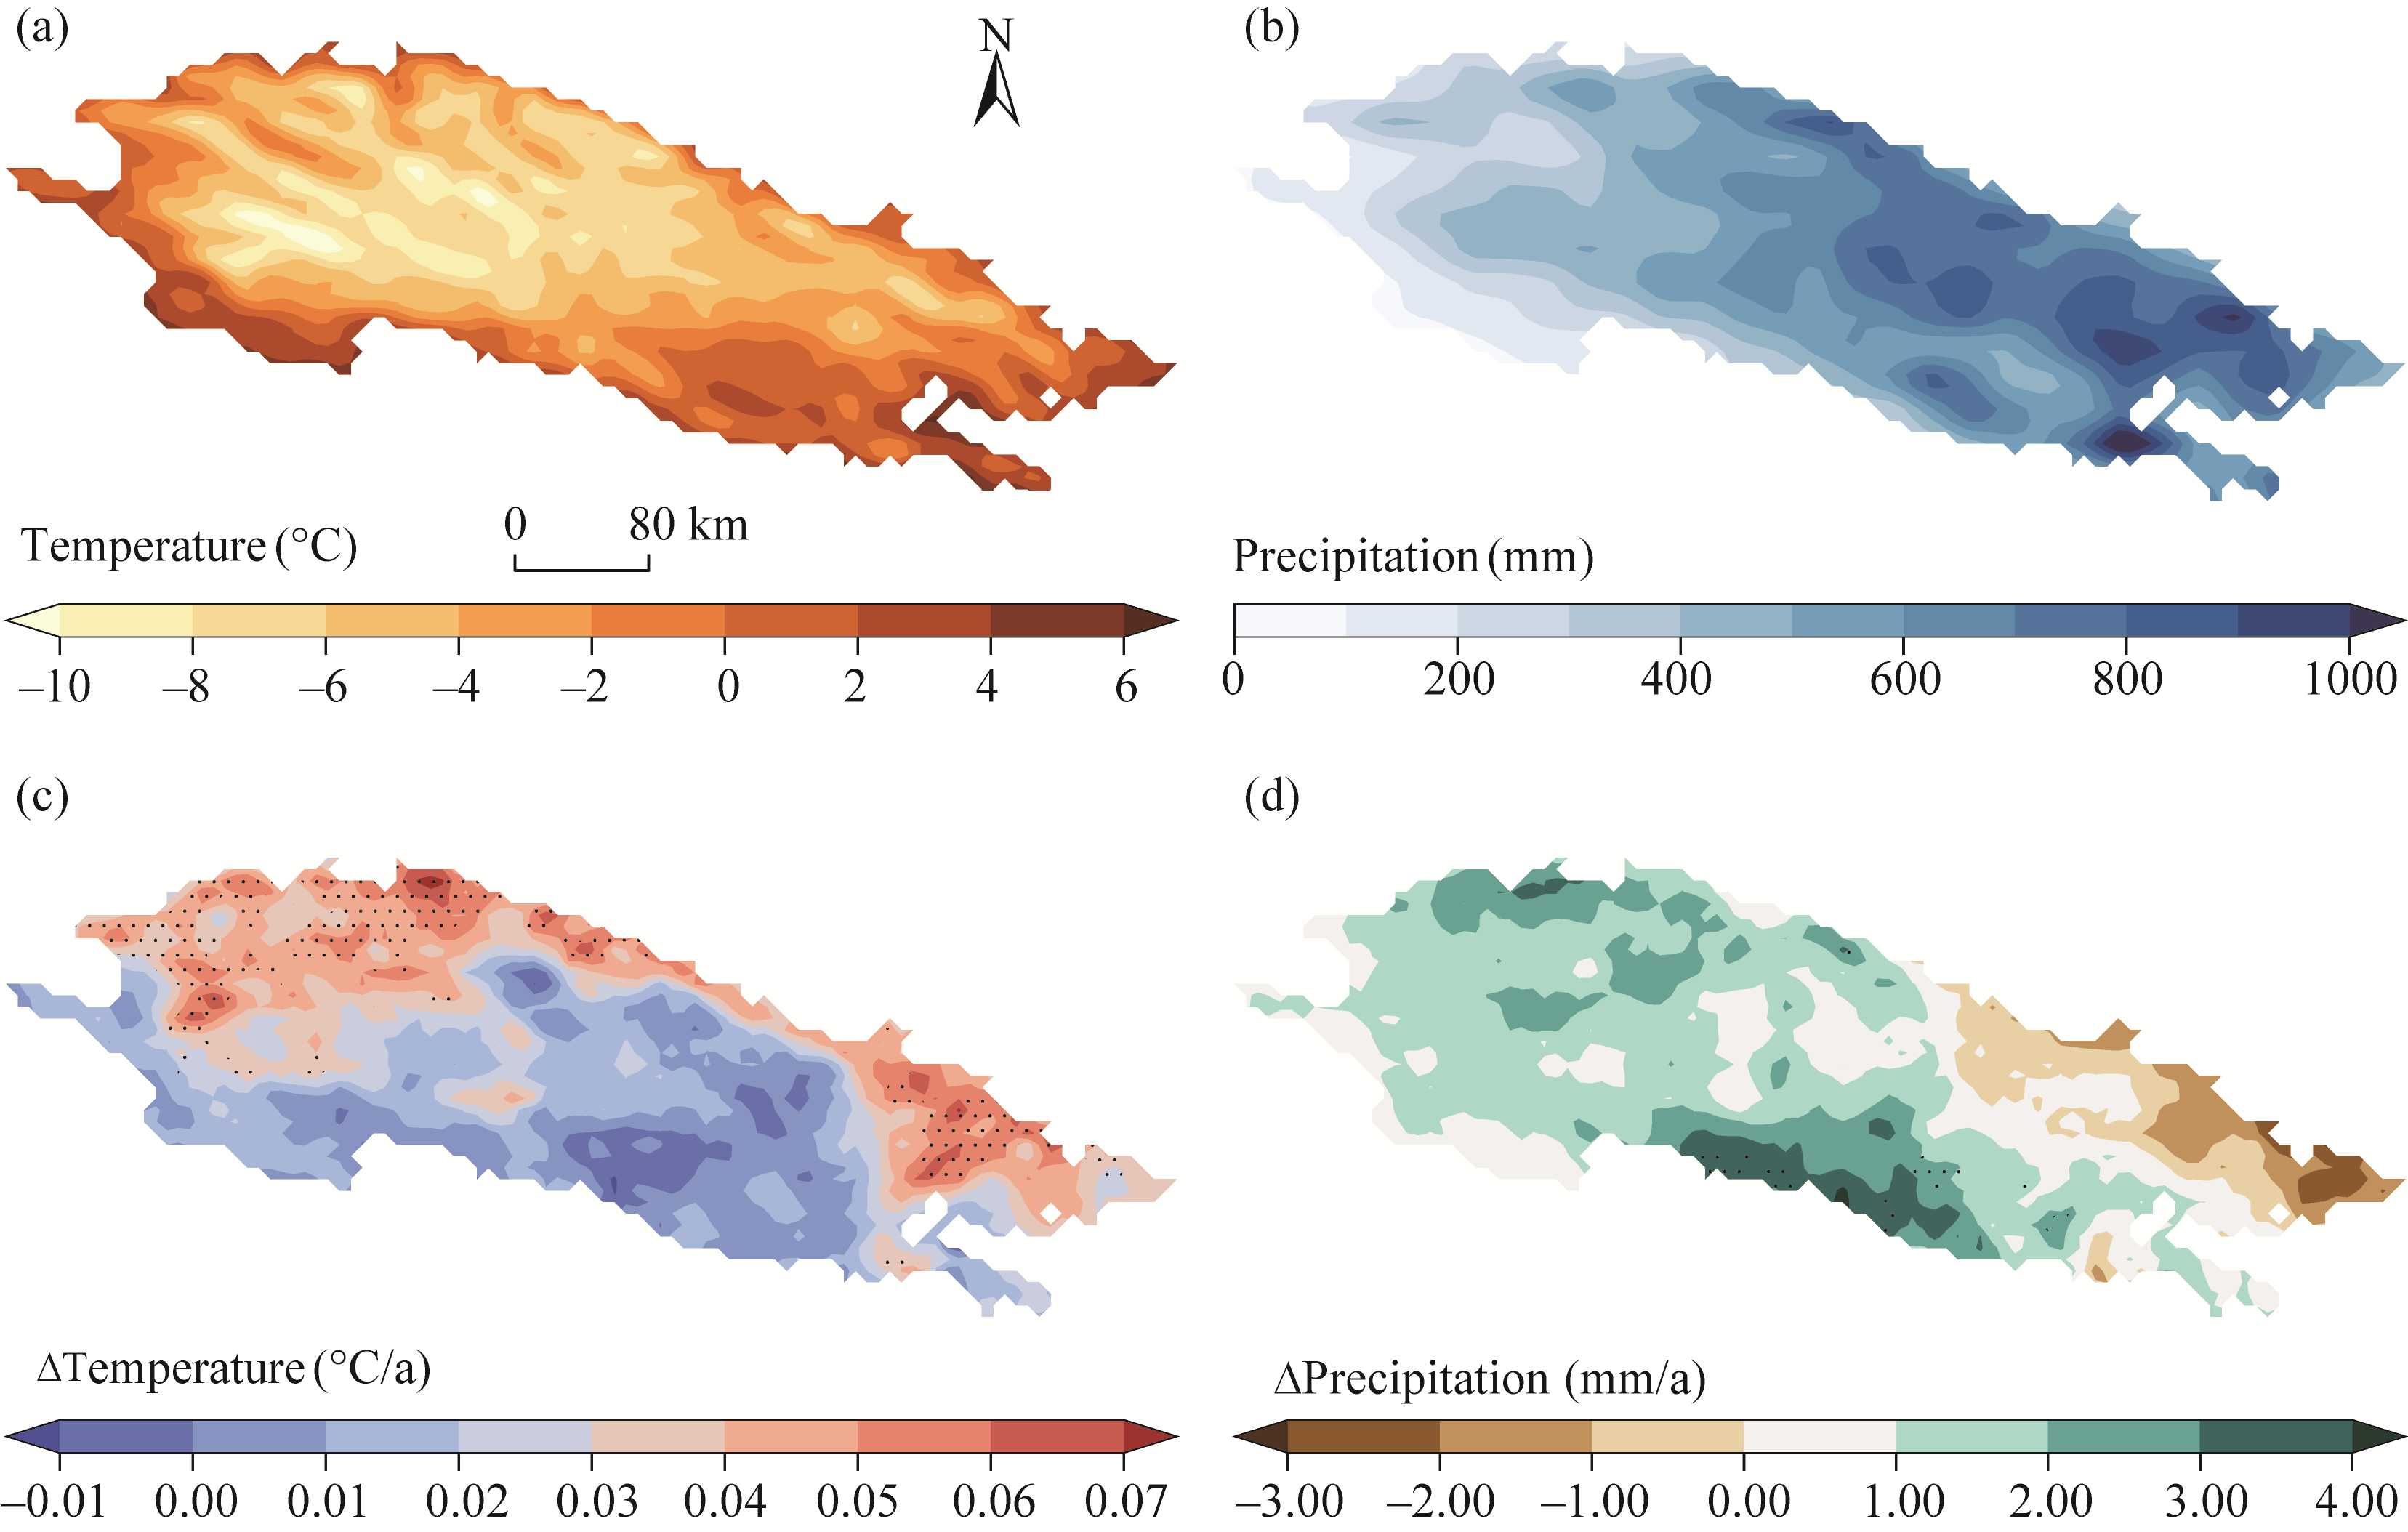
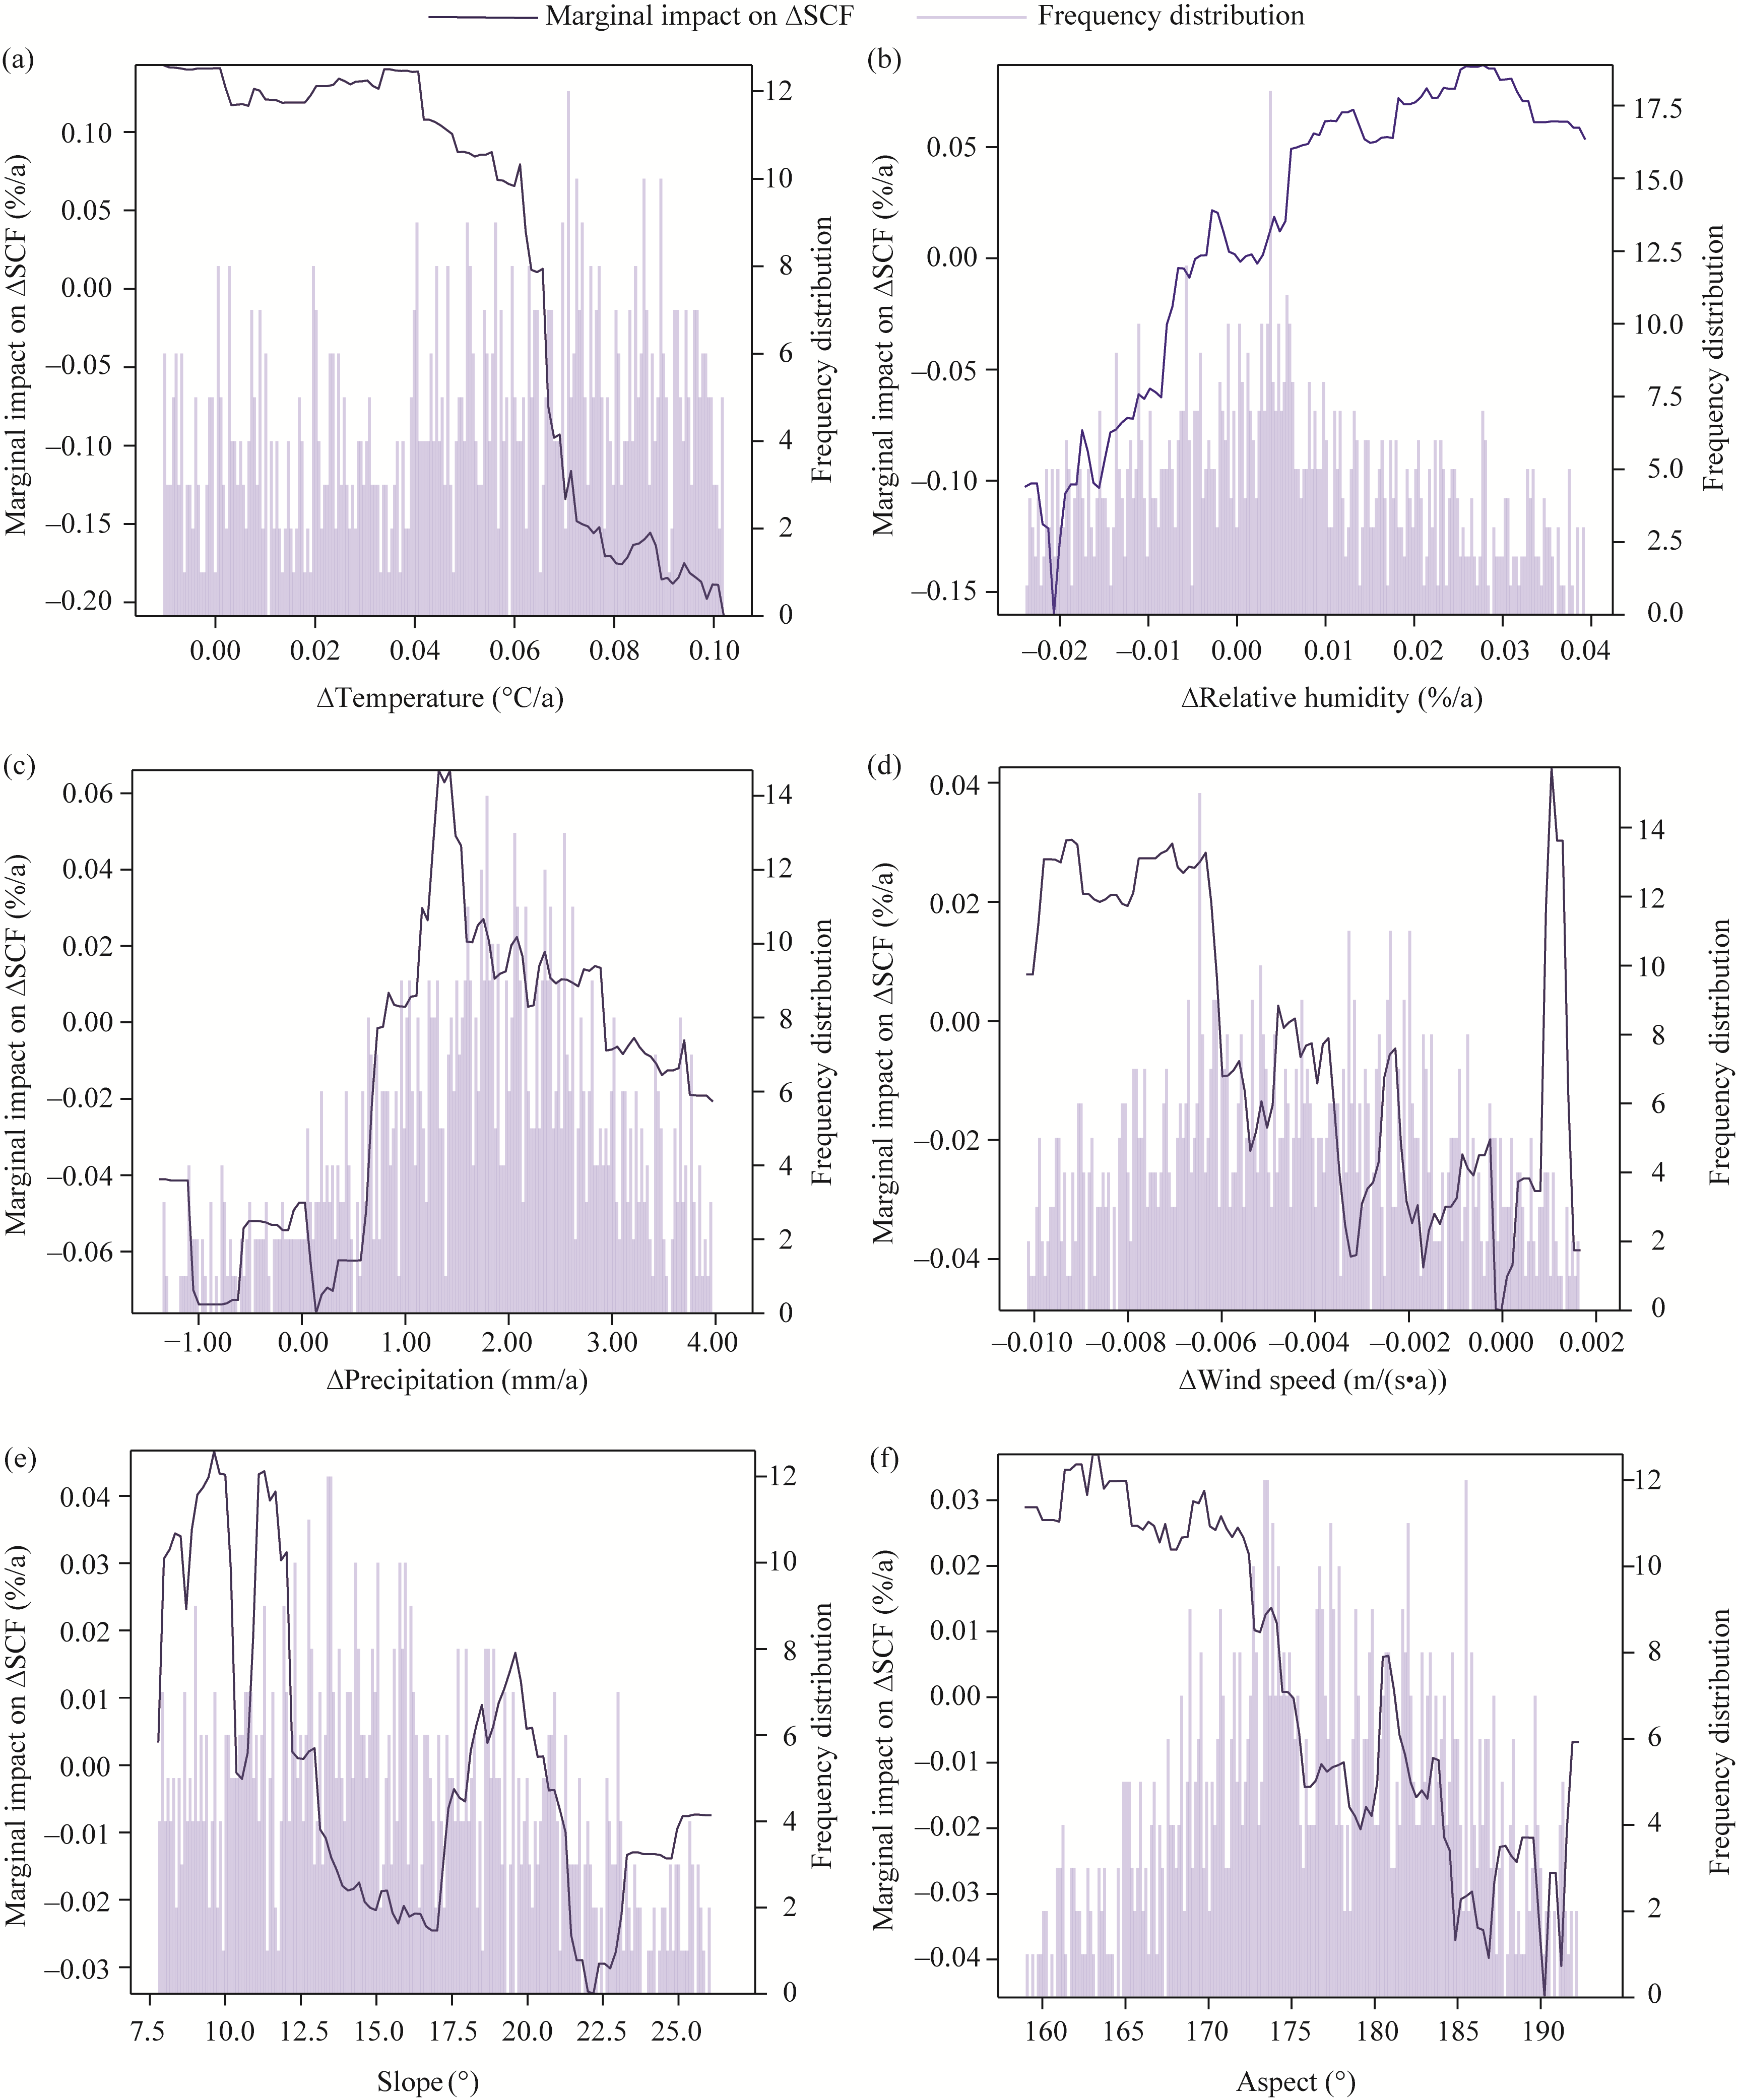
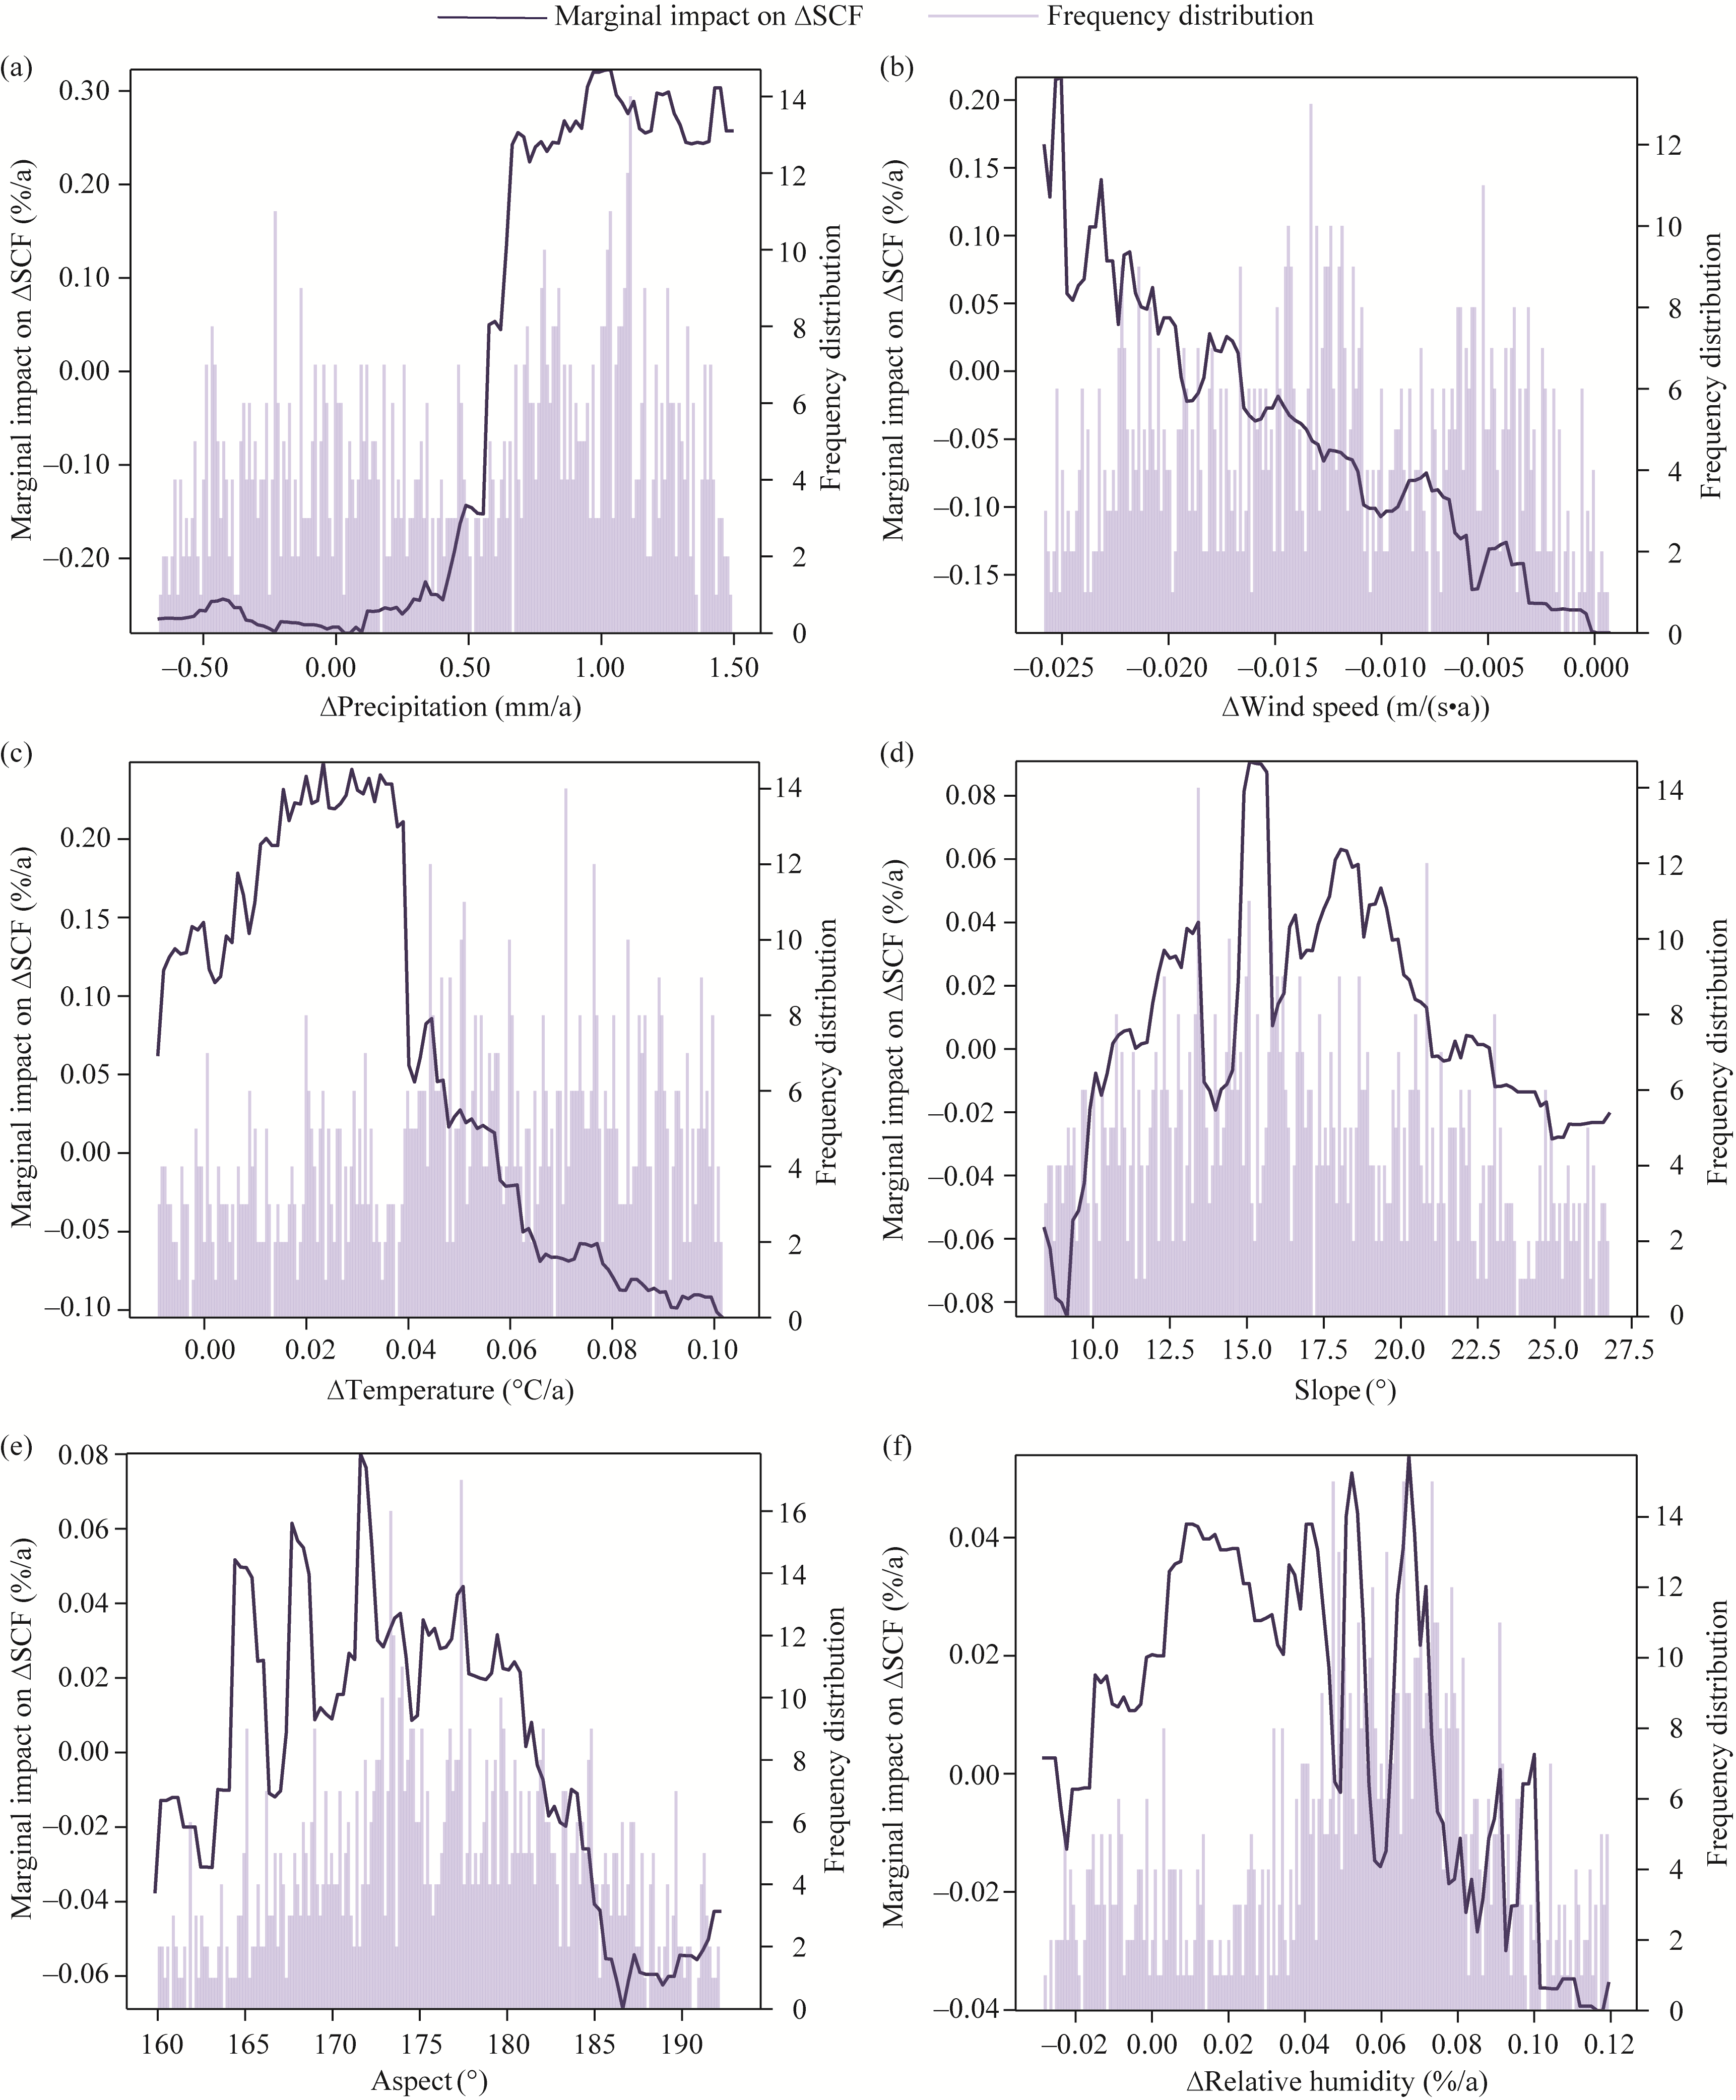
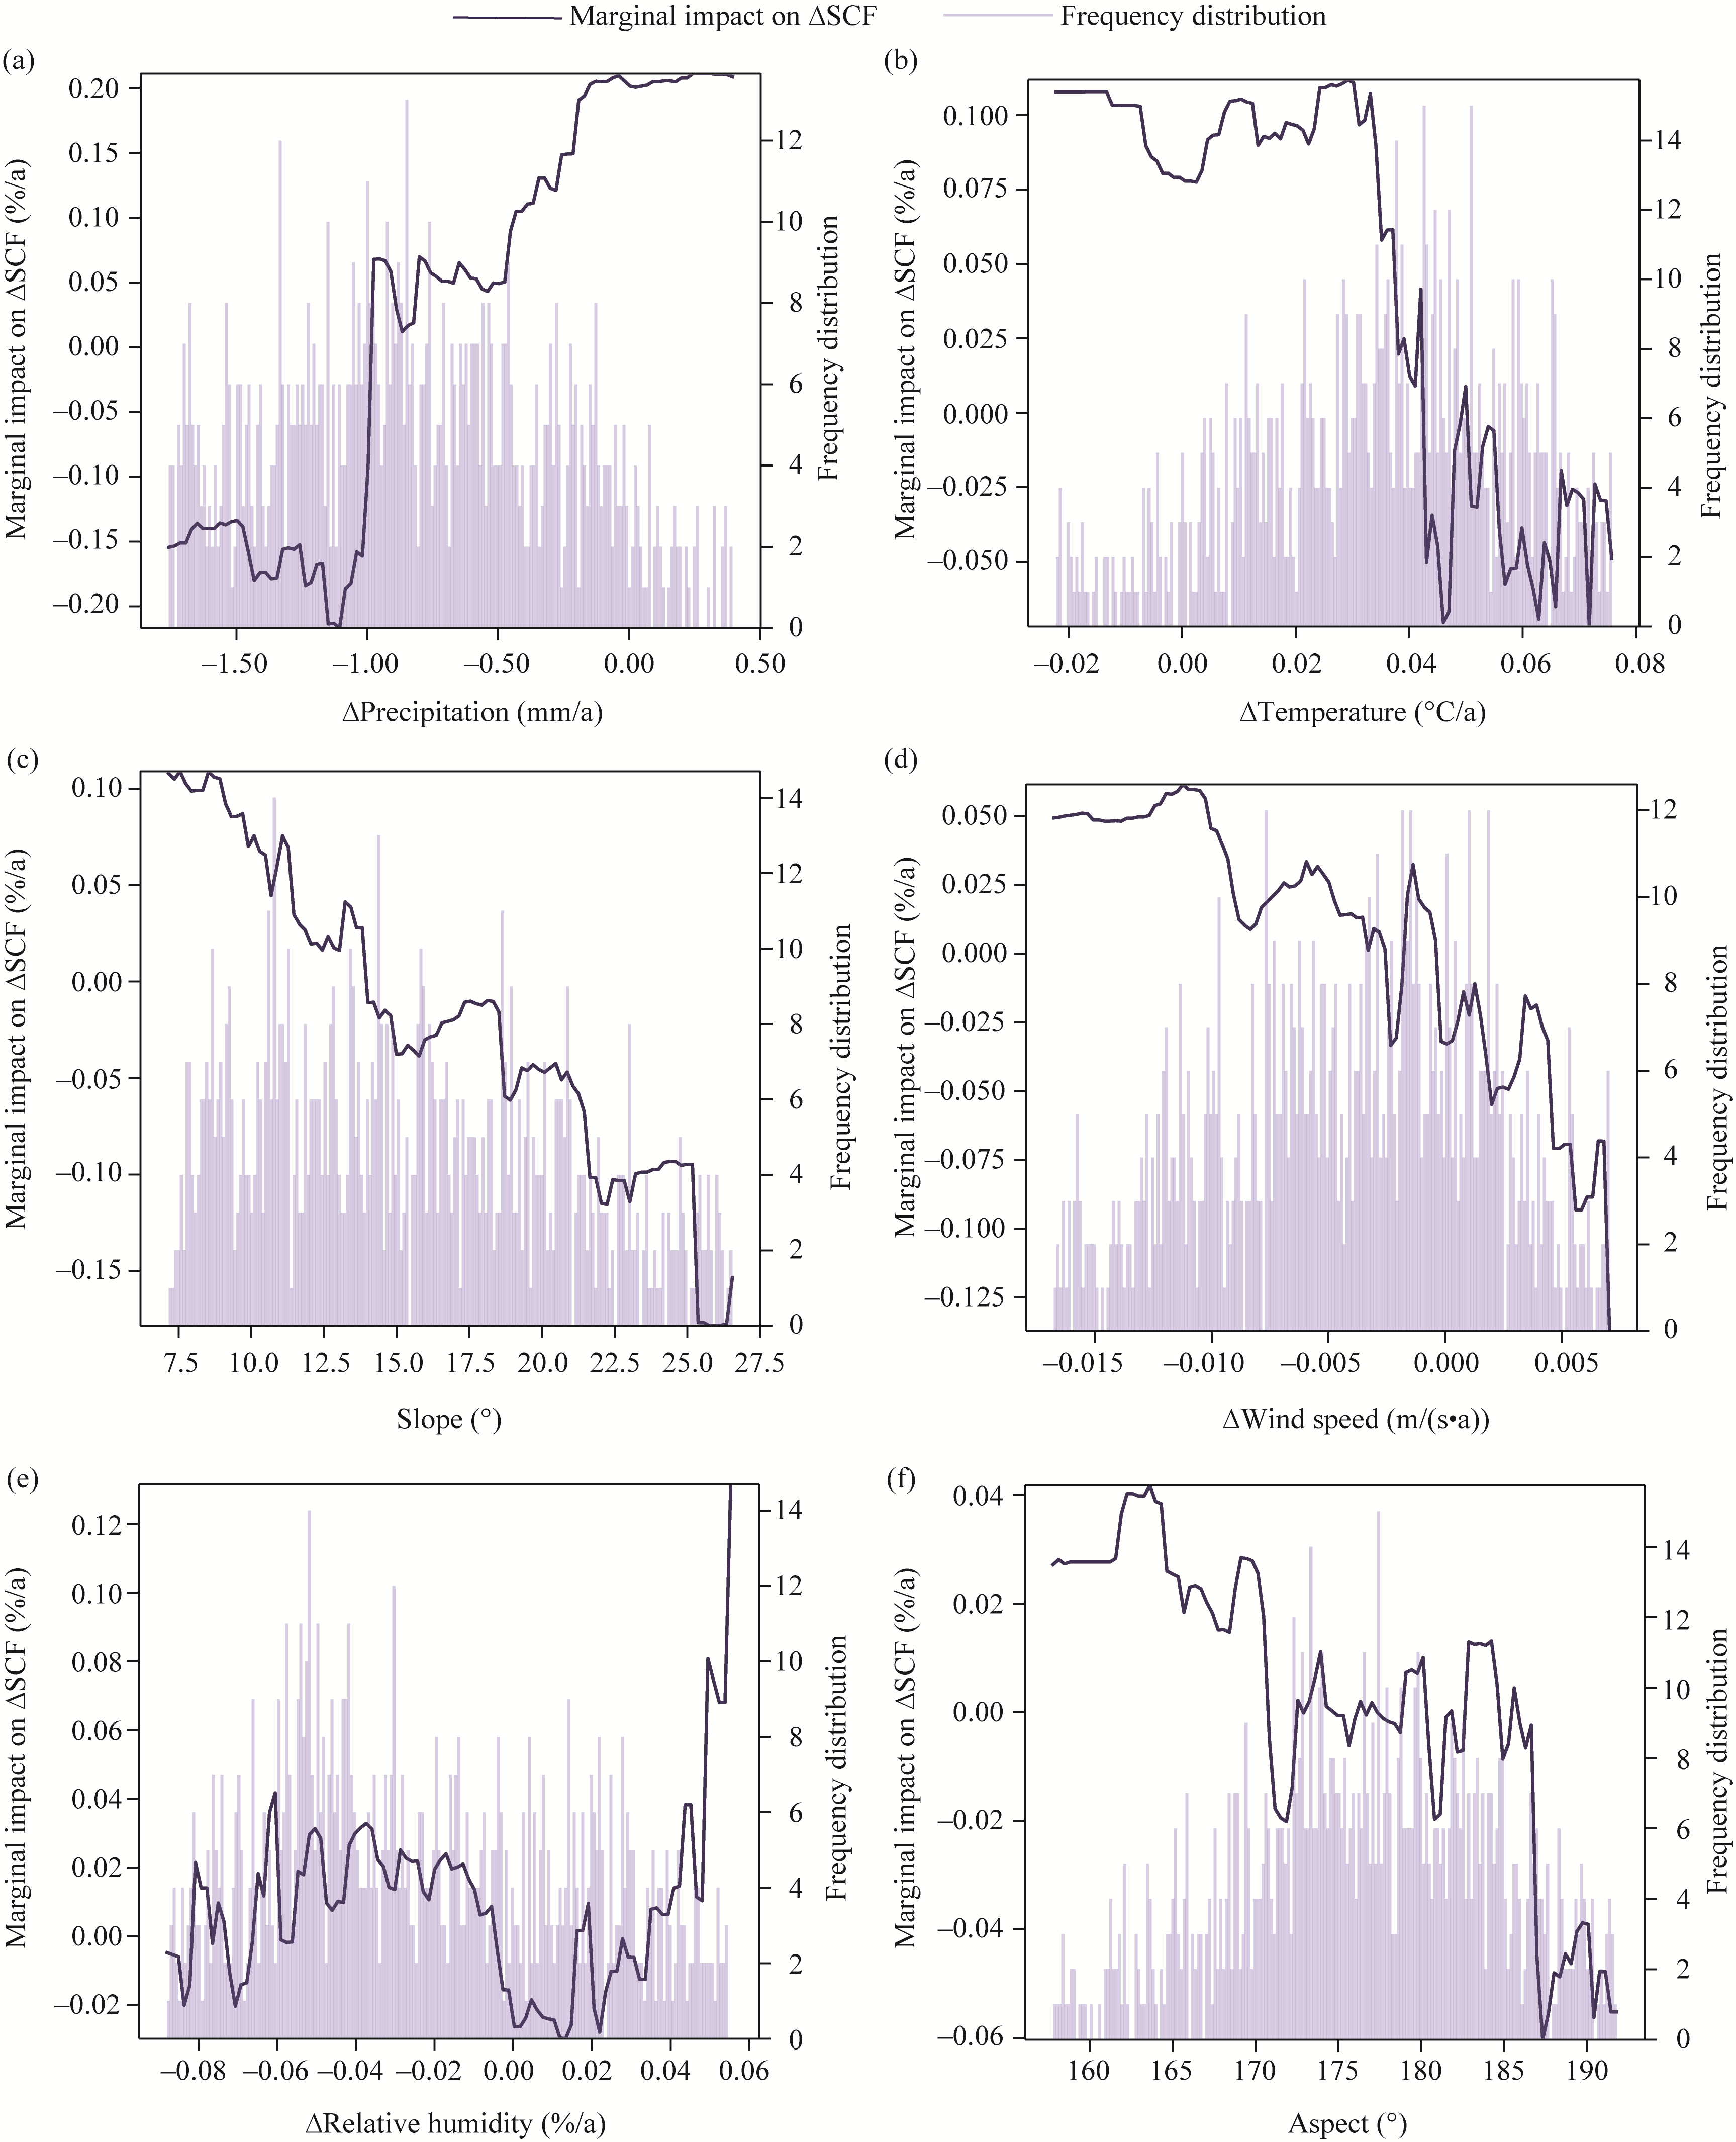
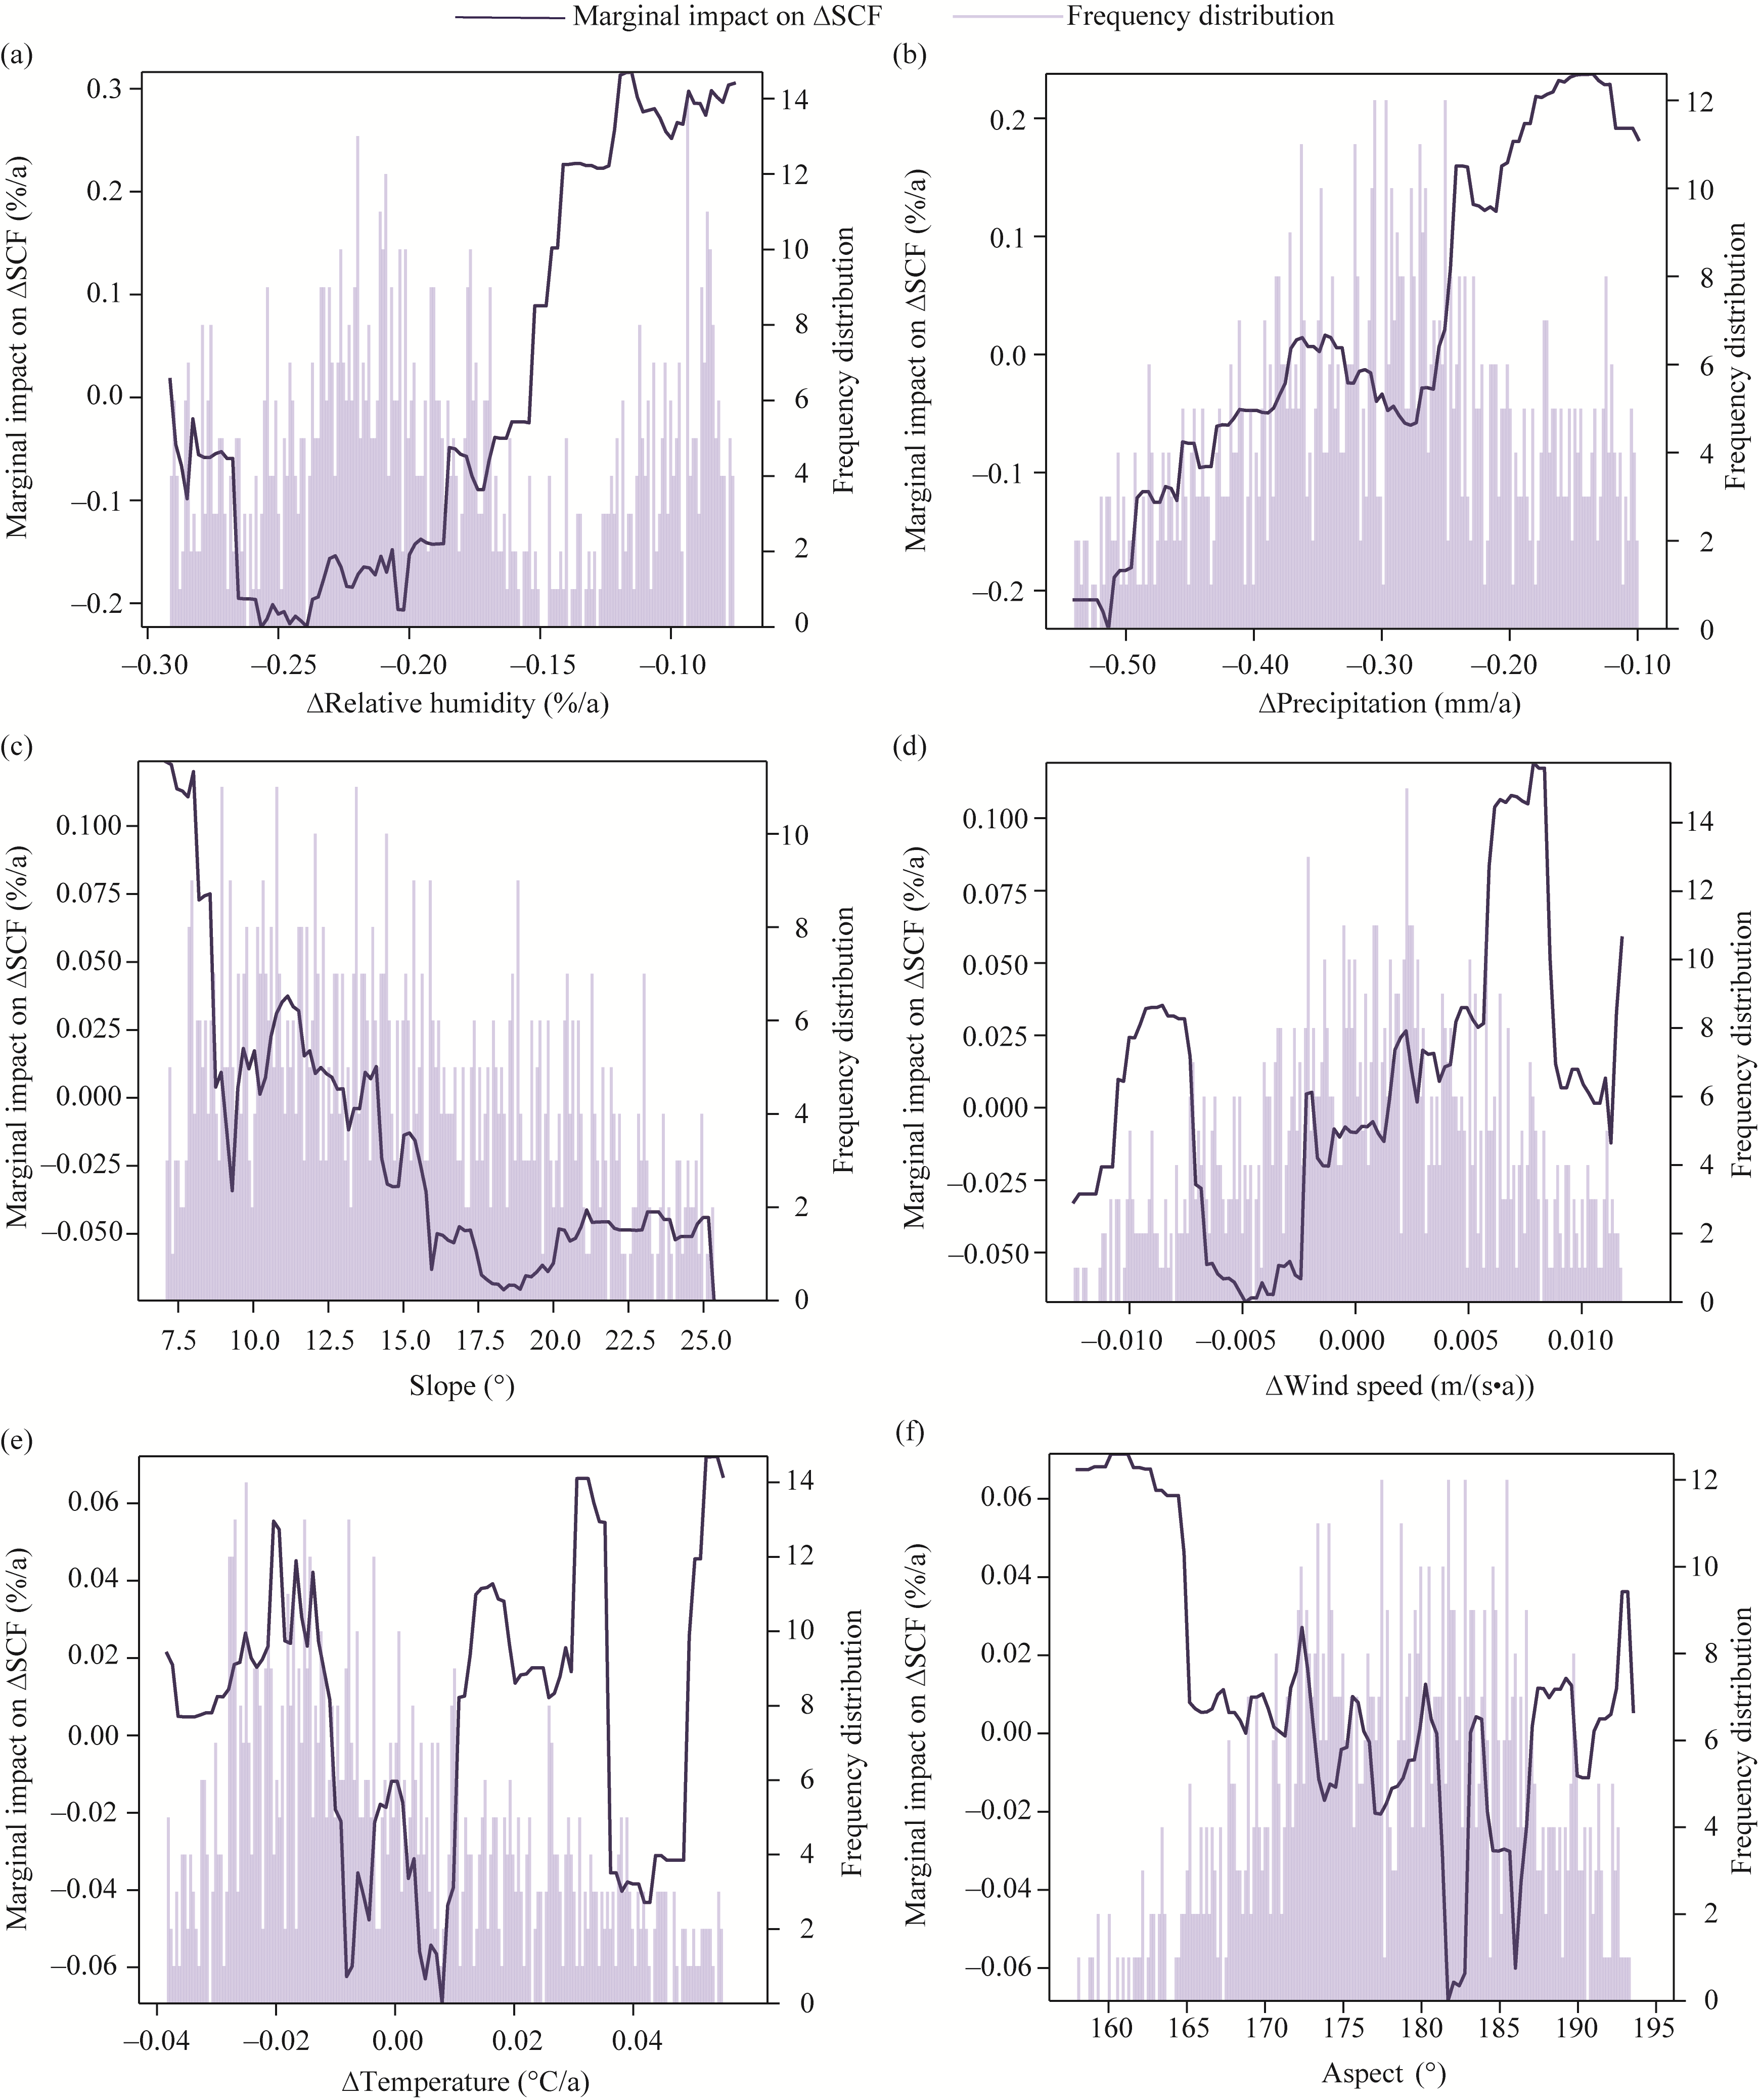
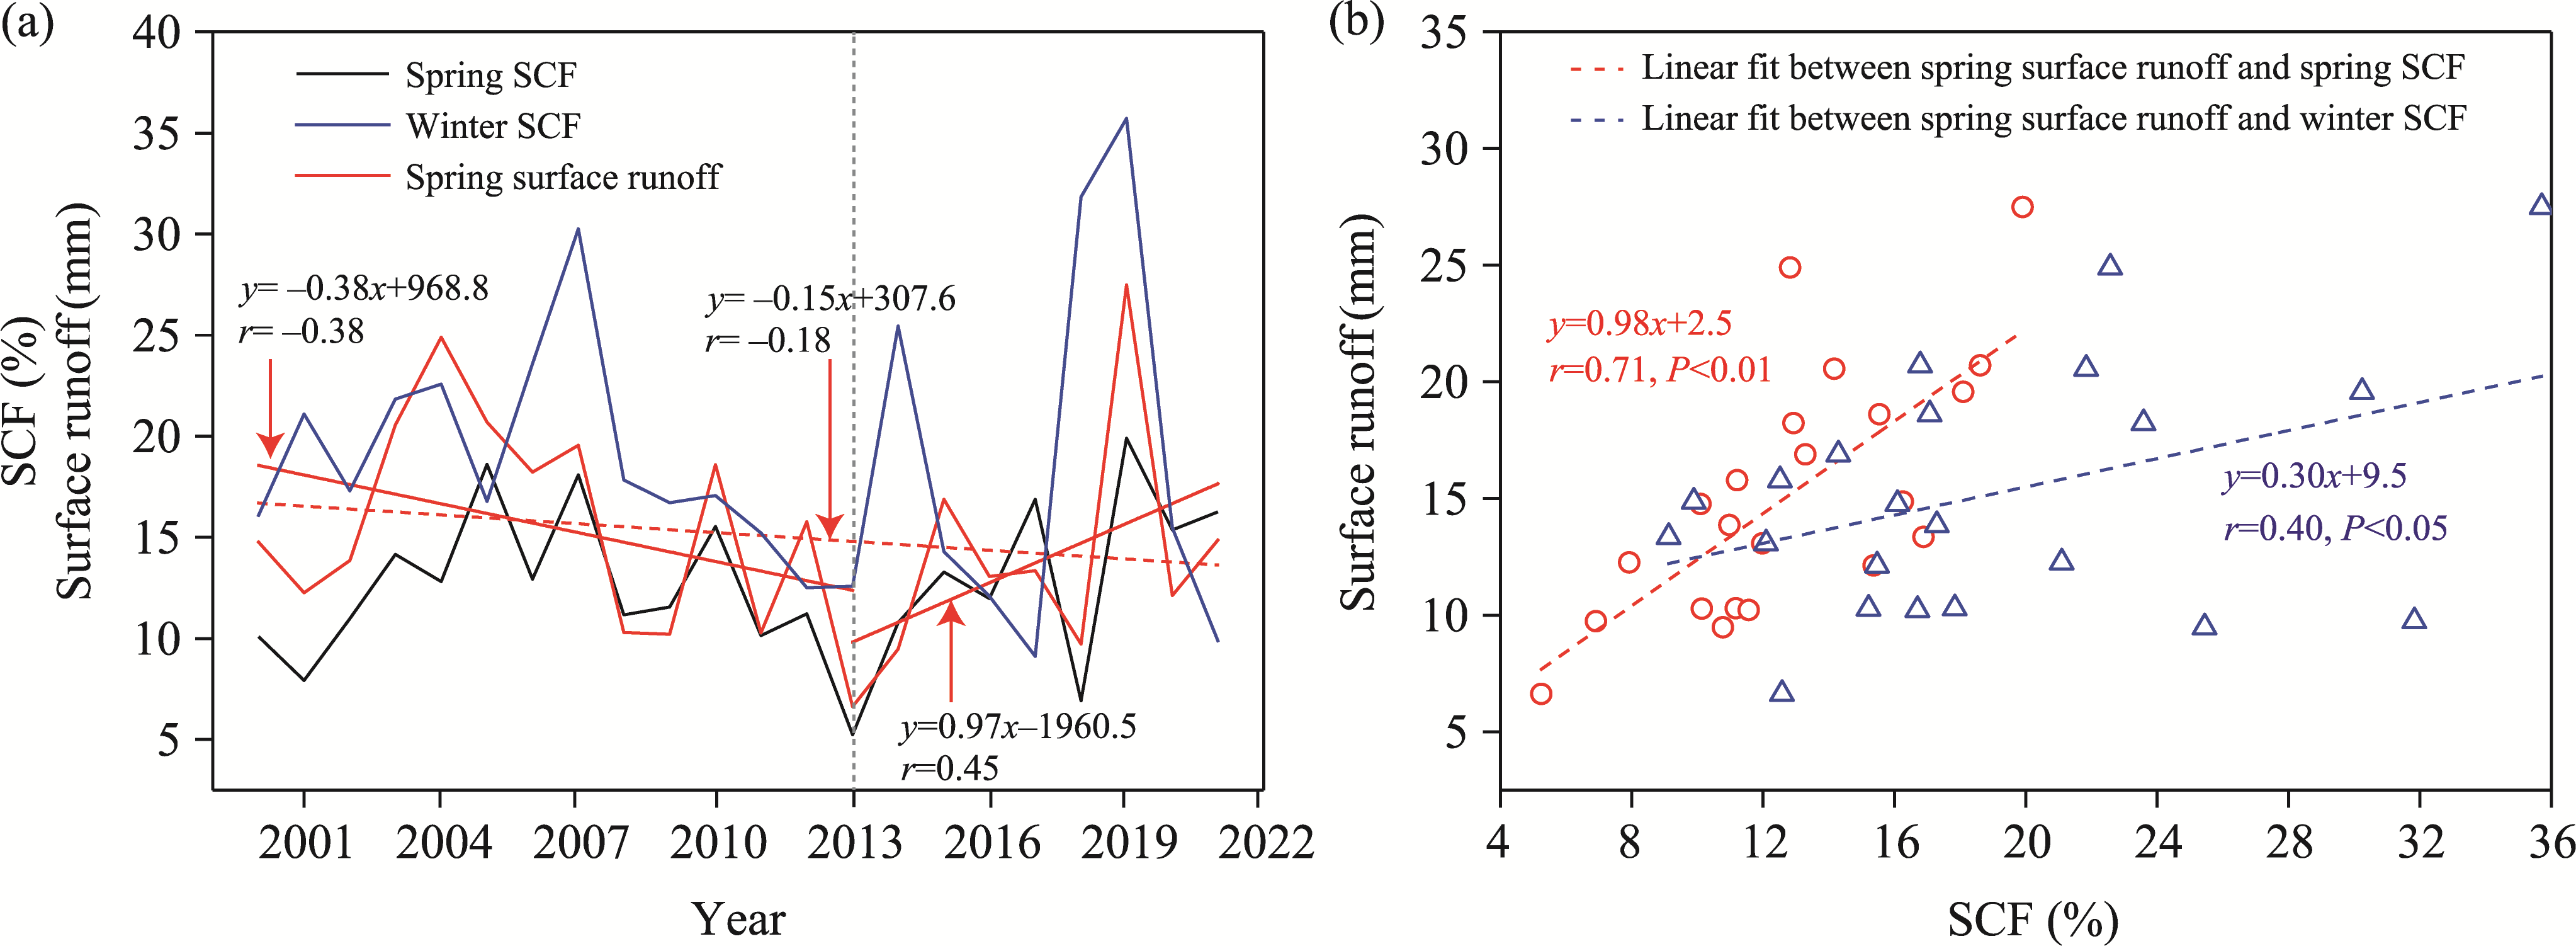
Abstract Understanding the impact of meteorological and topographical factors on snow cover fraction (SCF) is crucial for water resource management in the Qilian Mountains (QLM), China. However, there is still a lack of adequate quantitative analysis of the impact of these factors. This study investigated the spatiotemporal characteristics and trends of SCF in the QLM based on the cloud-removed Moderate Resolution Imaging Spectroradiometer (MODIS) SCF dataset during 2000-2021 and conducted a quantitative analysis of the drivers using a histogram-based gradient boosting regression tree (HGBRT) model. The results indicated that the monthly distribution of SCF exhibited a bimodal pattern. The SCF showed a pattern of higher values in the western regions and lower values in the eastern regions. Overall, the SCF showed a decreasing trend during 2000-2021. The decrease in SCF occurred at higher elevations, while an increase was observed at lower elevations. At the annual scale, the SCF showed a downward trend in the western regions affected by westerly (52.84% of the QLM). However, the opposite trend was observed in the eastern regions affected by monsoon (45.73% of the QLM). The SCF displayed broadly similar spatial patterns in autumn and winter, with a significant decrease in the western regions and a slight increase in the central and eastern regions. The effect of spring SCF on spring surface runoff was more pronounced than that of winter SCF. Furthermore, compared with meteorological factors, a variation of 46.53% in spring surface runoff can be attributed to changes in spring SCF. At the annual scale, temperature and relative humidity were the most important drivers of SCF change. An increase in temperature exceeding 0.04°C/a was observed to result in a decline in SCF, with a maximum decrease of 0.22%/a. An increase in relative humidity of more than 0.02%/a stabilized the rise in SCF (about 0.06%/a). The impacts of slope and aspect were found to be minimal. At the seasonal scale, the primary factors impacting SCF change varied. In spring, precipitation and wind speed emerged as the primary drivers. In autumn, precipitation and temperature were identified as the primary drivers. In winter, relative humidity and precipitation were the most important drivers. In contrast to the other seasons, slope exerted the strongest influence on SCF change in summer. This study facilitates a detailed quantitative description of SCF change in the QLM, enhancing the effectiveness of watershed water resource management and ecological conservation efforts in this region.
|
|
Received: 23 November 2024
Published: 31 July 2025
|
|
Corresponding Authors:
*QIN Xiang (E-mail: qinxiang@lzb.ac.cn)
|
| Cite this article:
JIN Zizhen, QIN Xiang, LI Xiaoying, ZHAO Qiudong, ZHANG Jingtian, MA Xinxin, WANG Chunlin, HE Rui, WANG Renjun. Quantitative analysis of factors driving the variations in snow cover fraction in the Qilian Mountains, China. Journal of Arid Land, 2025, 17(7): 888-911.
URL:
http://jal.xjegi.com/10.1007/s40333-025-0083-x OR http://jal.xjegi.com/Y2025/V17/I7/888
|
|
|
| [1] |
Barnett T P, Adam J C, Lettenmaier D P. 2005. Potential impacts of a warming climate on water availability in snow-dominated regions. Nature, 438(7066): 303-309.
|
|
|
| [2] |
Chen D L, Xu B Q, Yao T D, et al. 2015. Assessment of past, present and future environmental changes on the Tibetan Plateau. Chinese Science Bulletin, 60(32): 3025-3035. (in Chinese)
|
|
|
| [3] |
Chen X N, Liang S L, Cao Y F, et al. 2016. Distribution, attribution, and radiative forcing of snow cover changes over China from 1982 to 2013. Climatic Change, 137(3): 363-377.
|
|
|
| [4] |
de Jong R, de Bruin S, de Wit A, et al. 2011. Analysis of monotonic greening and browning trends from global NDVI time-series. Remote Sensing of Environment, 115(2): 692-702.
|
|
|
| [5] |
Ding Y J, Qin D H. 2009. Cryosphere change and global warming: Impact and challenges in China. China Basic Science, 11(3): 4-10. (in Chinese)
|
|
|
| [6] |
Elith J, Leathwick J R, Hastie T. 2008. A working guide to boosted regression trees. Journal of Animal Ecology, 77(4): 802-813.
doi: 10.1111/j.1365-2656.2008.01390.x
pmid: 18397250
|
|
|
| [7] |
Frei A, Tedesco M, Lee S, et al. 2012. A review of global satellite-derived snow products. Advances in Space Research, 50(8): 1007-1029.
|
|
|
| [8] |
Goodarzi M R, Sabaghzadeh M, Niazkar M. 2023. Evaluation of snowmelt impacts on flood flows based on remote sensing using SRM model. Water, 15(9): 1650, doi: 10.3390/w15091650.
|
|
|
| [9] |
Gray L C, Zhao L, Stillwell A S. 2023. Impacts of climate change on global total and urban runoff. Journal of Hydrology, 620: 129352, doi: 10.1016/j.jhydrol.2023.129352.
|
|
|
| [10] |
Greenacre M, Groenen P J F, Hastie T, et al. 2022. Principal component analysis. Nature Reviews Methods Primers, 3(1): 22, doi: 10.1038/s43586-022-00184-w.
|
|
|
| [11] |
Guo R Y, Ji X, Liu C Y, et al. 2022. Spatiotemporal variation of snow cover and its relationship with temperature and precipitation in the Yarlung Tsangpo-Brahmaputra River Basin. Journal of Mountain Science, 19(7): 1901-1918.
|
|
|
| [12] |
Guo W Q, Liu S Y, Xu J L, et al. 2015. The second Chinese glacier inventory: Data, methods and results. Journal of Glaciology, 61(226): 357-372.
|
|
|
| [13] |
Hewitt K. 2011. Glacier change, concentration, and elevation effects in the Karakoram Himalaya, Upper Indus Basin. Mountain Research and Development, 31(3): 188-200.
|
|
|
| [14] |
Hu G J, Zhao L, Wu X D, et al. 2019. Evaluation of reanalysis air temperature products in permafrost regions on the Qinghai-Tibetan Plateau. Theoretical and Applied Climatology, 138: 1457-1470.
|
|
|
| [15] |
Ji G X, Wu L Y, Wang L D, et al. 2021. Attribution analysis of seasonal runoff in the source region of the yellow river using seasonal Budyko hypothesis. Land, 10(5): 542, doi: 10.3390/land10050542.
|
|
|
| [16] |
Jiang Y Y, Ming J, Ma P L, et al. 2016. Variation in the snow cover on the Qilian Mountains and its causes in the early 21st century. Geomatics, Natural Hazards and Risk, 7(6): 1824-1834.
|
|
|
| [17] |
Jin X, Ke C Q, Xu Y Y, et al. 2015. Spatial and temporal variations of snow cover in the Loess Plateau, China. International Journal of Climatology, 35(8): 1721-1731.
|
|
|
| [18] |
Jolliffe I T, Cadima J.2016. Principal component analysis: a review and recent developments. Philosophical Transactions of the Royal Society A: Mathematical, Physical and Engineering Sciences, 374(2065): 20150202, doi: 10.1098/rsta.2015.0202.
|
|
|
| [19] |
Kohavi R. 1995. A study of cross-validation and bootstrap for accuracy estimation and model selection. IJCAI'95: Proceedings of the 14th international joint conference on Artificial intelligence-Volume 2. Montreal: Canadian Society for Computational Studies of Intelligence, 1137-1145.
|
|
|
| [20] |
Li C H, Su F G, Yang D Q, et al. 2018. Spatiotemporal variation of snow cover over the Tibetan Plateau based on MODIS snow product, 2001-2014. International Journal of Climatology, 38(2): 708-728.
|
|
|
| [21] |
Li Y, Zhang J F, Zhang J Y, et al. 2015. Research on driving force variation and future trend analysis of ecological evolution of Hexi Corridor. Yellow River, 37(5): 70-73. (in Chinese)
|
|
|
| [22] |
Li Y Z, Qin X, Liu Y S, et al. 2022. Evaluation of long-term and high-resolution gridded precipitation and temperature products in the Qilian Mountains, Qinghai-Tibet Plateau. Frontiers in Environmental Science, 10: 906821, doi: 10.3389/fenvs.2022.906821.
|
|
|
| [23] |
Li Z G, Lyu S H, Chen H, et al. 2021. Changes in climate and snow cover and their synergistic influence on spring runoff in the source region of the Yellow River. Science of the Total Environment, 799: 149503, doi: 10.1016/j.scitotenv.2021.149503.
|
|
|
| [24] |
Li Z X, Yuan R F, Feng Q, et al. 2019. Climate background, relative rate, and runoff effect of multiphase water transformation in Qilian Mountains, the third pole region. Science of the Total Environment, 663: 315-328.
|
|
|
| [25] |
Liang P B, Li Z Q, Zhang H. 2019. Temporal-spatial variation characteristics of snow cover in Qilian Mountains from 2001 to 2017. Arid Land Geography, 42(1): 56-66. (in Chinese)
|
|
|
| [26] |
Lundberg S M, Erion G, Chen H, et al. 2020. From local explanations to global understanding with explainable AI for trees. Nature Machine Intelligence, 2(1): 56-67.
doi: 10.1038/s42256-019-0138-9
pmid: 32607472
|
|
|
| [27] |
Muñoz-Sabater J, Dutra E, Agustí-Panareda A, et al. 2021. ERA5-Land: A state-of-the-art global reanalysis dataset for land applications. Earth System Science Data, 13(9): 4349-4383.
|
|
|
| [28] |
Notarnicola C. 2020. Hotspots of snow cover changes in global mountain regions over 2000-2018. Remote Sensing of Environment, 243: 111781, doi: 10.1016/j.rse.2020.111781.
|
|
|
| [29] |
Pan F B, Jiang L M, Wang G X, et al. 2024. MODIS daily cloud-gap-filled fractional snow cover dataset of the Asian Water Tower region (2000-2022). Earth System Science Data, 16(5): 2501-2523.
|
|
|
| [30] |
Pedregosa F, Varoquaux G, Gramfort A, et al. 2011. Scikit-learn: Machine learning in Python. The Journal of Machine Learning Research, 12: 2825-2830.
|
|
|
| [31] |
Peng C Y, Sheng Y, Wu J C, et al. 2021. Simulation of the permafrost distribution in the Qilian Mountains. Journal of Glaciology and Geocryology, 43(1): 158-169. (in Chinese)
doi: 10.7522/j.issn.1000-0240.2020.0091
|
|
|
| [32] |
Pomeroy J W, Stewart R E, Whitfield P H. 2016. The 2013 flood event in the South Saskatchewan and Elk River basins: Causes, assessment and damages. Canadian Water Resources Journal, 41(1-2): 105-117.
|
|
|
| [33] |
Pulliainen J, Luojus K, Derksen C, et al. 2020. Patterns and trends of Northern Hemisphere snow mass from 1980 to 2018. Nature, 581(7808): 294-298.
|
|
|
| [34] |
Qin D H, Liu S Y, Li P J. 2006. Snow cover distribution, variability, and response to climate change in western China. Journal of Climate, 19(9): 1820-1833.
|
|
|
| [35] |
Qin S, Xiao P F, Zhang X L. 2022. How do snow cover fraction change and respond to climate in Altai Mountains of China? International Journal of Climatology, 42(14): 7213-7227.
|
|
|
| [36] |
Ren Z J, Wang J L, Xu H N, et al. 2024. Evolution and driving factors of megadrought and pluvial events in the Qilian Mountains during the past 500 years . Arid Land Geography, 47(2): 214-227. (in Chinese)
doi: 10.12118/j.issn.1000-6060.2023.070
|
|
|
| [37] |
Smith T, Bookhagen B. 2018. Changes in seasonal snow water equivalent distribution in High Mountain Asia (1987 to 2009). Science Advances, 4(1): e1701550, doi: 10.1126/sciadv.1701550.
|
|
|
| [38] |
Su F, Zhang L, Ou T, et al. 2016. Hydrological response to future climate changes for the major upstream river basins in the Tibetan Plateau. Global and Planetary Change, 136: 82-95.
|
|
|
| [39] |
Tahir A A, Chevallier P, Arnaud Y, et al. 2015. Snow cover trend and hydrological characteristics of the Astore River basin (Western Himalayas) and its comparison to the Hunza basin (Karakoram region). Science of the Total Environment, 505: 748-761.
|
|
|
| [40] |
Tang Z G, Wang X R, Wang J, et al. 2017. Spatiotemporal variation of snow cover in Tianshan Mountains, Central Asia, based on cloud-free MODIS fractional snow cover product, 2001-2015. Remote Sensing, 9(10): 1045, doi: 10.3390/rs9101045.
|
|
|
| [41] |
Tuttle S E, Cho E, Restrepo P J, et al. 2017. Remote sensing of drivers of spring snowmelt flooding in the north central US. In: LakshmiV.Remote Sensing of Hydrological Extremes. Springer Remote Sensing/Photogrammetry. Cham: Springer, 21-45.
|
|
|
| [42] |
Wang C L, Si J H, Zhao C Y, et al. 2022. Adequacy of satellite derived data for streamflow simulation in three Hexi inland river basins, Northwest China. Atmospheric Research, 274: 106203, doi: 10.1016/j.atmosres.2022.106203.
|
|
|
| [43] |
Wang J X, Petersen W A, Wolff D B. 2021. Validation of satellite-based precipitation products from TRMM to GPM. Remote Sensing, 13(9): 1745, doi: 10.3390/rs13091745.
|
|
|
| [44] |
Wang Y F, Ye A Z, Zhang Y H, et al. 2023. The quantitative attribution of climate change to runoff increase over the Qinghai-Tibetan Plateau. Science of the Total Environment, 897: 165326, doi: 10.5194/egusphere-egu24-3551.
|
|
|
| [45] |
Wang Y T, He Y, Hou S G. 2007. Analysis of the temporal and spatial variations of snow cover over the Tibetan plateau based on MODIS. Journal of Glaciology and Geocryology, 29(6): 855-861. (in Chinese)
|
|
|
| [46] |
Winiger M, Gumpert M, Yamout H. 2005. Karakorum-Hindukush-western Himalaya: Assessing high-altitude water resources. Hydrological Processes, 19(12): 2329-2338.
|
|
|
| [47] |
Xu J Y, Tang Y, Xu J H, et al. 2022. Impact of snow cover phenology on the vegetation green-up date on the Tibetan Plateau. Remote Sensing, 14(16): 3909, doi: 10.3390/rs14163909.
|
|
|
| [48] |
Xue J, Li Z X, Feng Q, et al. 2023. Ecological conservation pattern based on ecosystem services in the Qilian Mountains, northwest China. Environmental Development, 46: 100834, doi: 10.1016/j.envdev.2023.100834.
|
|
|
| [49] |
Yan W, Wang Y F, Ma X F, et al. 2023. Snow cover and climate change and their coupling effects on runoff in the Keriya River Basin during 2001-2020. Remote Sensing, 15(13): 3435, doi: 10.3390/rs15133435.
|
|
|
| [50] |
Zhang L, Zhang Q, Feng J Y, et al. 2014. A study of atmospheric water cycle over the Qilian Mountains (I): Variation of annual water vapor transport. Journal of Glaciology and Geocryology, 36(5): 1079-1091. (in Chinese)
|
|
|
| [51] |
Zhang L L, Su F G, Yang D Q, et al. 2013. Discharge regime and simulation for the upstream of major rivers over Tibetan Plateau. Journal of Geophysical Research: Atmospheres, 118(15): 8500-8518.
|
|
|
| [52] |
Zhang X Z, Xiong Z, Yan X D. 2019a. Modeling precipitation changes in the Heihe River Basin, Northwest China, from 1980 to 2014 with the Regional Integrated Environment Modeling System (RIEMS) nested with ERA-Interim reanalysis data. Theoretical and Applied Climatology, 137: 493-503.
|
|
|
| [53] |
Zhang Y L, Kang S C, Gao T G, et al. 2019b. Dissolved organic carbon in snow cover of the Chinese Altai Mountains, Central Asia: Concentrations, sources and light-absorption properties. Science of the Total Environment, 647: 1385-1397.
|
|
|
| [54] |
Zhao P, He Z B. 2022. A first evaluation of ERA5-Land reanalysis temperature product over the Chinese Qilian Mountains. Frontiers in Earth Science, 10: 907730, doi: 10.3389/feart.2022.907730.
|
|
|
|
Viewed |
|
|
|
Full text
|
|
|
|
|
Abstract
|
|
|
|
|
Cited |
|
|
|
|
| |
Shared |
|
|
|
|
| |
Discussed |
|
|
|
|