| Research article |
|

|
|
|
| Forecasting land use changes in crop classification and drought using remote sensing |
Mashael MAASHI1, Nada ALZABEN2, Noha NEGM3,*( ), Venkatesan VEERAMANI4, Sabarunisha Sheik BEGUM5, Geetha PALANIAPPAN6 ), Venkatesan VEERAMANI4, Sabarunisha Sheik BEGUM5, Geetha PALANIAPPAN6 |
1Department of Software Engineering, College of Computer and Information Sciences, King Saud University, Riyadh 11451, Saudi Arabia
2Department of Computer Sciences, College of Computer and Information Sciences, Princess Nourah bint Abdulrahman University, Riyadh 11671, Saudi Arabia
3Department of Computer Science, Applied College at Mahayil, King Khalid University, Abha 61421, Saudi Arabia
4Department of Civil Engineering, University College of Engineering, Anna University, Ariyalur 621731, India
5Department of Biotechnology, P.S.R. Engineering College, Sivakasi 626140, India
6Department of Electronics and Communication Engineering, School of Engineering and Technology, Dhanalakshmi Srinivasan University, Samayapuram 621112, India |
|
|
|
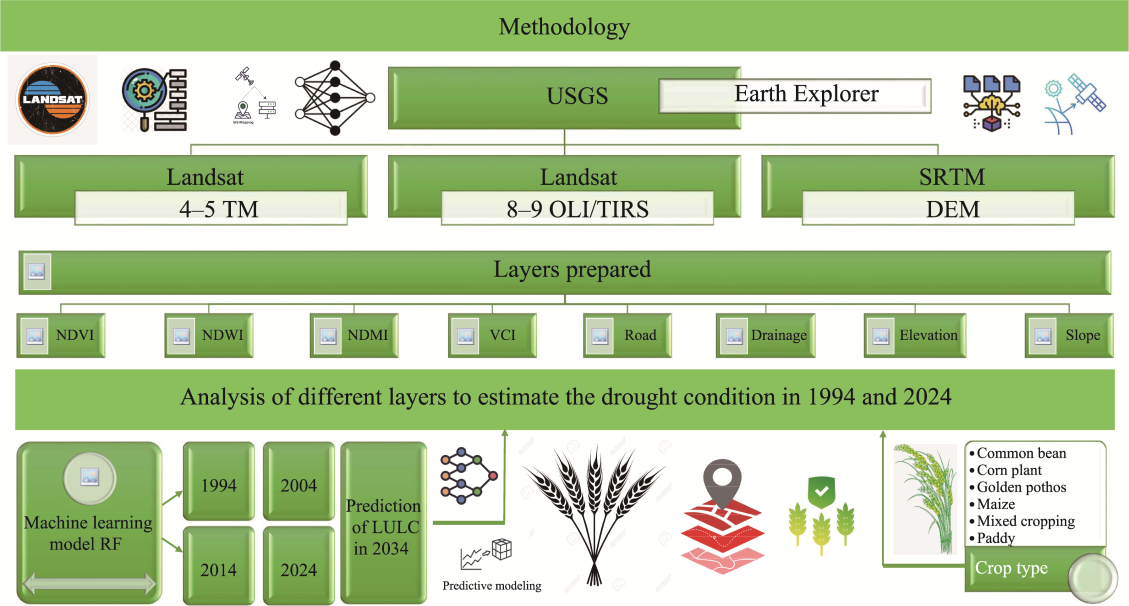
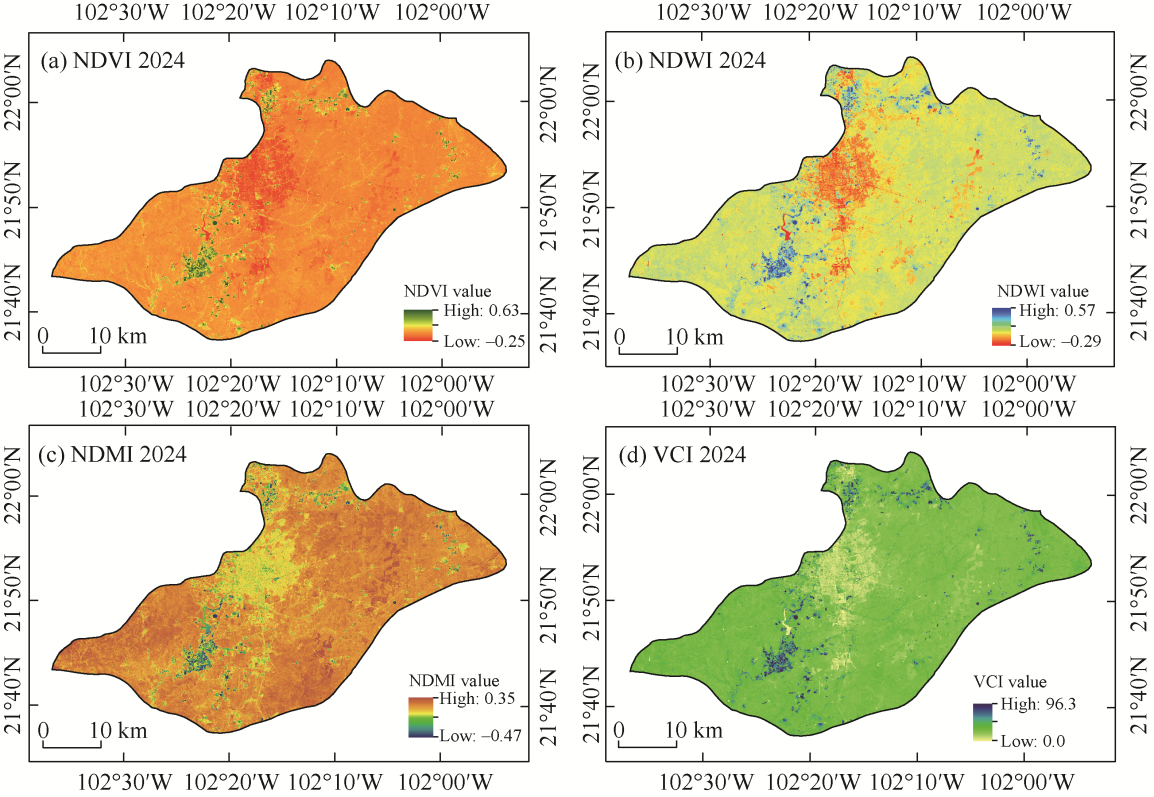
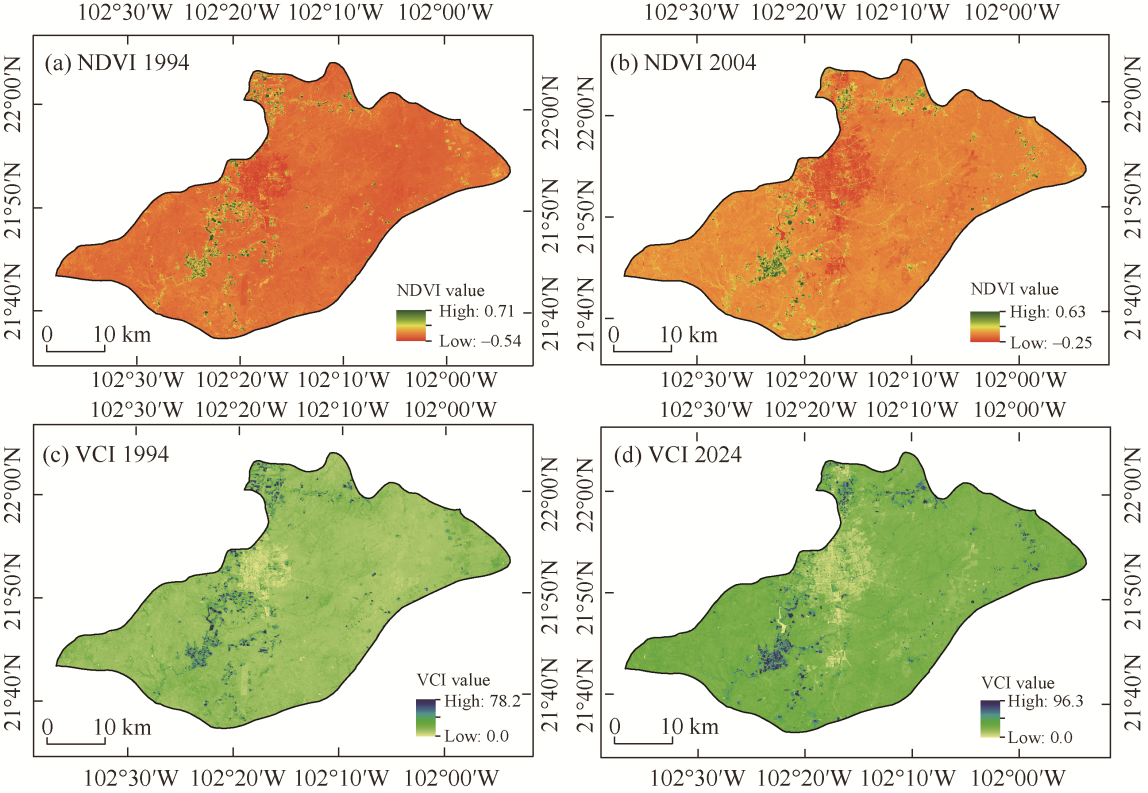
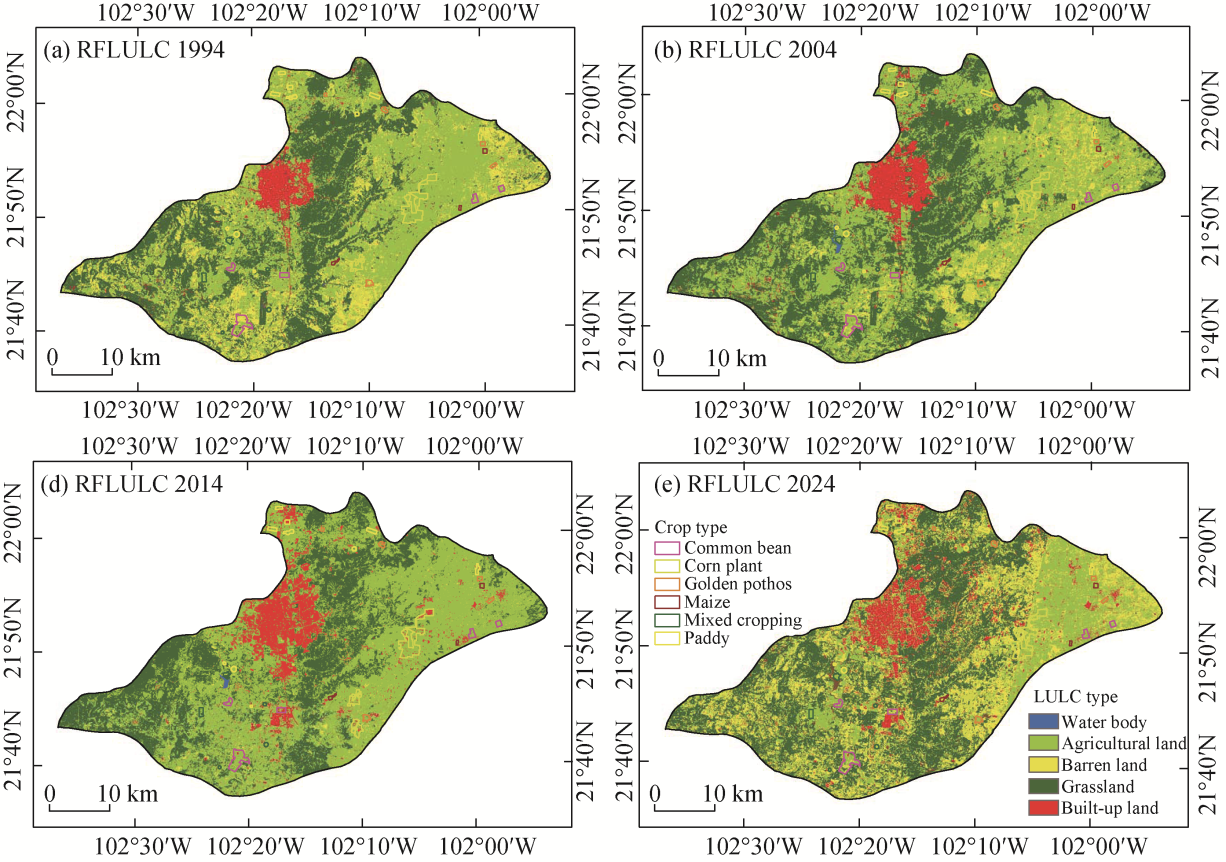
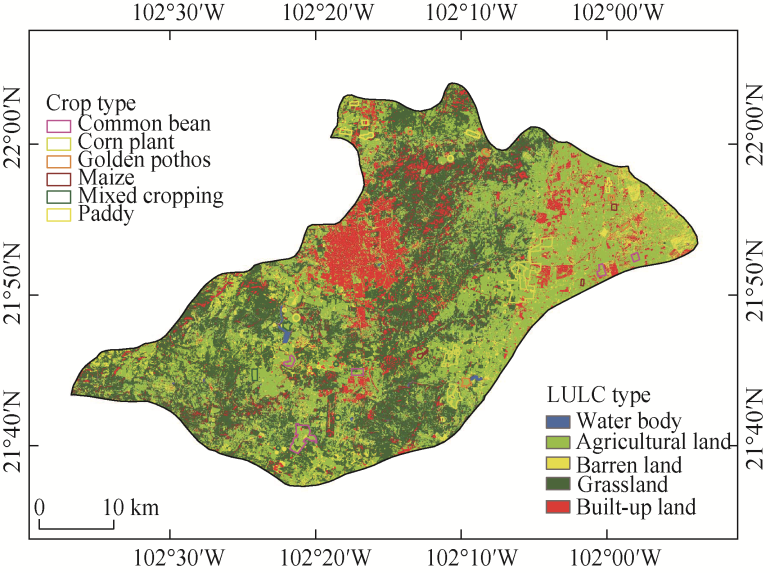
Abstract Challenges in land use and land cover (LULC) include rapid urbanization encroaching on agricultural land, leading to fragmentation and loss of natural habitats. However, the effects of urbanization on LULC of different crop types are less concerned. The study assessed the impacts of LULC changes on agriculture and drought vulnerability in the Aguascalientes region, Mexico, from 1994 to 2024, and predicted the LULC in 2034 using remote sensing data, with the goals of sustainable land management and climate resilience strategies. Despite increasing urbanization and drought, the integration of satellite imagery and machine learning models in LULC analysis has been underutilized in this region. Using Landsat imagery, we assessed crop attributes through indices such as normalized difference vegetation index (NDVI), normalized difference water index (NDWI), normalized difference moisture index (NDMI), and vegetation condition index (VCI), alongside watershed delineation and spectral features. The random forest model was applied to classify LULC, providing insights into both historical and future trends. Results indicated a significant decline in vegetation cover (109.13 km2) from 1994 to 2024, accompanied by an increase in built-up land (75.11 km2) and bare land (67.13 km2). Projections suggested a further decline in vegetation cover (41.51 km2) and continued urban land expansion by 2034. The study found that paddy crops exhibited the highest values, while common bean and maize performed poorly. Drought analysis revealed that mildly dry areas in 2004 became severely dry in 2024, highlighting the increasing vulnerability of agriculture to climate change. The study concludes that sustainable land management, improved water resource practices, and advanced monitoring techniques are essential to mitigate the adverse effects of LULC changes on agricultural productivity and drought resilience in the area. These findings contribute to the understanding of how remote sensing can be effectively used for long-term agricultural planning and environmental sustainability.
|
|
Received: 04 September 2024
Published: 31 May 2025
|
|
Corresponding Authors:
*Noha NEGM (E-mail: negmnoha9@gmail.com)
|
|
|
| [1] |
AlDousari A E, Kafy A A, Saha M, et al. 2022. Modelling the impacts of land use/land cover changing pattern on urban thermal characteristics in Kuwait. Sustainable Cities and Society, 86: 104107, doi: 10.1016/j.scs.2022.104107.
|
|
|
| [2] |
Altaf F, Meraj G, Romshoo S A. 2013. Morphometric analysis to infer hydrological behaviour of Lidder Watershed, Western Himalaya, India. Geography Journal, 2013: 178021, doi: /10.1155/2013/178021.
|
|
|
| [3] |
Anderson J R. 1976. A Land Use and Land Cover Classification System for Use with Remote Sensor Data. Washington: US Government Printing Office.
|
|
|
| [4] |
Bonilla-Moheno M, Aide T M. 2020. Beyond deforestation: Land cover transitions in Mexico. Agricultural Systems, 178: 102734, doi: 10.1016/j.agsy.2019.102734.
|
|
|
| [5] |
Dwivedi R S, Sreenivas K, Ramana K V. 2005. Land-use/land-cover change analysis in part of Ethiopia using Landsat Thematic Mapper data. International Journal of Remote Sensing, 26(7): 1285-1287.
|
|
|
| [6] |
Egger G, Politti E, Lautsch E, et al. 2015. Floodplain forest succession reveals fluvial processes: A hydrogeomorphic model for temperate riparian woodlands. Journal of Environmental Management, 161: 72-82.
doi: S0301-4797(15)30109-2
pmid: 26160662
|
|
|
| [7] |
Foody G M. 2002. Status of land cover classification accuracy assessment. Remote Sensing of Environment, 80(1): 185-201.
|
|
|
| [8] |
Ghanbari R, Heidarimozaffar M, Soltani A, et al. 2023. Land surface temperature analysis in densely populated zones from the perspective of spectral indices and urban morphology. International Journal of Environmental Science and Technology, 20(3): 2883-2902.
|
|
|
| [9] |
Guha S, Govil H, Diwan P. 2020. Monitoring LST-NDVI relationship using premonsoon Landsat datasets. Advances in Meteorology, 2020: 4539684, doi: 10.1155/2020/4539684.
|
|
|
| [10] |
Guha S, Govil H. 2021. A long-term monthly analytical study on the relationship of LST with normalized difference spectral indices. European Journal of Remote Sensing, 54(1): 487-512.
|
|
|
| [11] |
Guha S, Govil H. 2023. Evaluating the stability of the relationship between land surface temperature and land use/land cover indices: A case study in Hyderabad City, India. Geology, Ecology, and Landscapes, 9(1): 2182083, doi: 10.1080/24749508.2023.2182083.
|
|
|
| [12] |
Guha S, Govil H, Mukherjee S. 2023. Long-term evaluation of land surface temperature with bare surface index and surface vegetation index: A case study of a central Indian city. Papers in Applied Geography, 9(4): 425-441.
|
|
|
| [13] |
Hanadé Houmma I, El Mansouri L, Gadal S, et al. 2022. Modelling agricultural drought: A review of latest advances in big data technologies. Geomatics, Natural Hazards and Risk, 13(1): 2737-2776.
|
|
|
| [14] |
Hossain M S, Arshad M, Qian L, et al. 2019. Economic impact of climate change on crop farming in Bangladesh: An application of Ricardian method. Ecological Economics, 164: 106354, doi: 10.1016/j.ecolecon.2019.106354.
|
|
|
| [15] |
Hussain S, Qin S J, Nasim W, et al. 2022a. Monitoring the dynamic changes in vegetation cover using spatio-temporal remote sensing data from 1984 to 2020. Atmosphere, 13(10): 1609, doi: 10.3390/atmos13101609.
|
|
|
| [16] |
Hussain S, Lu L L, Mubeen M, et al. 2022b. Spatiotemporal variation in land use land cover in the response to local climate change using multispectral remote sensing data. Land, 11(5): 595, doi: 10.3390/land11050595.
|
|
|
| [17] |
Johnson W C, Millett B V, Gilmanov T, et al. 2005. Vulnerability of northern prairie wetlands to climate change. BioScience, 55(10): 863-872.
|
|
|
| [18] |
Juez C, Schärer C, Jenny H, et al. 2019. Floodplain land cover and flow hydrodynamic control of overbank sedimentation in compound channel flows. Water Resources Research, 55(11): 9072-9091.
|
|
|
| [19] |
Kafy A A, Raikwar V, Al Rakib A, et al. 2021. Geospatial approach for developing an integrated water resource management plan in Rajshahi, Bangladesh. Environmental Challenges, 4: 100139, doi: 10.1016/j.envc.2021.100139.
|
|
|
| [20] |
Kanga S, Singh S K, Meraj G, et al. 2022. Assessment of the impact of urbanization on geoenvironmental settings using geospatial techniques: A study of Panchkula District, Haryana. Geographies, 2(1): 1-10.
|
|
|
| [21] |
Kumar S, Radhakrishnan N, Mathew S. 2014. Land use change modelling using a Markov model and remote sensing. Geomatics, Natural Hazards and Risk, 5(2): 145-156.
|
|
|
| [22] |
Manjarrez-Domínguez C, Uc-Campos M I, Esparza-Vela M E, et al. 2023. Geospatial-temporal dynamics of land use in the Juárez Valley: Urbanization and displacement of agriculture. Sustainability, 15(11): 8499, doi: 0.3390/su15118499.
|
|
|
| [23] |
Mather P M, Tso B. 2022. A review of remote sensing applications in land use and land cover change studies. The Egyptian Journal of Remote Sensing and Space Science, 25(1): 1178604, doi: 10.1177/1178604.
|
|
|
| [24] |
McNeill J, Alves D, Arizpe L, et al. 1994. Toward a typology and regionalization of land-cover and land-use change:Report of working group B. In: Meyer W B, Turner B L. Changes in Land Use and Land Cover: AGlobal Perspective. Cambridge: Cambridge University Press, 55-71.
|
|
|
| [25] |
Merlín-Uribe Y, Contreras-Hernández A, Astier-Calderón M, et al. 2013. Urban expansion into a protected natural area in Mexico City: Alternative management scenarios. Journal of Environmental Planning and Management, 56(3): 398-411.
|
|
|
| [26] |
Meyer W B, Turner B L. 1994. Changes in Land Use and Land Cover: A Global Perspective (Vol. 4). Cambridge: Cambridge University Press.
|
|
|
| [27] |
Middleton B A. 2002. The flood pulse concept in wetland restoration. In: Middleton B A. Flood Pulsing in Wetlands: Restoring the Natural Hydrological Balance. New York: John Wiley & Sons, 1-10.
|
|
|
| [28] |
Mishra V N, Rai P K. 2016. A remote sensing aided multi-layer perceptron-Markov chain analysis for land use and land cover change prediction in Patna district (Bihar), India. Arabian Journal of Geosciences, 9: 249, doi: 10.1007/s12517-015-2138-3.
|
|
|
| [29] |
Mitchell M G, Bennett E M, Gonzalez A. 2015. Strong and nonlinear effects of fragmentation on ecosystem service provision at multiple scales. Environmental Research Letters, 10(9): 094014, doi: 10.1088/1748-9326/10/9/094014.
|
|
|
| [30] |
Mohammadpouri S, Sadeghnejad M, Rezaei H, et al. 2023. A generalized regression neural network model for accuracy improvement of global precipitation products: A climate zone-based local optimization. Sustainability, 15(11): 8740, doi: 10.3390/su15118740.
|
|
|
| [31] |
Nath B, Wang Z H, Ge Y, et al. 2020. Land use and land cover change modelling and future potential landscape risk assessment using Markov-CA model and analytical hierarchy process. ISPRS International Journal of Geo-Information, 9(2): 134, doi: 10.3390/ijgi9020134.
|
|
|
| [32] |
Omar N Q, Ahamad M S S, Wan Hussin W M A, et al. 2014. Markov CA, multi regression, and multiple decision making for modeling historical changes in Kirkuk City, Iraq. Journal of the Indian Society of Remote Sensing, 42(1): 165-178.
|
|
|
| [33] |
Palaniappan A B. 2004. Channel Processes. In: Singh V P, Sharma N, Ojha C S P. Brahmaputra Basin Water Resources. Dordrecht: Springer Netherlands, 196-213.
|
|
|
| [34] |
Ruben G B, Zhang K, Dong Z C, et al. 2020. Analysis and projection of land-use/land-cover dynamics through scenario-based simulations using the CA-Markov model: A case study in Guanting Reservoir Basin, China. Sustainability, 12(9): 3747, doi: 10.3390/su12093747.
|
|
|
| [35] |
Stenfors E, Blicharska M, Grabs T, et al. 2024. Droughts in forested ecoregions in cold and continental climates: A review of vulnerability concepts and factors in socio-hydrological systems. WIREs Water, 11(2): e1692, doi: 10.1002/wat2.1692.
|
|
|
| [36] |
Taiwo B E, Kafy A A, Samuel A A, et al. 2023. Monitoring and predicting the influences of land use/land cover change on cropland characteristics and drought severity using remote sensing techniques. Environmental and Sustainability Indicators, 18: 100248, doi: 10.1016/j.indic.2023.100248.
|
|
|
| [37] |
Tarek M O R, Amit S, Kafy A A. 2022. Sharing economy:Conceptualization, motivators, and barriers, and avenues for research in Bangladesh. In: Rahman M M, Goel R, Gome A P, et al. Redefining Global Economic Thinking for the Welfare of Society. New York: IGI Global, 57-74.
|
|
|
| [38] |
Thanh Noi P, Kappas M. 2017. Comparison of random forest, k-nearest neighbor, and support vector machine classifiers for land cover classification using Sentinel-2 imagery. Sensors, 18(1): 18, doi: 10.3390/s18010018.
|
|
|
| [39] |
van Vliet J. 2019. Direct and indirect loss of natural area from urban expansion. Nature Sustainability, 2(8): 755-763.
doi: 10.1038/s41893-019-0340-0
|
|
|
| [40] |
Wubie M A, Assen M, Nicolau M D. 2016. Patterns, causes, and consequences of land use/cover dynamics in the Gumara watershed of Lake Tana Basin, northwestern Ethiopia. Environmental Systems Research, 5(1): 8, doi: 10.1186/s40068-016-0058-1.
|
|
|
| [41] |
Yang X, Zheng X Q, Chen R. 2014. A land use change model: Integrating landscape pattern indexes and Markov-CA. Ecological Modelling, 283: 1-7.
|
|
|
| [42] |
Zambrano L, Aronson M F, Fernandez T. 2019. The consequences of landscape fragmentation on socio-ecological patterns in a rapidly developing urban area: A case study of the National Autonomous University of Mexico. Frontiers in Environmental Science, 7: 152, doi: 10.3389/fenvs.2019.00152.
|
|
|
|
Viewed |
|
|
|
Full text
|
|
|
|
|
Abstract
|
|
|
|
|
Cited |
|
|
|
|
| |
Shared |
|
|
|
|
| |
Discussed |
|
|
|
|