| Research article |
|

|
|
|
| Numerical simulation and spatiotemporal tracking of sand and dust storm events in East Asia |
HUANG Shaopu1,2, WANG Juanle2,3,*( ), WANG Lixin1, GUO Yanhong1 ), WANG Lixin1, GUO Yanhong1 |
1School of Ecology and Environment, Inner Mongolia University, Hohhot 010021, China
2State Key Laboratory of Resources and Environmental Information System, Institute of Geographic Sciences and Natural Resources Research, Chinese Academy of Sciences, Beijing 100101, China
3College of Resources and Environment, University of Chinese Academy of Sciences, Beijing 100049, China |
|
|
|
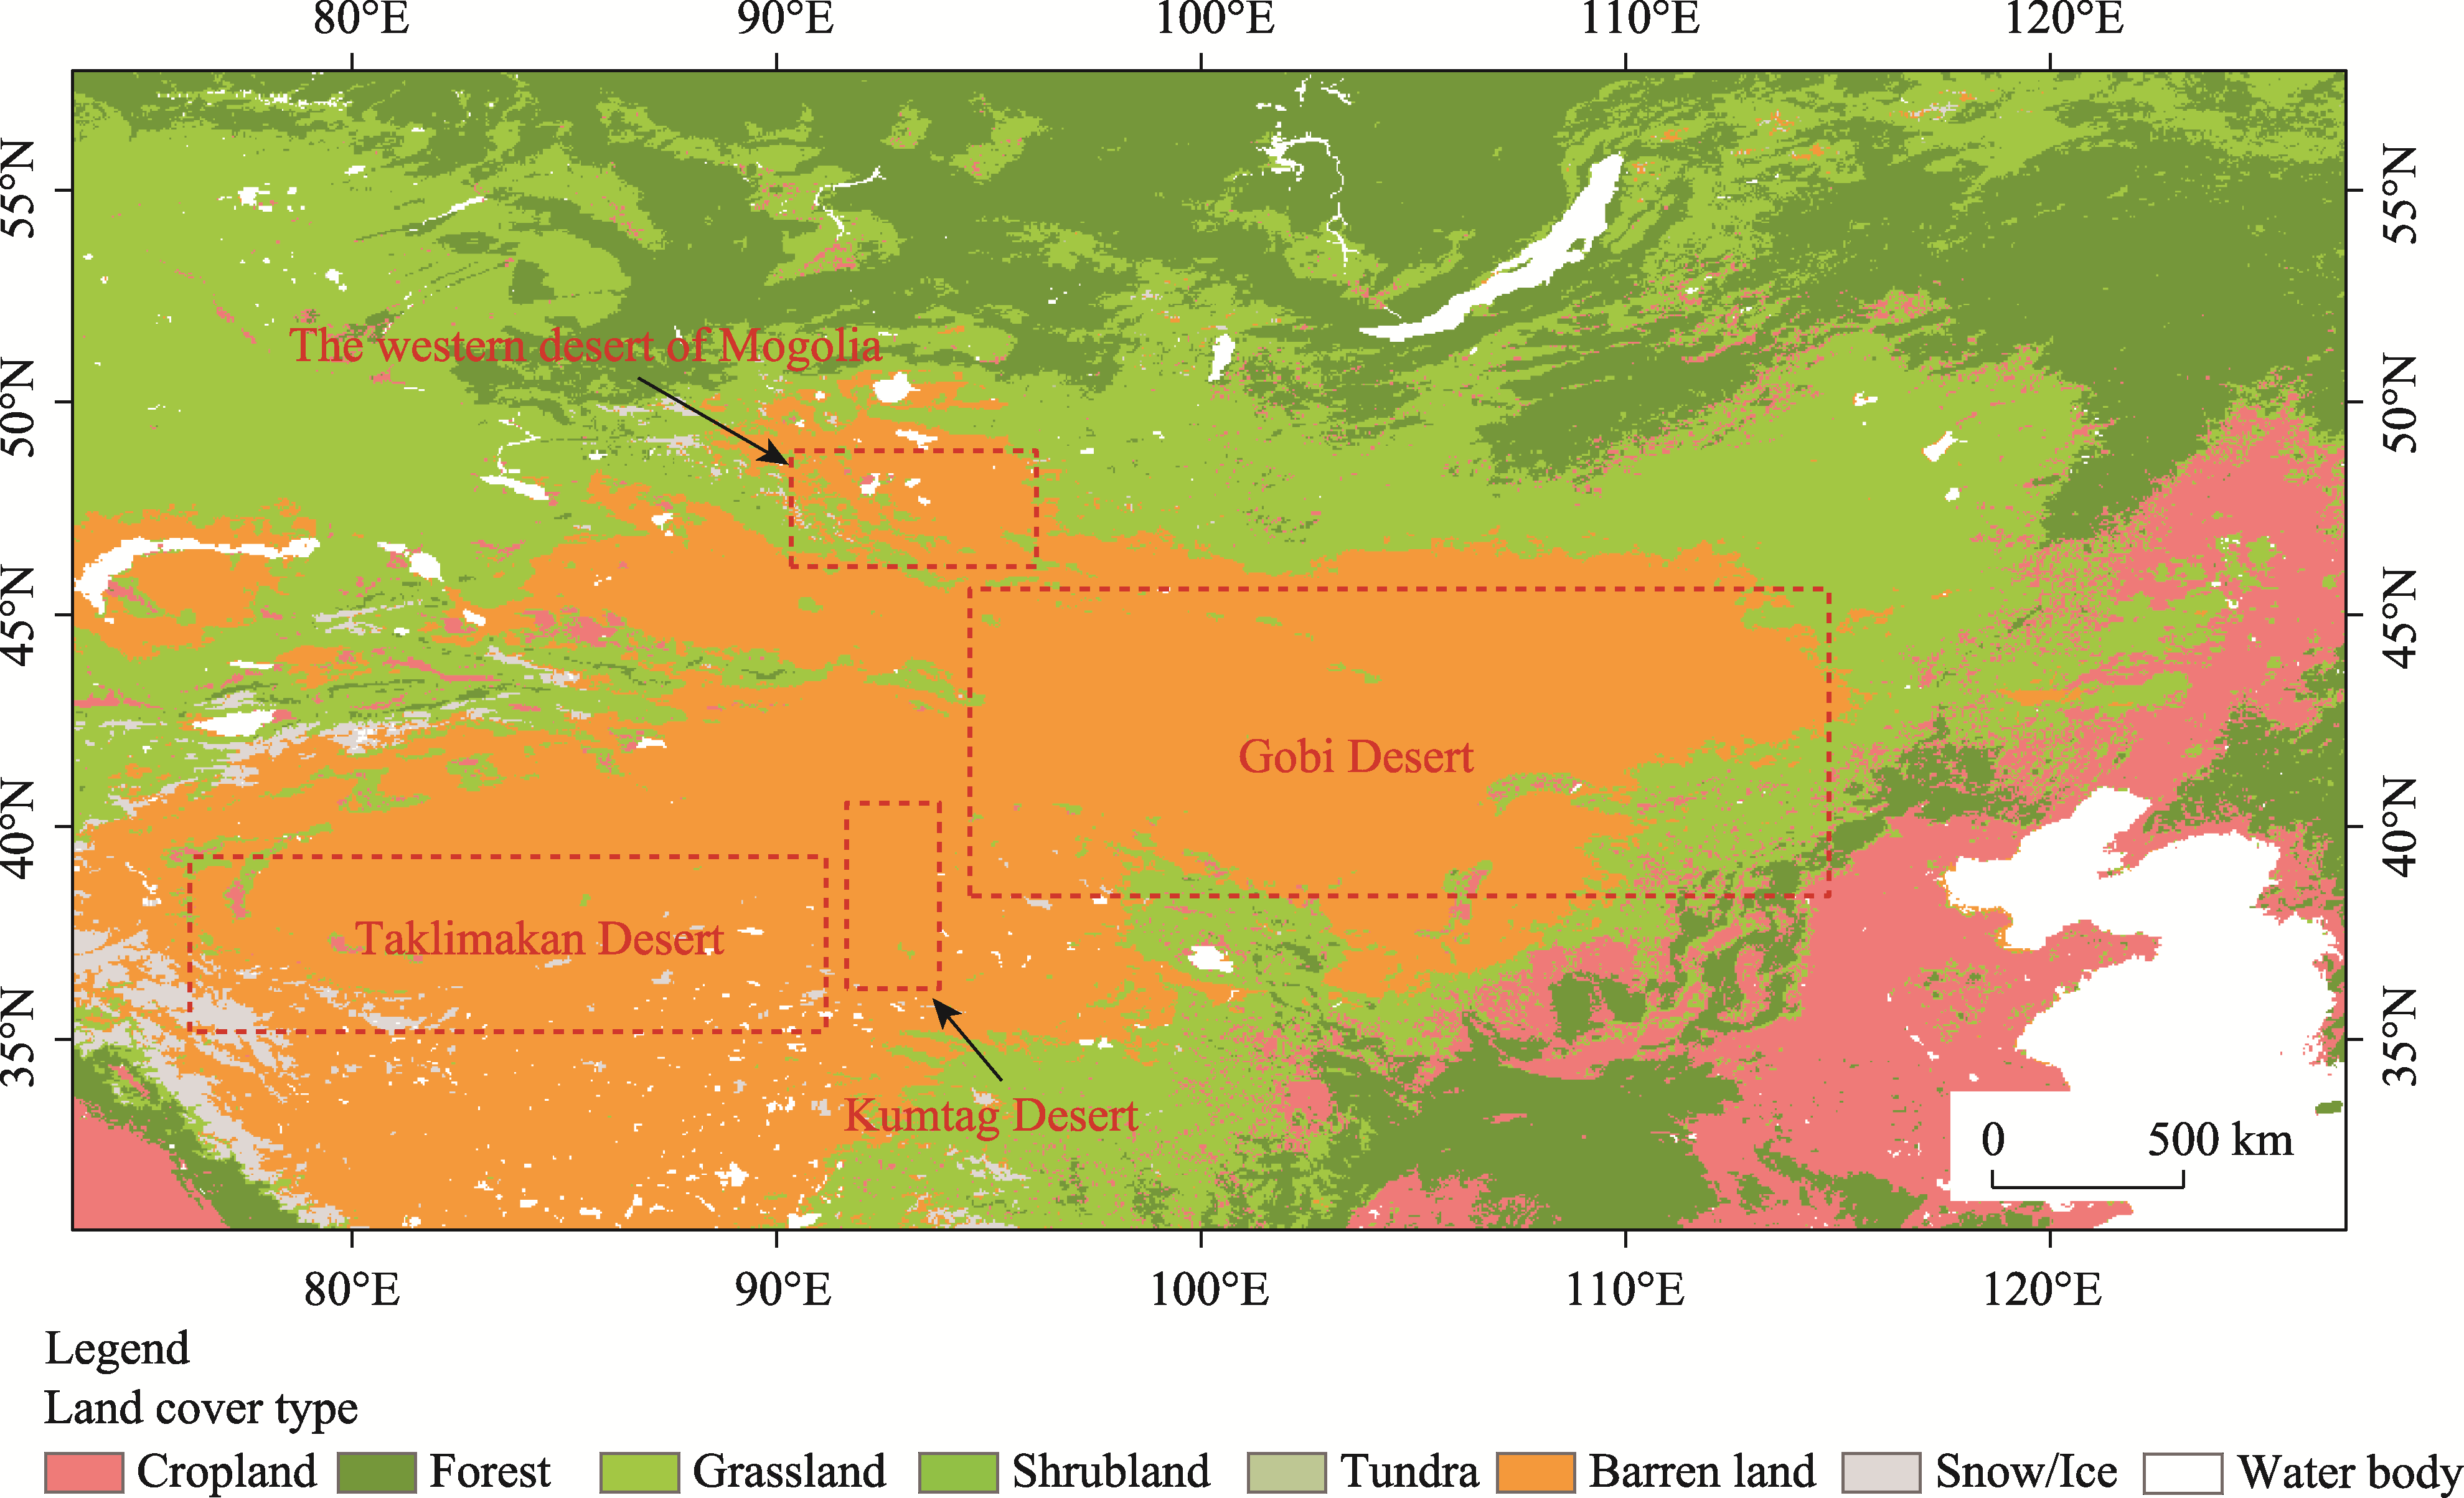
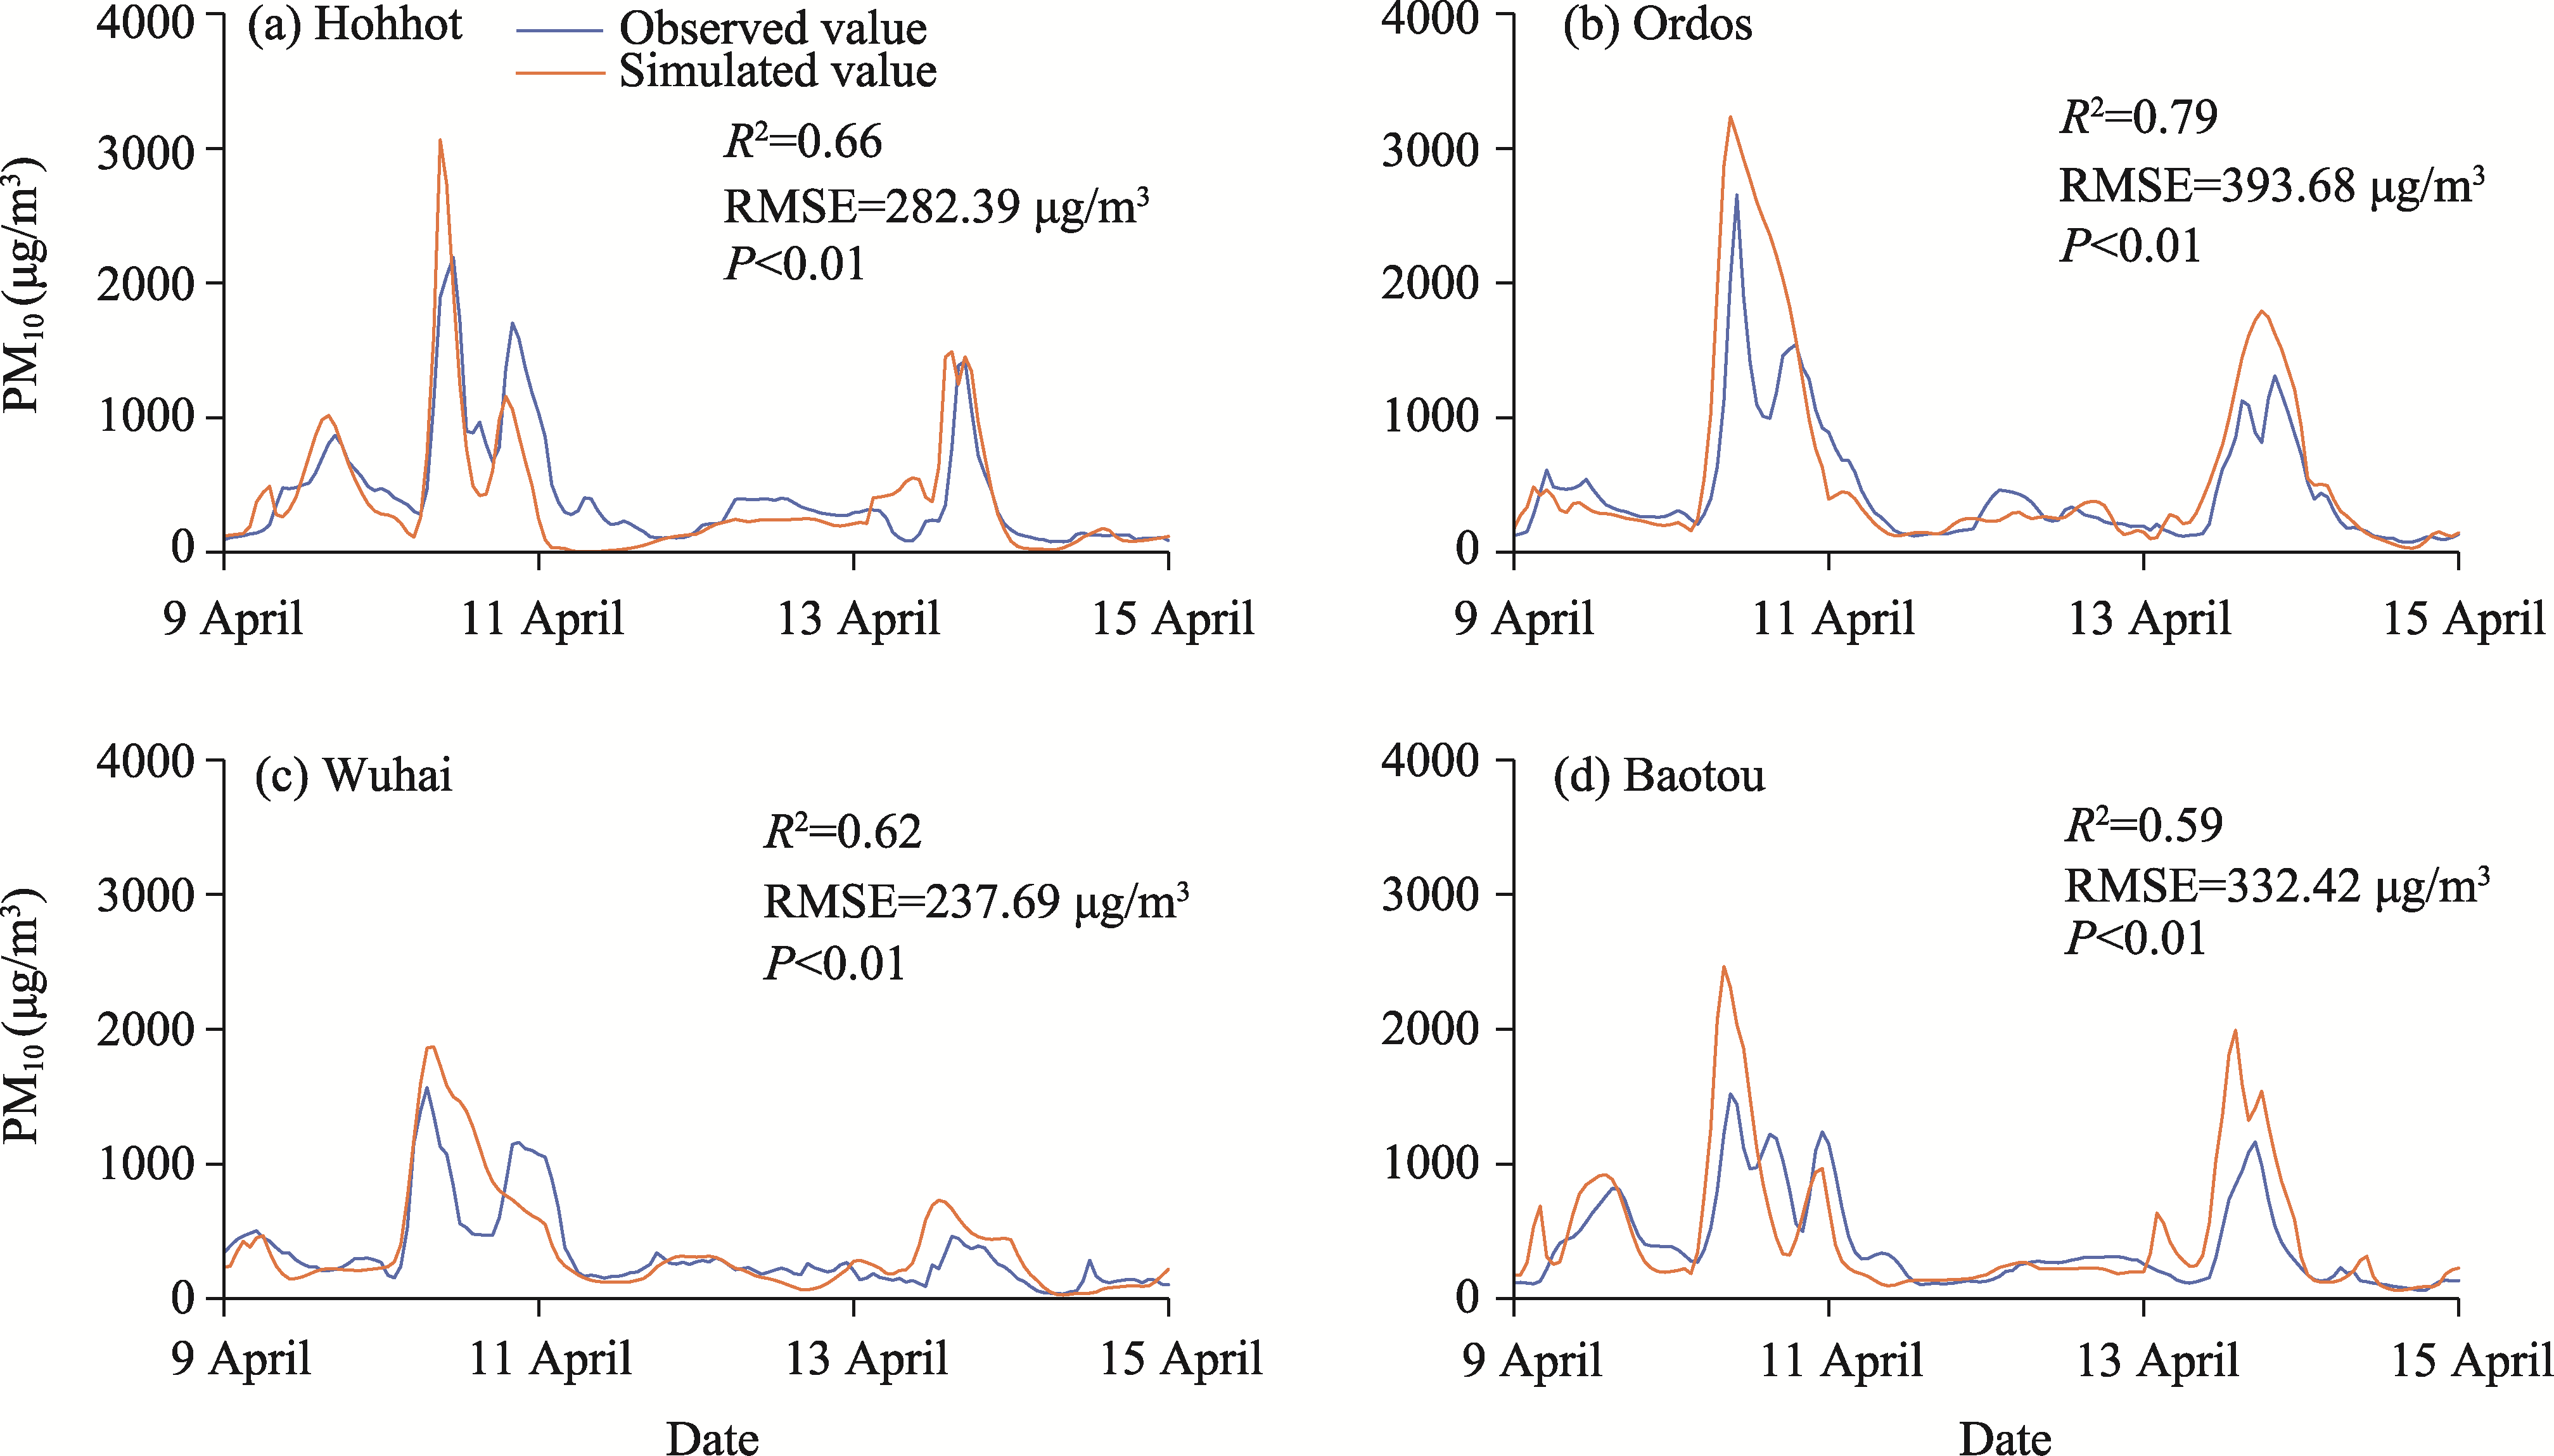
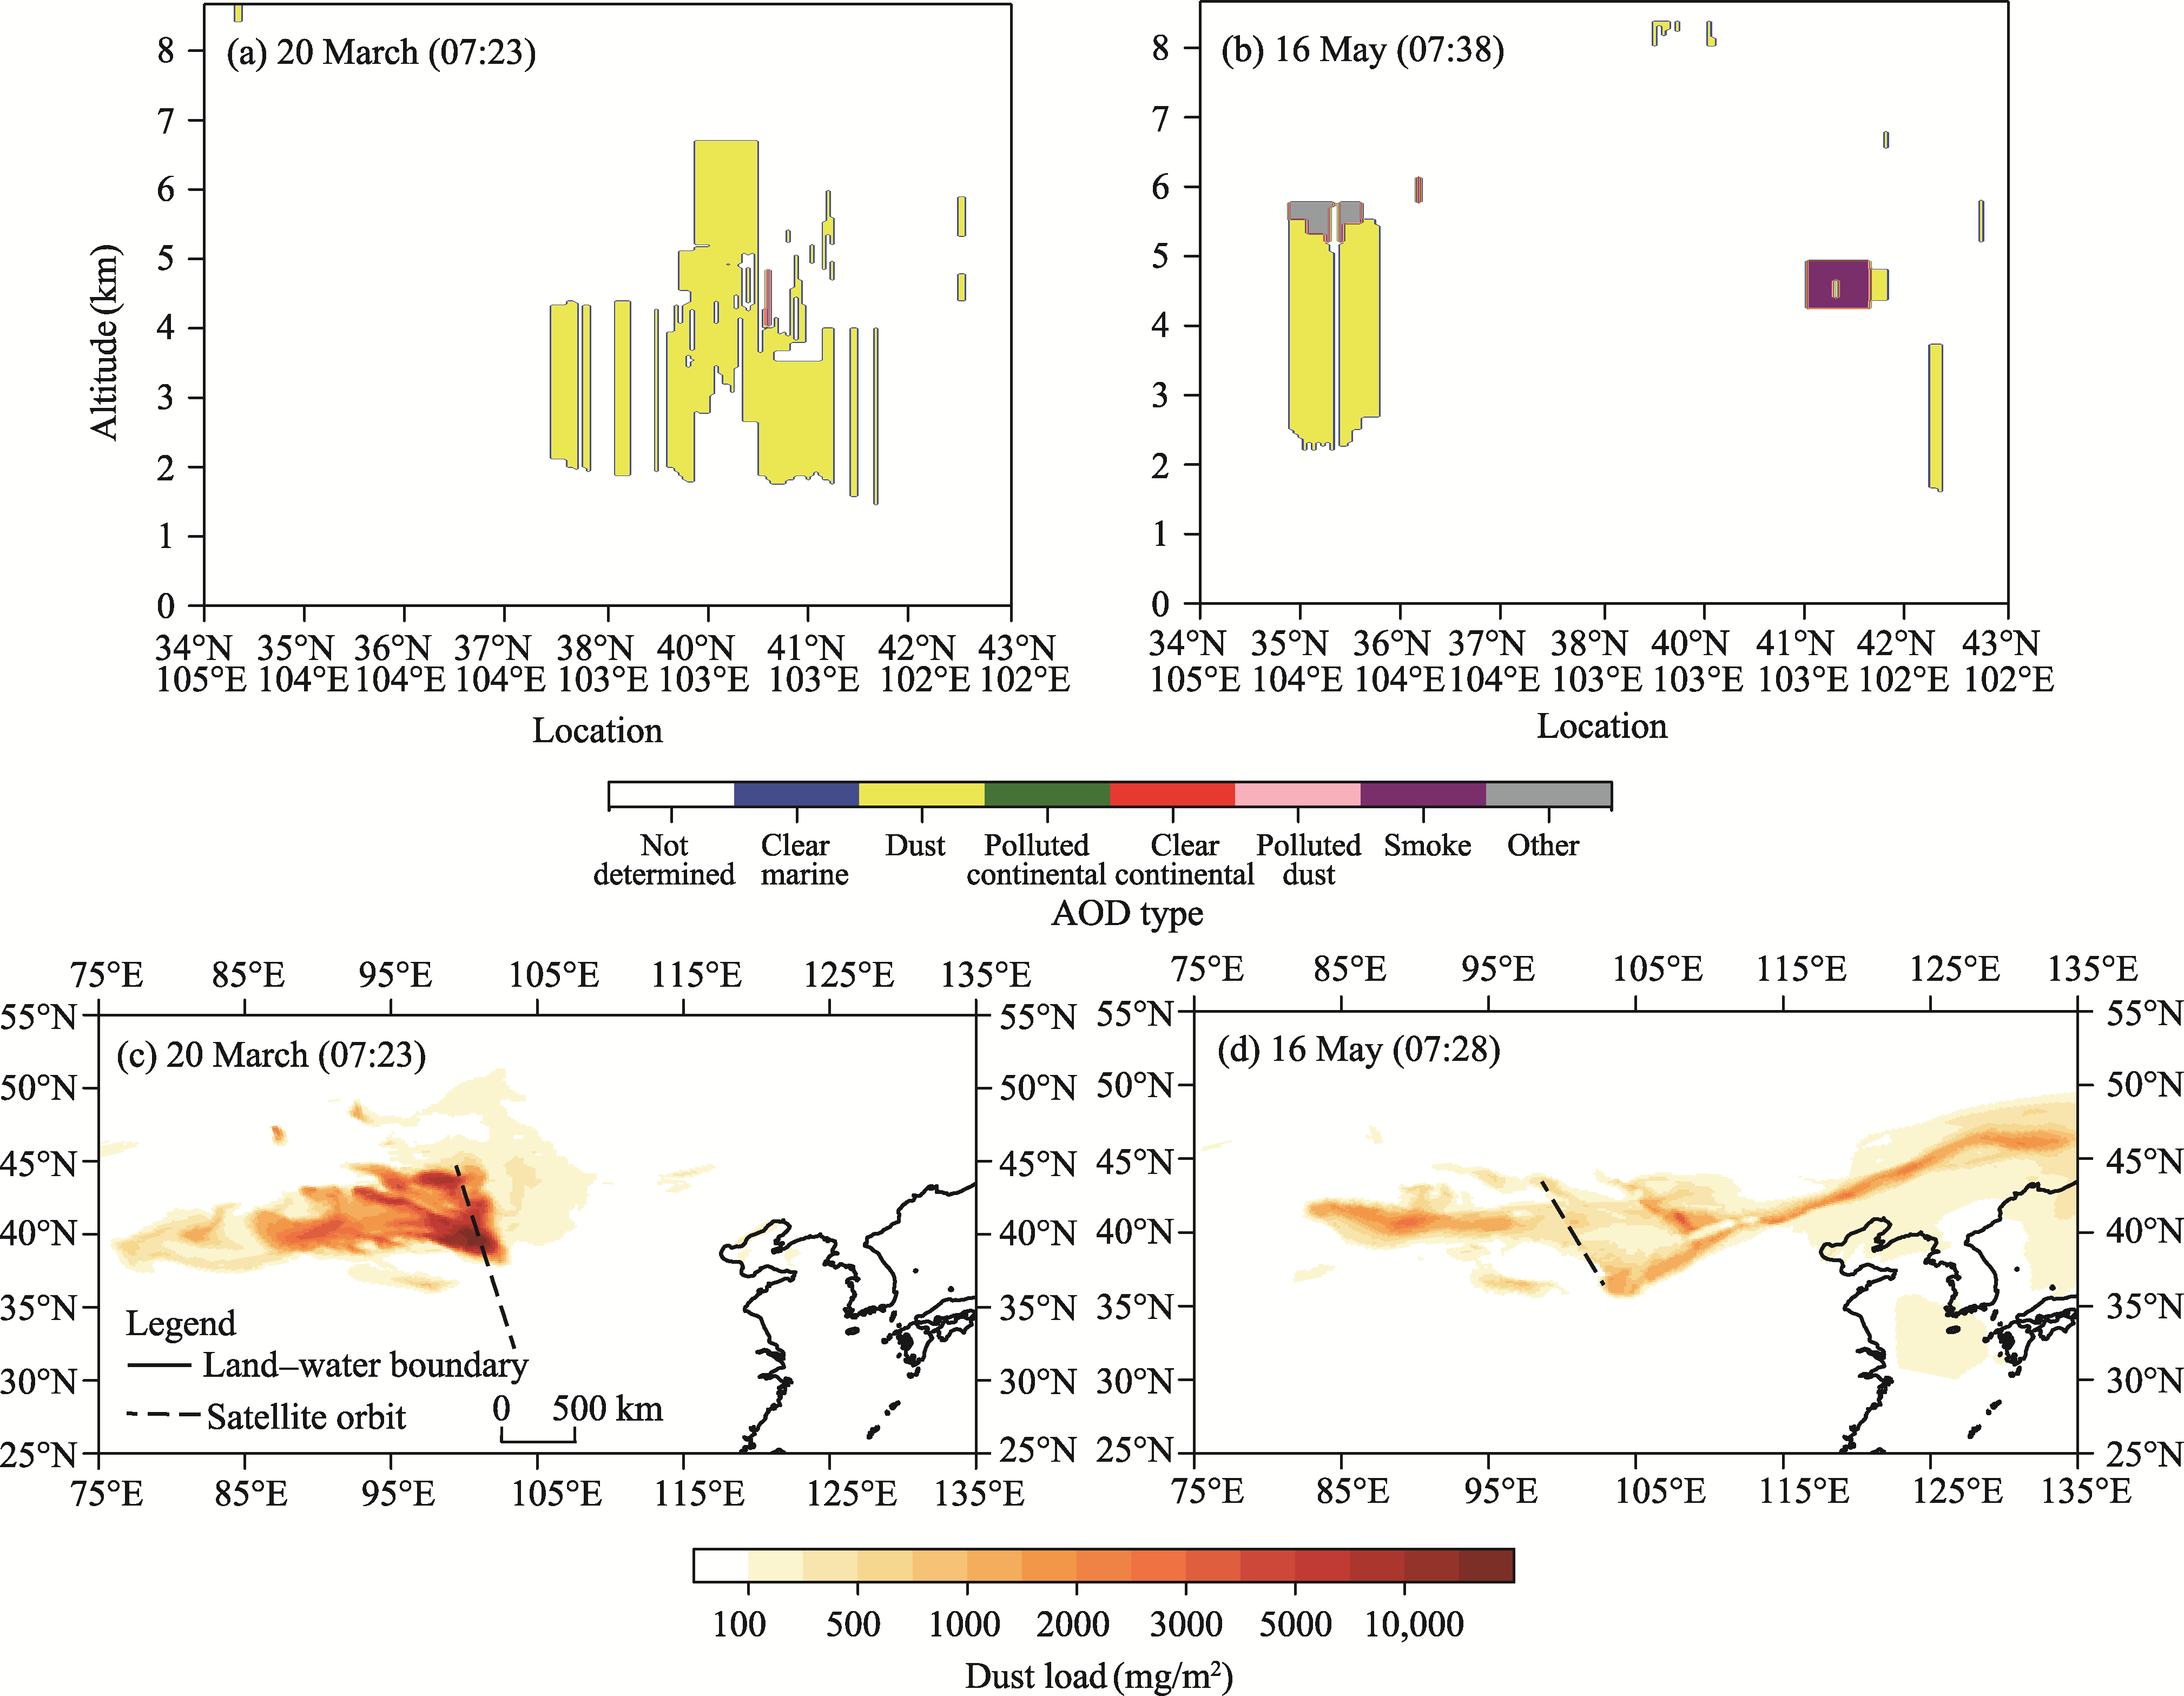
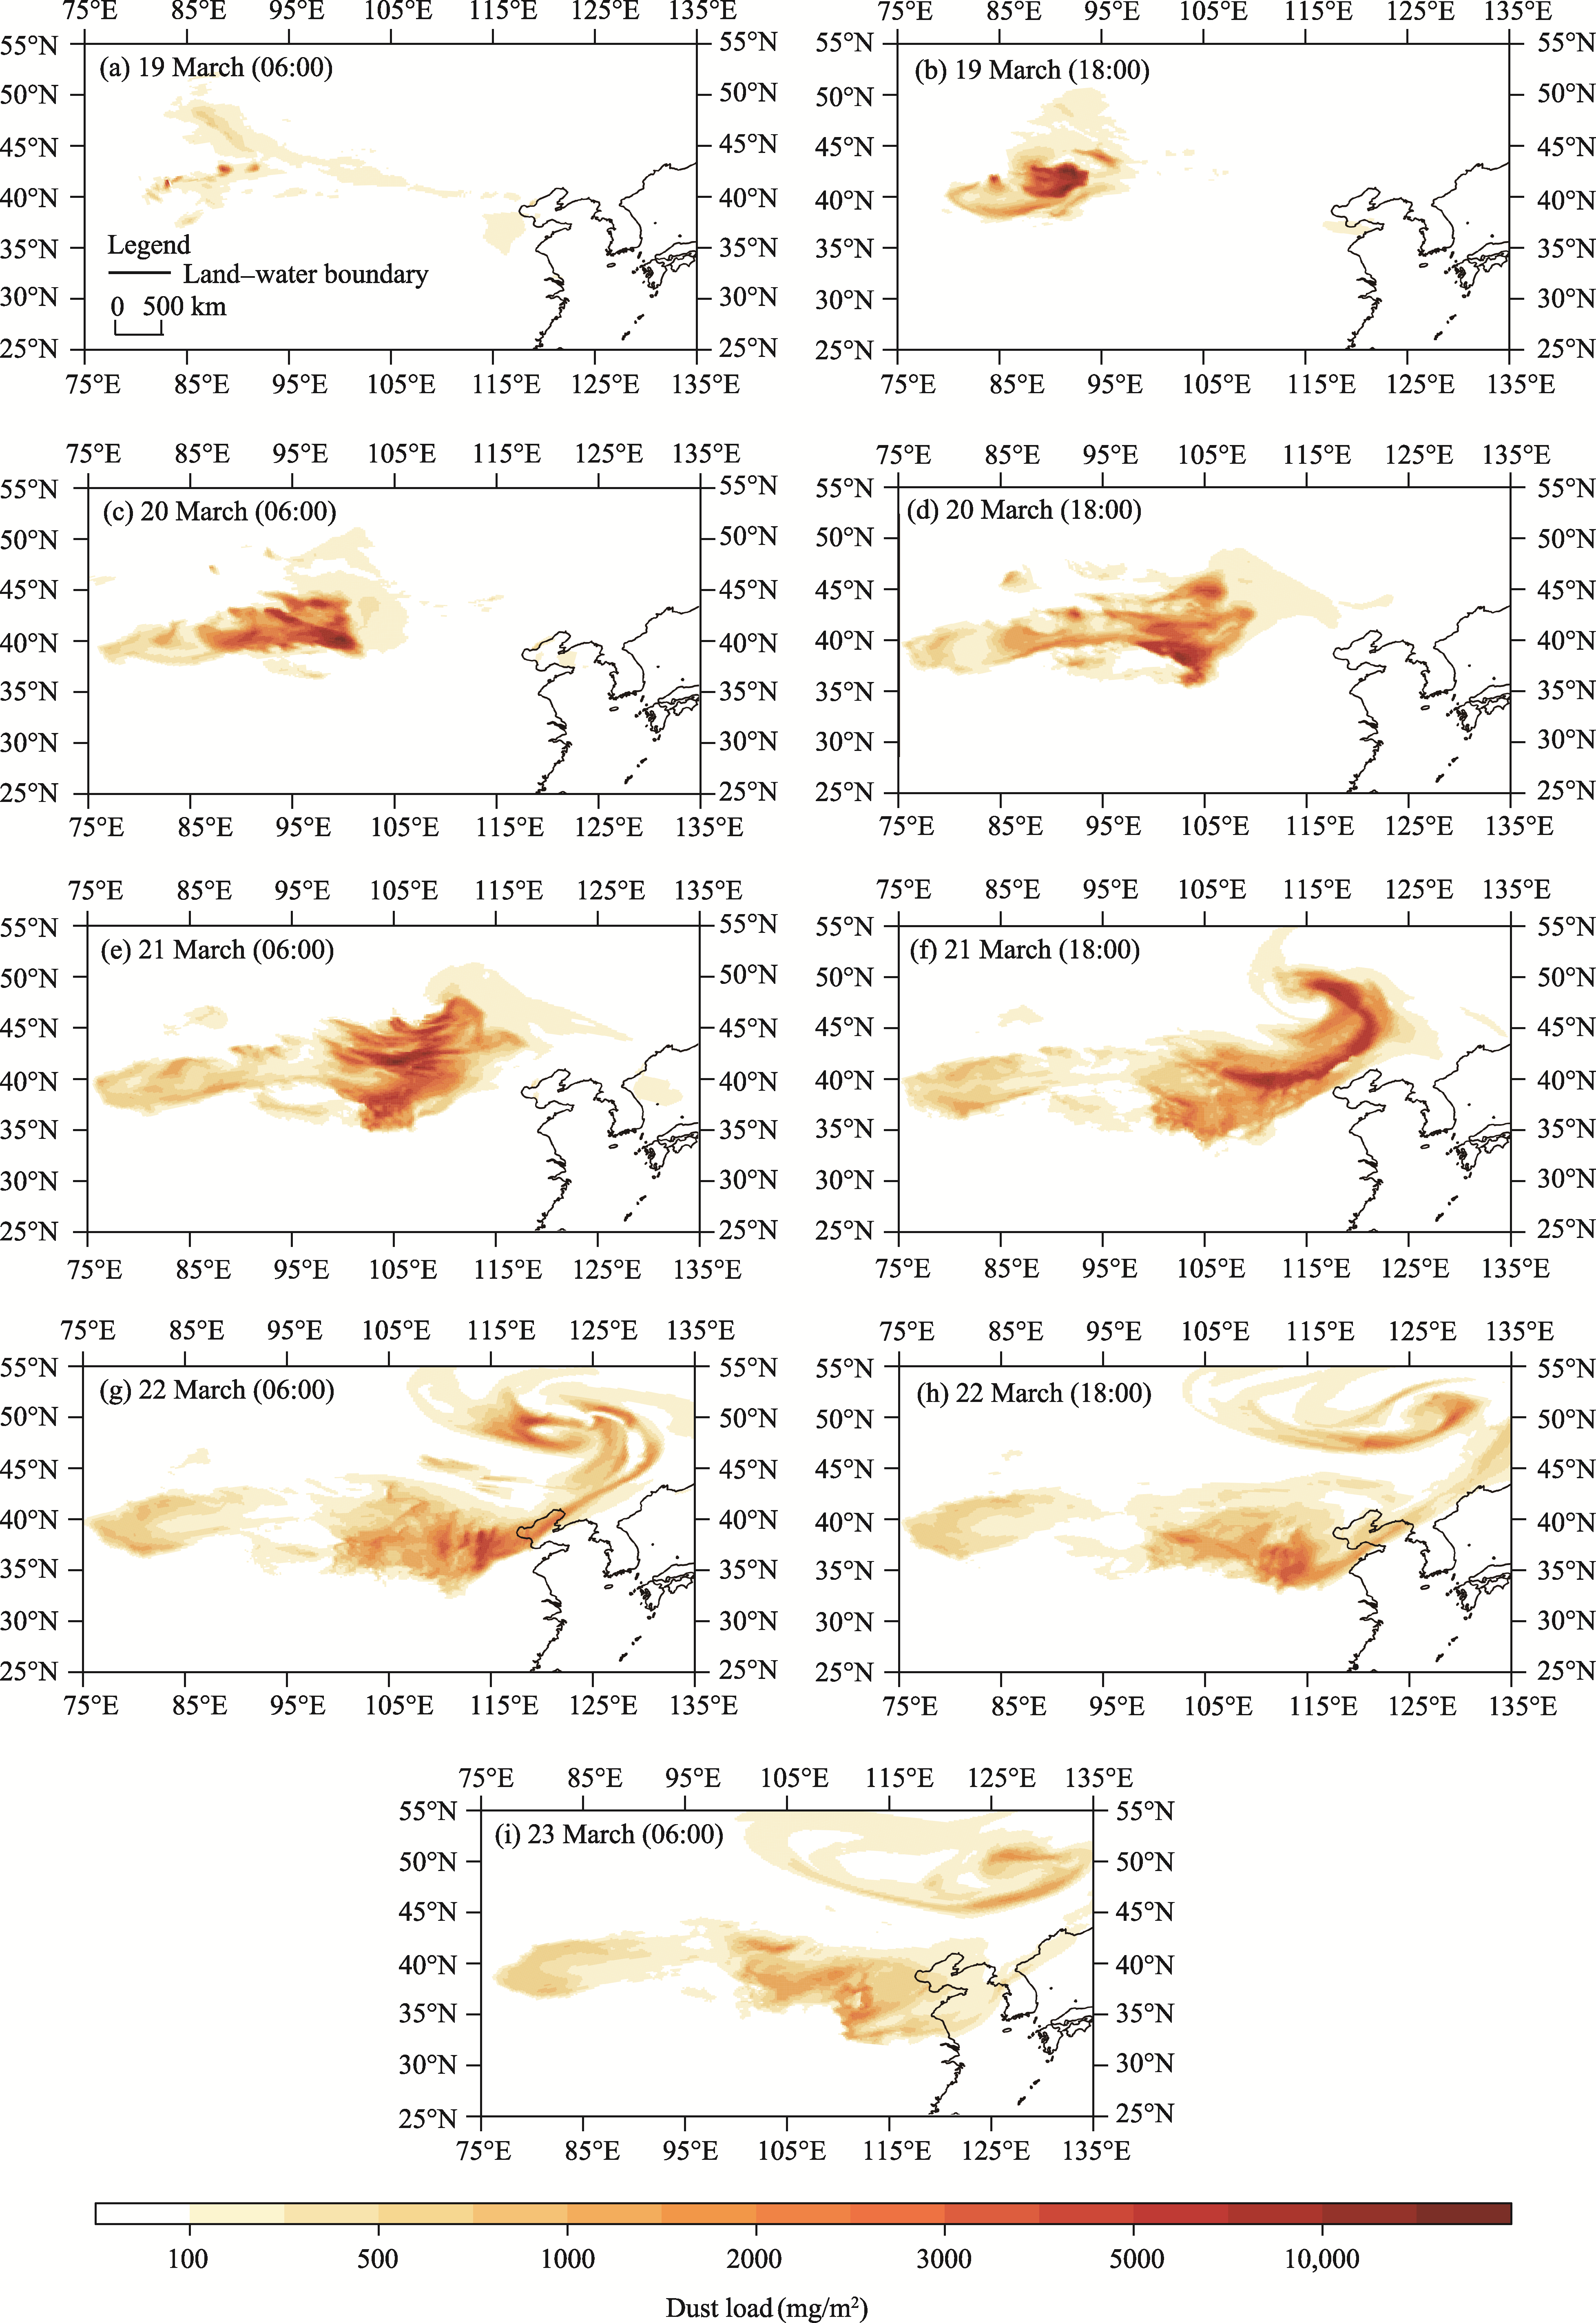
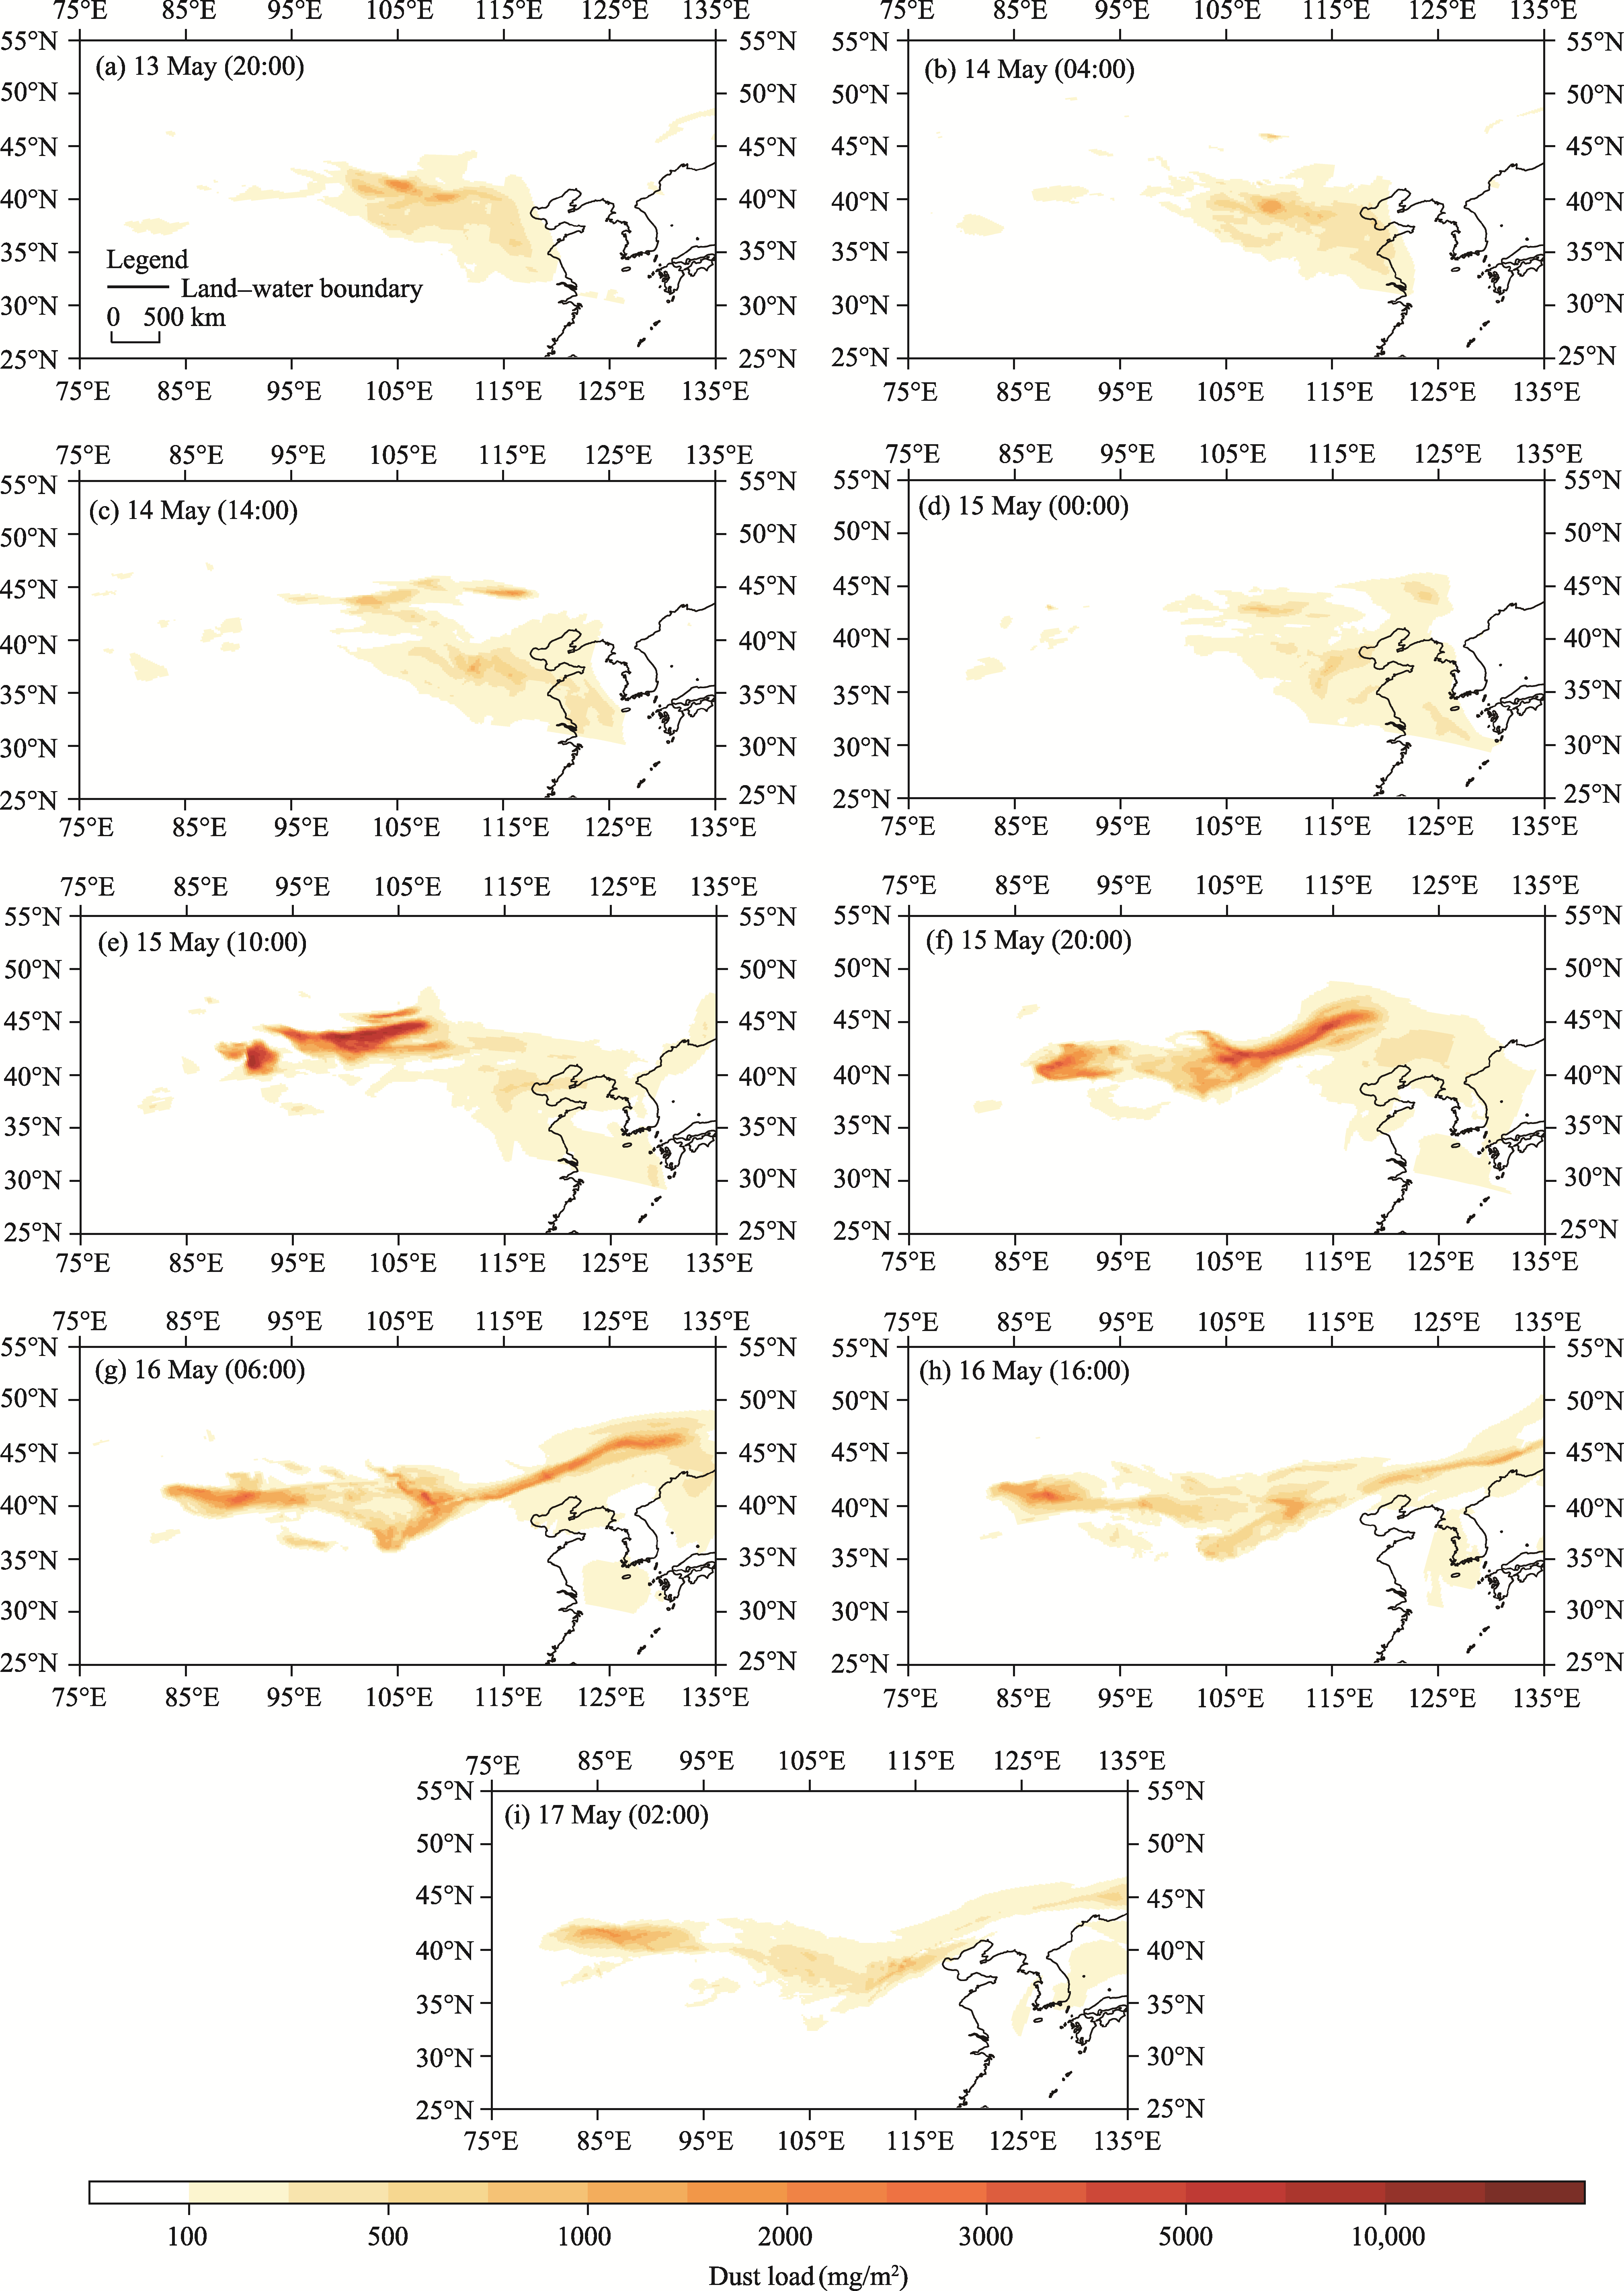
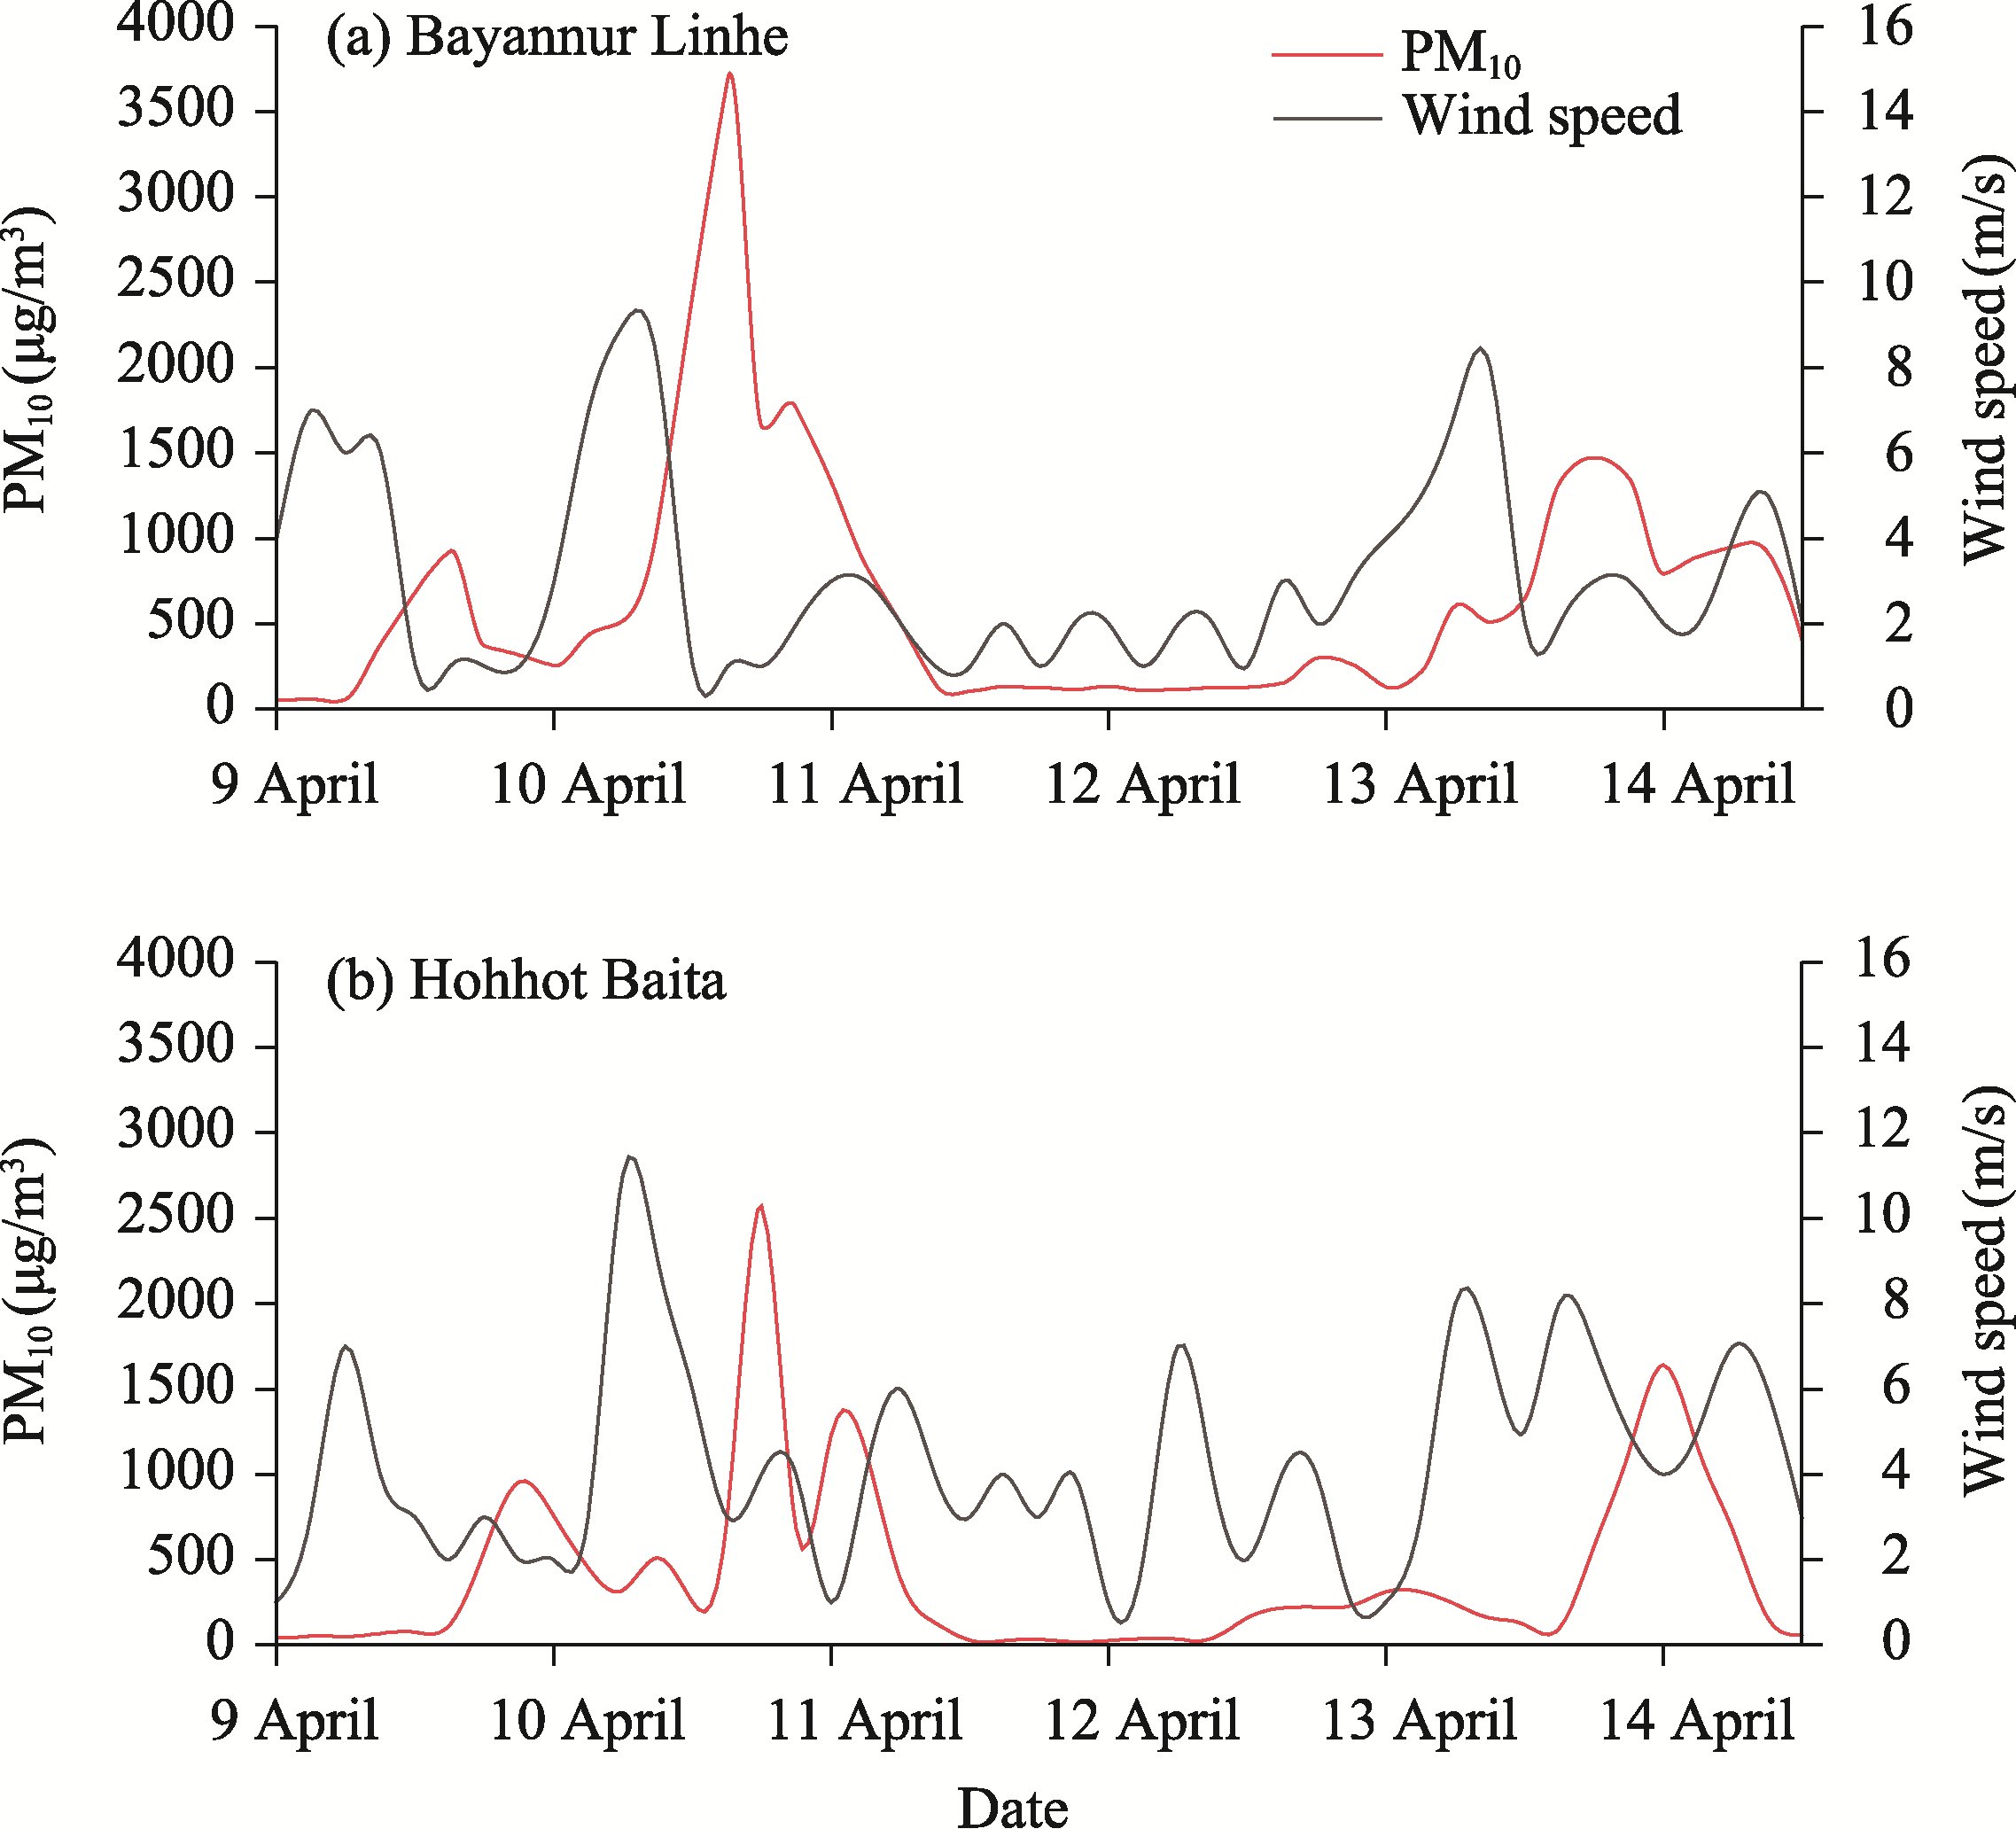
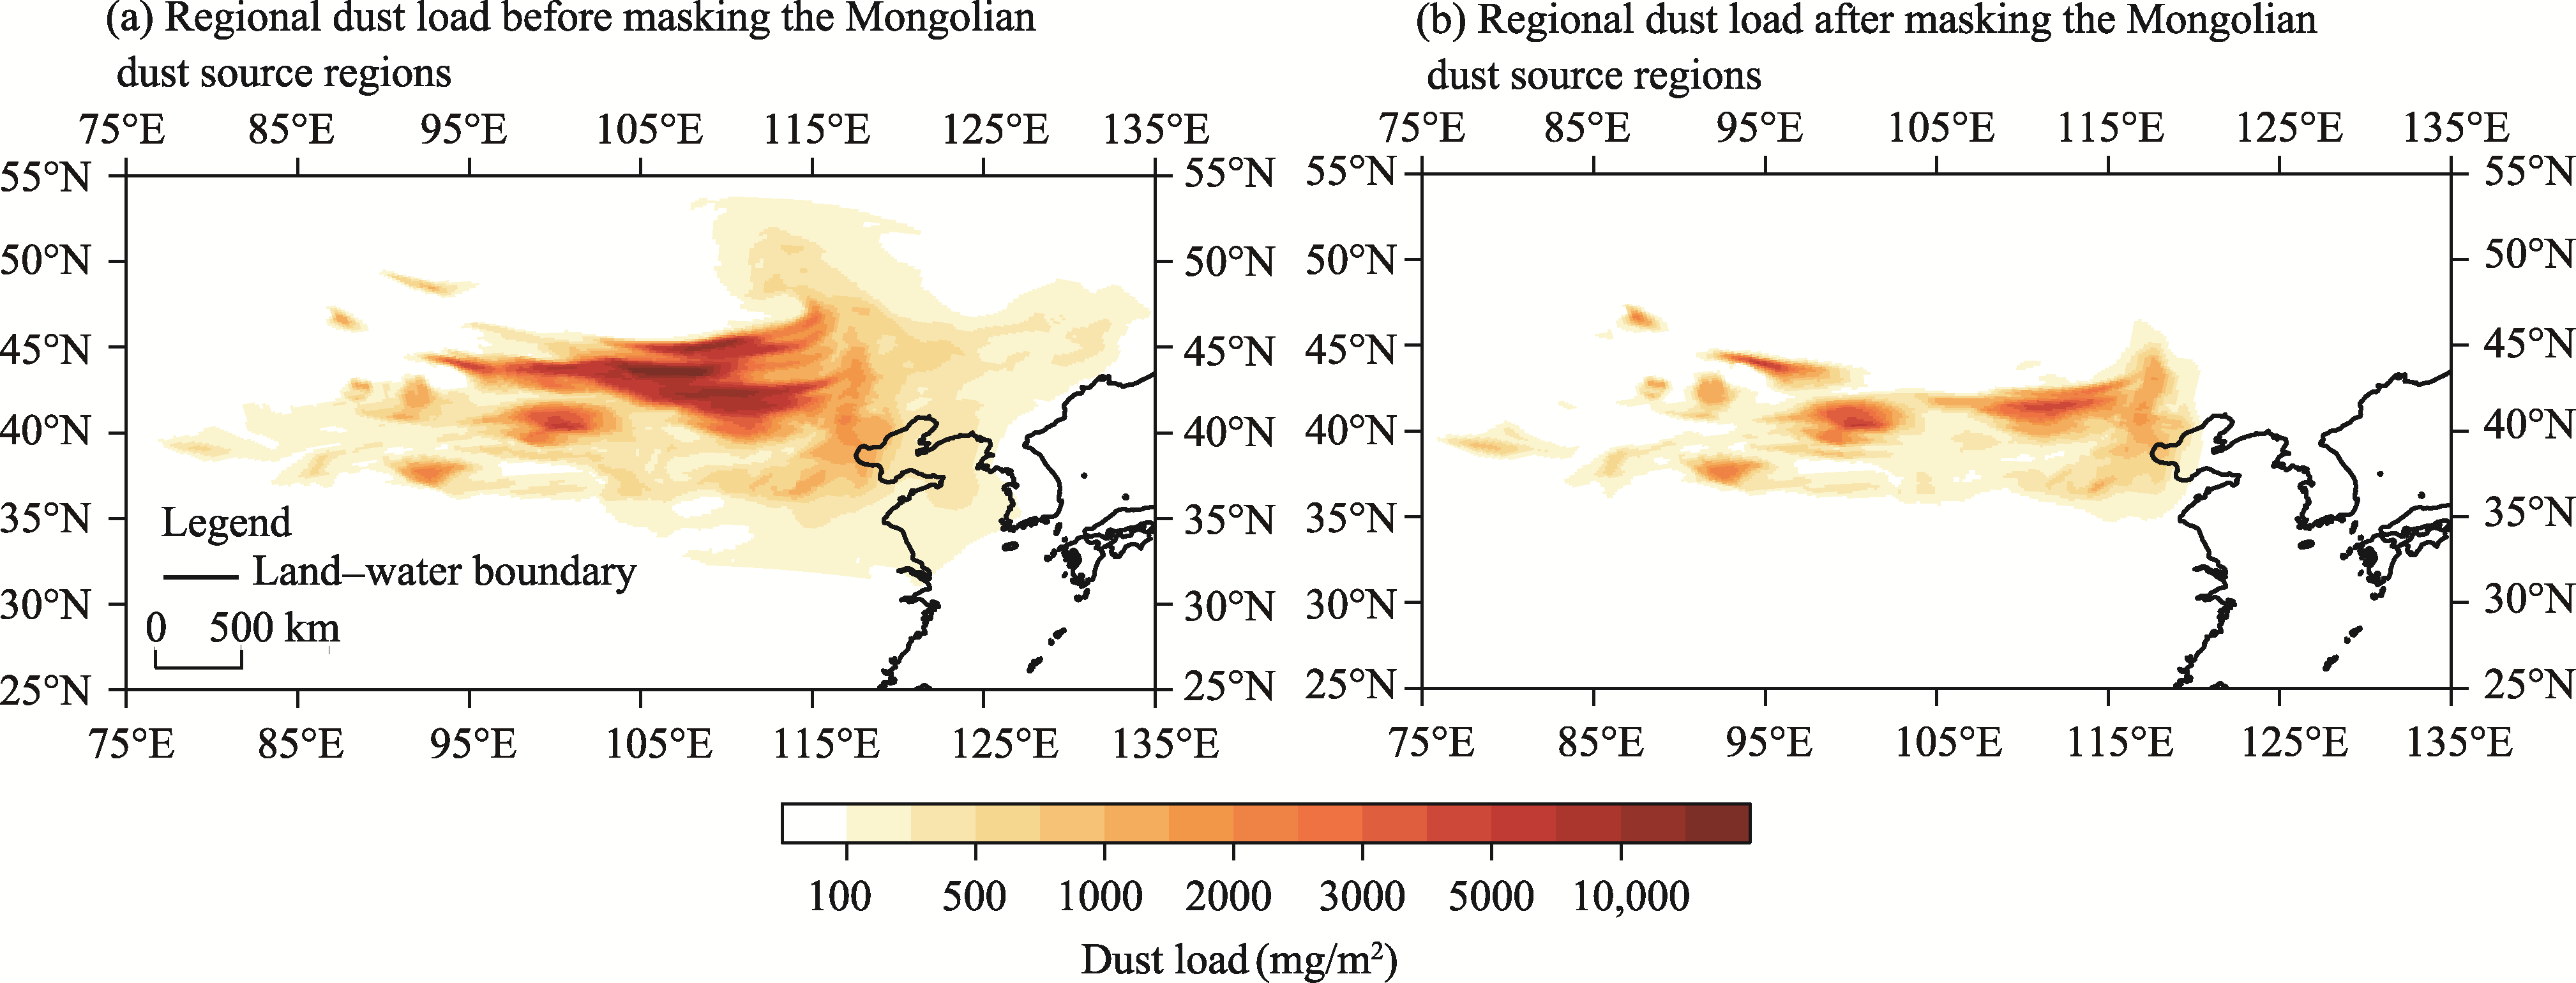
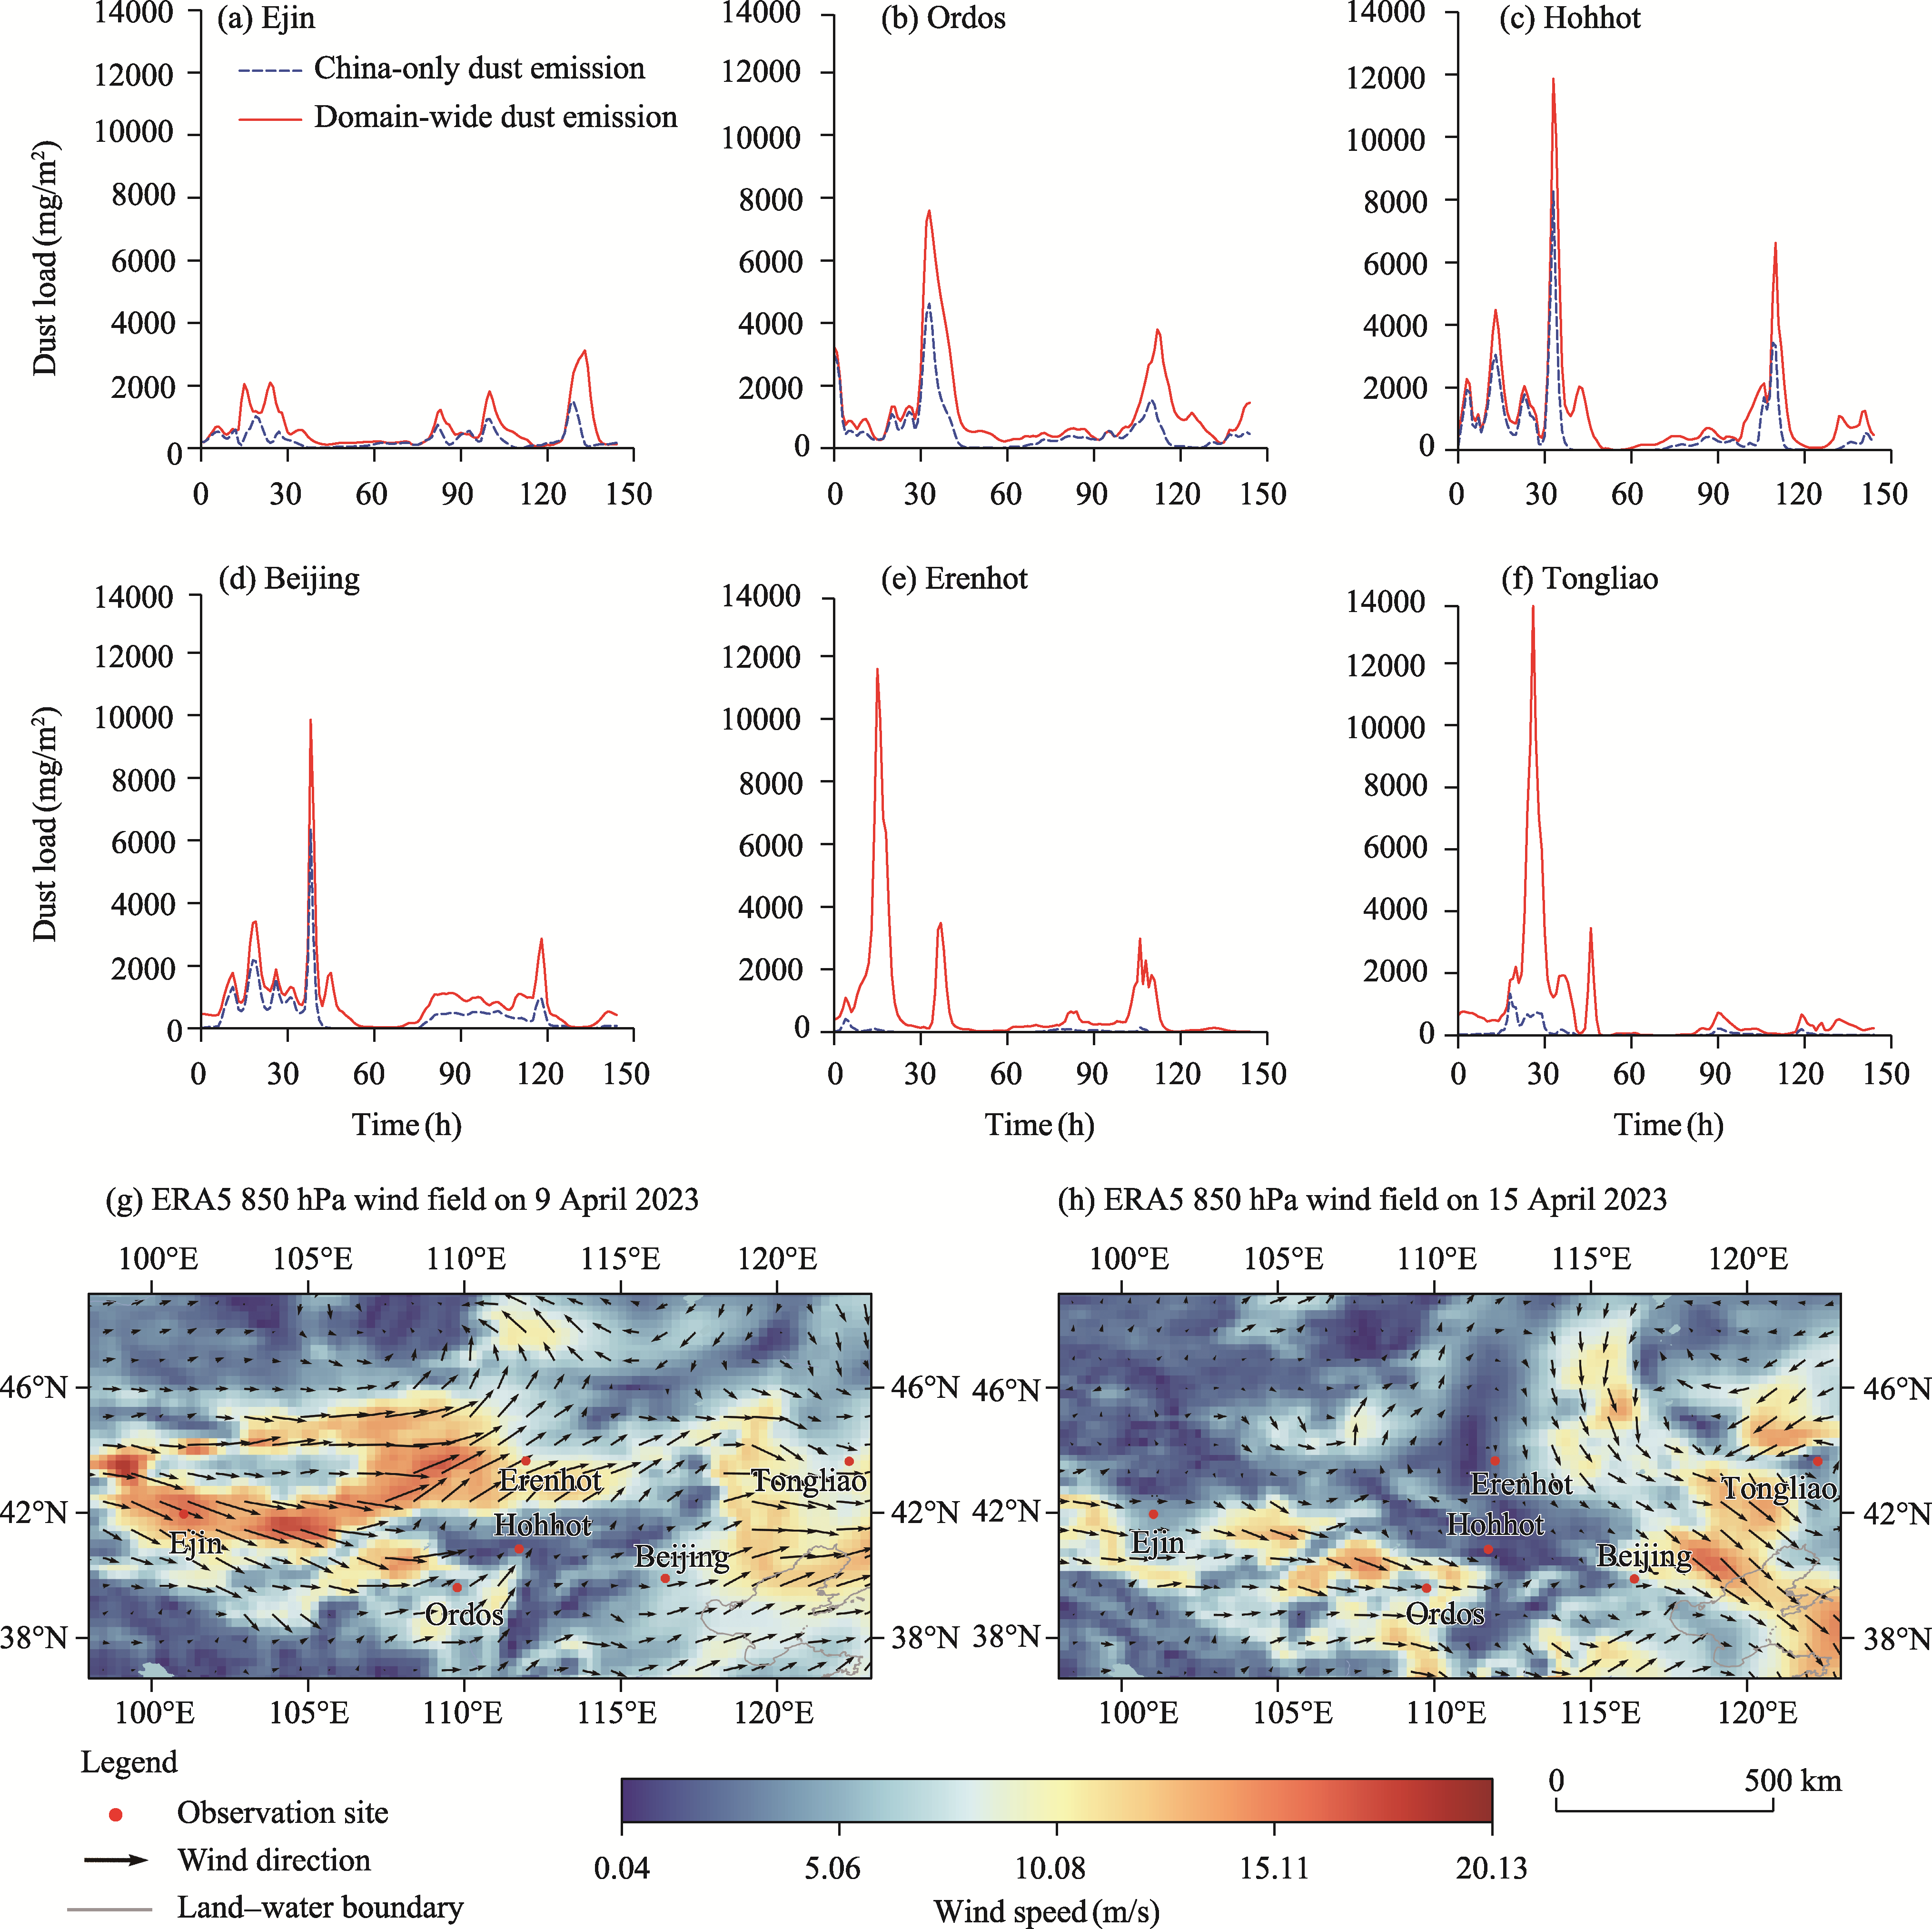
Abstract Sand and dust storms (SDSs) are natural disasters that frequently occur during spring in arid and semi-arid areas., causing serious impacts on human health, air quality, transportation, and agricultural production. Accurately simulating the occurrence and evolution of SDSs is of great significance for identifying dust sources and formulating effective disaster prevention measures. In this study, numerical simulations were conducted to reveal the dynamic spatiotemporal evolution and transport of dust load across East Asia. Using the Weather Research and Forecasting Model coupled with Chemistry (WRF-Chem) and European Centre for Medium-Range Weather Forecasts Reanalysis v5 (ERA5) data, the most severe SDS events in the spring of 2023 in East Asia were numerically simulated. The simulated results were compared and validated using meteorological observations and multisource remote sensing data. The results showed that the simulated dust load in the peak regions showed close agreement with ground-based observations during the events. The primary dust sources in spring 2023 were identified as the western desert of Mongolia, the Gobi Desert, and the Taklimakan Desert in Xinjiang Uygur Autonomous Region of China. Peak dust load and maximum wind speed occurred almost simultaneously, indicating that high wind speed was the primary driver of sand and dust mobilization during individual SDS events. Increased surface vegetation covers partially mitigated wind-driven dust emissions. In April, strong winds over the Gobi Desert on the Mongolian Plateau predominantly drove cross-border SDSs along northwestern and northward transport pathways. Dust originating from Mongolia exerts a substantial influence on particulate dust load in the central and eastern parts of Inner Mongolia Autonomous Region of China. In contrast, their impact on the northwestern regions of China remains relatively limited. These findings contribute to understanding the source areas of SDS events in East Asia by simulating the dynamic evolution of SDSs and elucidating the relationships between SDS events and local geographical and environmental factors.
|
|
Received: 15 October 2025
Published: 31 March 2026
|
|
Corresponding Authors:
*WANG Juanle (E-mail: wangjl@igsnrr.ac.cn)
|
|
|
| [1] |
Al-Khudhairy A A, Shaban A H, Al-Timimi Y K. 2023. Modis satellite data evaluation for detecting the dust storm using remote sensing techniques over Iraq. IOP Conference Series: Earth and Environmental Science, 1223: 012024, doi: 10.1088/1755-1315/1223/1/012024.
|
|
|
| [2] |
Allen R J, Landuyt W, Rumbold S T. 2015. An increase in aerosol burden and radiative effects in a warmer world. Nature Climate Change, 6: 269-274.
doi: 10.1038/nclimate2827
|
|
|
| [3] |
An L C, Che H Z, Xue M, et al. 2018. Temporal and spatial variations in sand and dust storm events in East Asia from 2007 to 2016: Relationships with surface conditions and climate change. Science of The Total Environment, 633: 452-462.
doi: 10.1016/j.scitotenv.2018.03.068
|
|
|
| [4] |
Asia B, Cholaw B, Mei Y, et al. 2024. Cross-border sand and dust storms between Mongolia and northern China in spring and their driving weather systems. Remote Sensing, 16(12): 2164, doi: 10.3390/rs16122164.
|
|
|
| [5] |
Attiya A A, Jones B G. 2024. A huge dust storm influenced air quality on 16 May 2022 in Baghdad City, Iraq; Tracked using remote sensing techniques and meteorological data. IOP Conference Series: Earth and Environmental Science, 1371: 022036, doi: 10.1088/1755-1315/1371/2/022036.
|
|
|
| [6] |
Bell L M, Levy K J, Lin Z. 2007. The effect of sandstorms and air pollution on cause-specific hospital admissions in Taipei, Taiwan. Occupational and Environmental Medicine, 65(2): 104, doi: 10.1136/oem.2006.031500.
|
|
|
| [7] |
Bessho K, Date K, Hayashi M, et al. 2016. An introduction to Himawari-8/9—Japan's new-generation geostationary meteorological satellites. Journal of the Meteorological Society of Japan. Ser. II, 94(2): 151-183.
|
|
|
| [8] |
Broomandi P, Mohammadpour K, Kaskaoutis D G, et al. 2023. A synoptic- and remote sensing-based analysis of a severe dust storm event over Central Asia. Aerosol and Air Quality Research, 23: 220309, doi: 10.4209/aaqr.220309.
|
|
|
| [9] |
Cao Y D, Ma M J, Kang G Q, et al. 2025. Numerical simulation and diagnosis of a severe dust storm event in Northwest China. Arid Zone Research, 42(1): 1-13. (in Chinese)
doi: 10.13866/j.azr.2025.01.01
|
|
|
| [10] |
Chen F, Kenneth M, John S, et al. 1996. Modeling of land surface evaporation by four schemes and comparison with FIFE observations. Journal of Geophysical Research: Atmospheres, 101(D3): 7251-7268.
doi: 10.1029/95JD02165
|
|
|
| [11] |
Chen S Y, Huang J P, Li J X, et al. 2017. Comparison of dust emissions, transport, and deposition between the Taklimakan Desert and Gobi Desert from 2007 to 2011. Science China Earth Sciences, 60(7): 1338-1355.
doi: 10.1007/s11430-016-9051-0
|
|
|
| [12] |
Chen S Y, Zhao D, Huang J P, et al. 2023. Mongolia contributed more than 42% of the dust concentrations in northern China in March and April 2023. Advances in Atmospheric Sciences, 40(9): 1549-1557.
doi: 10.1007/s00376-023-3062-1
|
|
|
| [13] |
Duce R A, Unni C K, Ray B J, et al. 1980. Long-range atmospheric transport of soil dust from Asia to the tropical North Pacific: Temporal variability. Science, 209(4464): 1522-1524.
pmid: 17745962
|
|
|
| [14] |
Eckert S, Hüsler F, Liniger H, et al. 2015. Trend analysis of MODIS NDVI time series for detecting land degradation and regeneration in Mongolia. Journal of Arid Environments, 113: 16-28.
doi: 10.1016/j.jaridenv.2014.09.001
|
|
|
| [15] |
Gao Q X, Li L J, Zhang Y G, et al. 2000. Research on spring sandstorms in China. China Environmental Science, 20(6): 495-500. (in Chinese)
|
|
|
| [16] |
Ginoux P, Prospero J, Torres O, et al. 2004. Long-term simulation of global dust distribution with the GOCART model: correlation with North Atlantic Oscillation. Environmental Modelling & Software, 19(2): 113-128.
|
|
|
| [17] |
Ginoux P, Prospero M J, Gill E T, et al. 2012. Global-scale attribution of anthropogenic and natural dust sources and their emission rates based on MODIS Deep Blue aerosol products. Reviews of Geophysics, 50(3): RG3005, doi: 10.1029/ 2012RG000388.
|
|
|
| [18] |
Guo E L, Wang Y F, Wang C L, et al. 2021. NDVI indicates long-term dynamics of vegetation and its driving forces from climatic and anthropogenic factors in Mongolian Plateau. Remote Sensing, 13(4): 688, doi: 10.3390/rs13040688.
|
|
|
| [19] |
Hamidi M, Kavianpour M R, Shao Y P. 2017. A quantitative evaluation of the 3-8 July 2009 Shamal dust storm. Aeolian Research, 24: 133-143.
doi: 10.1016/j.aeolia.2016.12.004
|
|
|
| [20] |
Hara Y, Jin Y, Shimizu A, et al. 2025. Factors behind the rare winter Asian sand and dust storm in December 2022. Atmospheric Environment, 362: 121544, doi: 10.1016/j.atmosenv.2025.121544.
|
|
|
| [21] |
Jade Lim J O, Hong S Y. 2005. Effects of bulk ice microphysics on the simulated monsoonal precipitation over east Asia. Journal of Geophysical Research: Atmospheres, 110(D24): D24201, doi: 10.1029/2005JD006166.
|
|
|
| [22] |
Kang J Y, Tanaka T Y, Mikami M. 2014. Effect of dead leaves on early spring dust emission in East Asia. Atmospheric Environment, 86: 35-46.
doi: 10.1016/j.atmosenv.2013.12.007
|
|
|
| [23] |
Kok J F, Adebiyi A A, Albani S, et al. 2021. Contribution of the world's main dust source regions to the global cycle of desert dust. Atmospheric Chemistry and Physics, 21(10): 8169-8193.
|
|
|
| [24] |
Kotsyfakis M, Zarogiannis S G, Patelarou E. 2019. The health impact of Saharan dust exposure. International Journal of Occupational Medicine and Environmental Health, 32(6): 749-760.
doi: 110732
pmid: 31603438
|
|
|
| [25] |
Krishna K R, Prasad D H, Harikishan G, et al. 2024. Investigation of dust-induced direct radiative forcing over the Arabian Peninsula based on high-resolution WRF-Chem simulations. Journal of Geophysical Research: Atmospheres, 129(13): e2024JD040963, doi: 10.1029/2024JD040963.
|
|
|
| [26] |
LeGrand S L, Polashenski C, Letcher T W, et al. 2019. The AFWA dust emission scheme for the GOCART aerosol model in WRF-Chem v3.8.1. Geoscientific Model Development, 12(1): 131-166.
doi: 10.5194/gmd-12-131-2019
|
|
|
| [27] |
Lelieveld J, Evans J S, Fnais M, et al. 2015. The contribution of outdoor air pollution sources to premature mortality on a global scale. Nature, 525: 367-371.
doi: 10.1038/nature15371
|
|
|
| [28] |
Li Y. 2018. Business application of FY satellite in monitoring sandstorm weather. Satellite Application, (11): 24-28. (in Chinese)
|
|
|
| [29] |
Liu H, Gong P, Wang J, et al. 2020. Annual dynamics of global land cover and its long-term changes from 1982 to 2015. Earth System Science Data, 12(2): 1217-1243.
doi: 10.5194/essd-12-1217-2020
|
|
|
| [30] |
Liu J B, Qiang M R, Kang S G, et al. 2025. Editorial preface to special issue: Variability and driving mechanisms of Asian dust storms from the Holocene to the present. Global and Planetary Change, 253: 104936, doi: 10.1016/j.gloplacha.2025.104936.
|
|
|
| [31] |
Liu X D, Yin Z Y, Zhang X Y, et al. 2004. Analyses of the spring dust storm frequency of northern China in relation to antecedent and concurrent wind, precipitation, vegetation, and soil moisture conditions. Journal of Geophysical Research: Atmospheres, 109(D16): D16210, doi: 10.1029/2004JD004615.
|
|
|
| [32] |
Ma Y H, Mao R, Shi C C, et al. 2024. Increasing cross-border dust storm from Mongolia to China during 1987-2022. Global and Planetary Change, 242: 104578, doi: 10.1016/J.GLOPLACHA.2024.104578.
|
|
|
| [33] |
Marticorena B, Bergametti G. 1995. Modeling the atmospheric dust cycle. Part 1: Design of a soil-derived dust emission scheme. Journal of Geophysical Research: Atmospheres, 100(D8): 16415-16430.
doi: 10.1029/95JD00690
|
|
|
| [34] |
Marticorena B, Bergametti G, Aumont B, et al. 1997. Modeling the atmospheric dust cycle: 2. Simulation of Saharan dust sources. Journal of Geophysical Research: Atmospheres, 102(D4): 4387-4404.
doi: 10.1029/96JD02964
|
|
|
| [35] |
Matsui K T, Matsubayashi M, Sakaguchi M Y, et al. 2018. Six-month cultured cerebral organoids from human ES cells contain matured neural cells. Neuroscience Letters, 670: 75-82.
doi: S0304-3940(18)30045-4
pmid: 29398520
|
|
|
| [36] |
Michael J I, Jennifer S D, Eli J M, et al. 2008. Radiative forcing by long-lived greenhouse gases: Calculations with the AER radiative transfer models. Journal of Geophysical Research: Atmospheres, 113(D13): 8, doi: 10.1029/2008JD009944.
|
|
|
| [37] |
Mikalai F. 2022. Characteristics of the severe March 2021 Gobi Desert dust storm and its impact on air pollution in China. Chemosphere, 287: 132219, doi: 10.1016/j.chemosphere.2021.132219.
|
|
|
| [38] |
Pang Y, Han Z W, Zhu B, et al. 2014. A model study on distribution and evolution of atmospheric pollutants over Beijing-Tianjin-Hebei region in summertime with WRF-Chem. Transactions of Atmospheric Sciences, 36(6): 674-682. (in Chinese)
|
|
|
| [39] |
Qiu Y, Li L J, Lu H F, et al. 2018. Dust remote sensing monitoring and application based on Himawari 8. China Environmental Science, 38(9): 3305-3312. (in Chinese)
|
|
|
| [40] |
Shao Y P. 2004. Simplification of a dust emission scheme and comparison with data. Journal of Geophysical Research: Atmospheres, 109(D10): D10202, doi: 10.1029/2003JD004372.
|
|
|
| [41] |
Shao Y P. 2009. Physics and Modelling of Wind Erosion. Dordrecht: Springer.
|
|
|
| [42] |
Singh J, Singh N, Ojha N, et al. 2024. Impacts of different boundary layer parameterization schemes on simulation of meteorology over Himalaya. Atmospheric Research, 298: 107154, doi: 10.1016/J.ATMOSRES.2023.107154.
|
|
|
| [43] |
Soci C, Hersbach H, Simmons A, et al. 2024. The ERA 5 global reanalysis from 1940 to 2022. Quarterly Journal of the Royal Meteorological Society, 150(764): 4014-4048.
doi: 10.1002/qj.v150.764
|
|
|
| [44] |
Su L G, Xie Z W, Yong M, et al. 2025. Influence of cut-off lows on dust transport from the Great Lakes Basin to northern China. Global and Planetary Change, 247: 104738, doi: 10.1016/j.gloplacha.2025.104738.
|
|
|
| [45] |
Tan S C, Shi G Y, Wang H. 2011. Long-range transport of spring dust storms in Inner Mongolia and impact on the China seas. Atmospheric Environment, 46: 299-308.
doi: 10.1016/j.atmosenv.2011.09.058
|
|
|
| [46] |
Tang W Q, Dai T, Cheng Y M, et al. 2022. A study of a severe spring dust event in 2021 over East Asia with WRF-Chem and multiple platforms of observations. Remote Sensing, 14(15): 3795, doi: 10.3390/rs14153795.
|
|
|
| [47] |
Tetsuya T, Naoko S. 2005. Dust storms and cyclone tracks over the arid regions in east Asia in spring. Journal of Geophysical Research: Atmospheres, 110(D18): D18S11, doi: 10.1029/2004JD004698.
|
|
|
| [48] |
Tian J Y, Liu R H, Ding L Q, et al. 2021. Evaluation of the WRF physical parameterisations for Typhoon rainstorm simulation in southeast coast of China. Atmospheric Research, 247: 105130, doi: 10.1016/j.atmosres.2020.105130.
|
|
|
| [49] |
Umberto R, Elenio A, Mauro M, et al. 2023. On the interplay between desert dust and meteorology based on WRF-Chem simulations and remote sensing observations in the Mediterranean Basin. Remote Sensing, 15(2): 435, doi: 10.3390/ rs15020435.
|
|
|
| [50] |
Wang H B, Jia X P, Li K, et al. 2015. Horizontal wind erosion flux and potential dust emission in arid and semiarid regions of China: A major source area for East Asia dust storms. CATENA, 133: 373-384.
doi: 10.1016/j.catena.2015.06.011
|
|
|
| [51] |
Wang J L, Li K, Xu S X, et al. 2024. Issues, progress, and recommendations in the construction of ecological barrier on the Mongolian Plateau from the perspective of big data. Journal of Resources and Ecology, 15(5): 1113-1124.
doi: 10.5814/j.issn.1674-764x.2024.05.001
|
|
|
| [52] |
Wang N, Chen J, Zhang Y Y, et al. 2022. Multi-source remote sensing analysis of the first sand and dust weather in Northern China in 2021. China Environmental Science, 42(5): 2002-2014. (in Chinese)
|
|
|
| [53] |
Wu C L, Lin C H. 2014. Impact of two different dust emission schemes on the simulation of a severe dust storm in East Asia using the WRF/Chem Model. Climatic and Environmental Research, 19(4): 419-436. (in Chinese)
|
|
|
| [54] |
Wu C L, Lin C H, Shao Y P, et al. 2022. Drivers of recent decline in dust activity over East Asia. Nature Communications, 13: 7105, doi: 10.1038/s41467-022-34823-3.
pmid: 36402787
|
|
|
| [55] |
Wu Y, Wen B, Li S S, et al. 2021. Sand and dust storms in Asia: a call for global cooperation on climate change. The Lancet Planetary Health, 5(6): e329-e330.
|
|
|
| [56] |
Yin X, Tan C H, Jia S G, et al. 2022. Simulating two typical dust storms with the WRF-Chem model: Sensitivity of different dust emission schemes. Geochimica, 51(5): 528-539. (in Chinese)
|
|
|
| [57] |
Yin Z C, Huo Q Y, Ma X Q, et al. 2023. Mechanisms of dust source accumulation and synoptic disturbance triggering the 2023 spring sandstorm in northern China. Transactions of Atmospheric Sciences, 46(3): 321-331. (in Chinese)
|
|
|
| [58] |
Zhang L Y, Wang W C, Luo C H, et al. 2020. Effects of dust transport path and deposition on Chlorophyll α concentration in the South Yellow Sea. Periodical of Ocean University of China, 50(8): 9-18. (in Chinese)
|
|
|
| [59] |
Zhao J Q, Ma X Y, Wu S Q, et al. 2020a. Dust emission and transport in Northwest China: WRF-Chem simulation and comparisons with multi-sensor observations. Atmospheric Research, 241: 104978, doi: 10.1016/j.atmosres.2020.104978.
|
|
|
| [60] |
Zhao W P, Zhao J, Liu X R, et al. 2020b. Influence of WRF/Chem Model's dust emission weight factor on dust simulation result. Journal of Arid Meteorology, 38(1): 73-80. (in Chinese)
|
|
|
|
Viewed |
|
|
|
Full text
|
|
|
|
|
Abstract
|
|
|
|
|
Cited |
|
|
|
|
| |
Shared |
|
|
|
|
| |
Discussed |
|
|
|
|