| Research article |
|


|
|
|
| Impact of land use change on carbon storage based on the PLUS-InVEST model: A case study in the urban belt along the Yellow River, China |
SHI Hanqi1,2,3, DUAN Huan'e1,2,3,*( ), LI Xuemei1,2,3, WANG Guigang1,2,3, CHEN Ahui1,2,3, LIANG Dengrui1,2,3 ), LI Xuemei1,2,3, WANG Guigang1,2,3, CHEN Ahui1,2,3, LIANG Dengrui1,2,3 |
1Faculty of Geomatics, Lanzhou Jiaotong University, Lanzhou 730070, China
2National-Local Joint Engineering Research Center of Technologies and Applications for National Geographic State Monitoring, Lanzhou 730070, China
3Key Laboratory of Science and Technology in Surveying & Mapping Gansu Province, Lanzhou 730070, China |
|
|
|
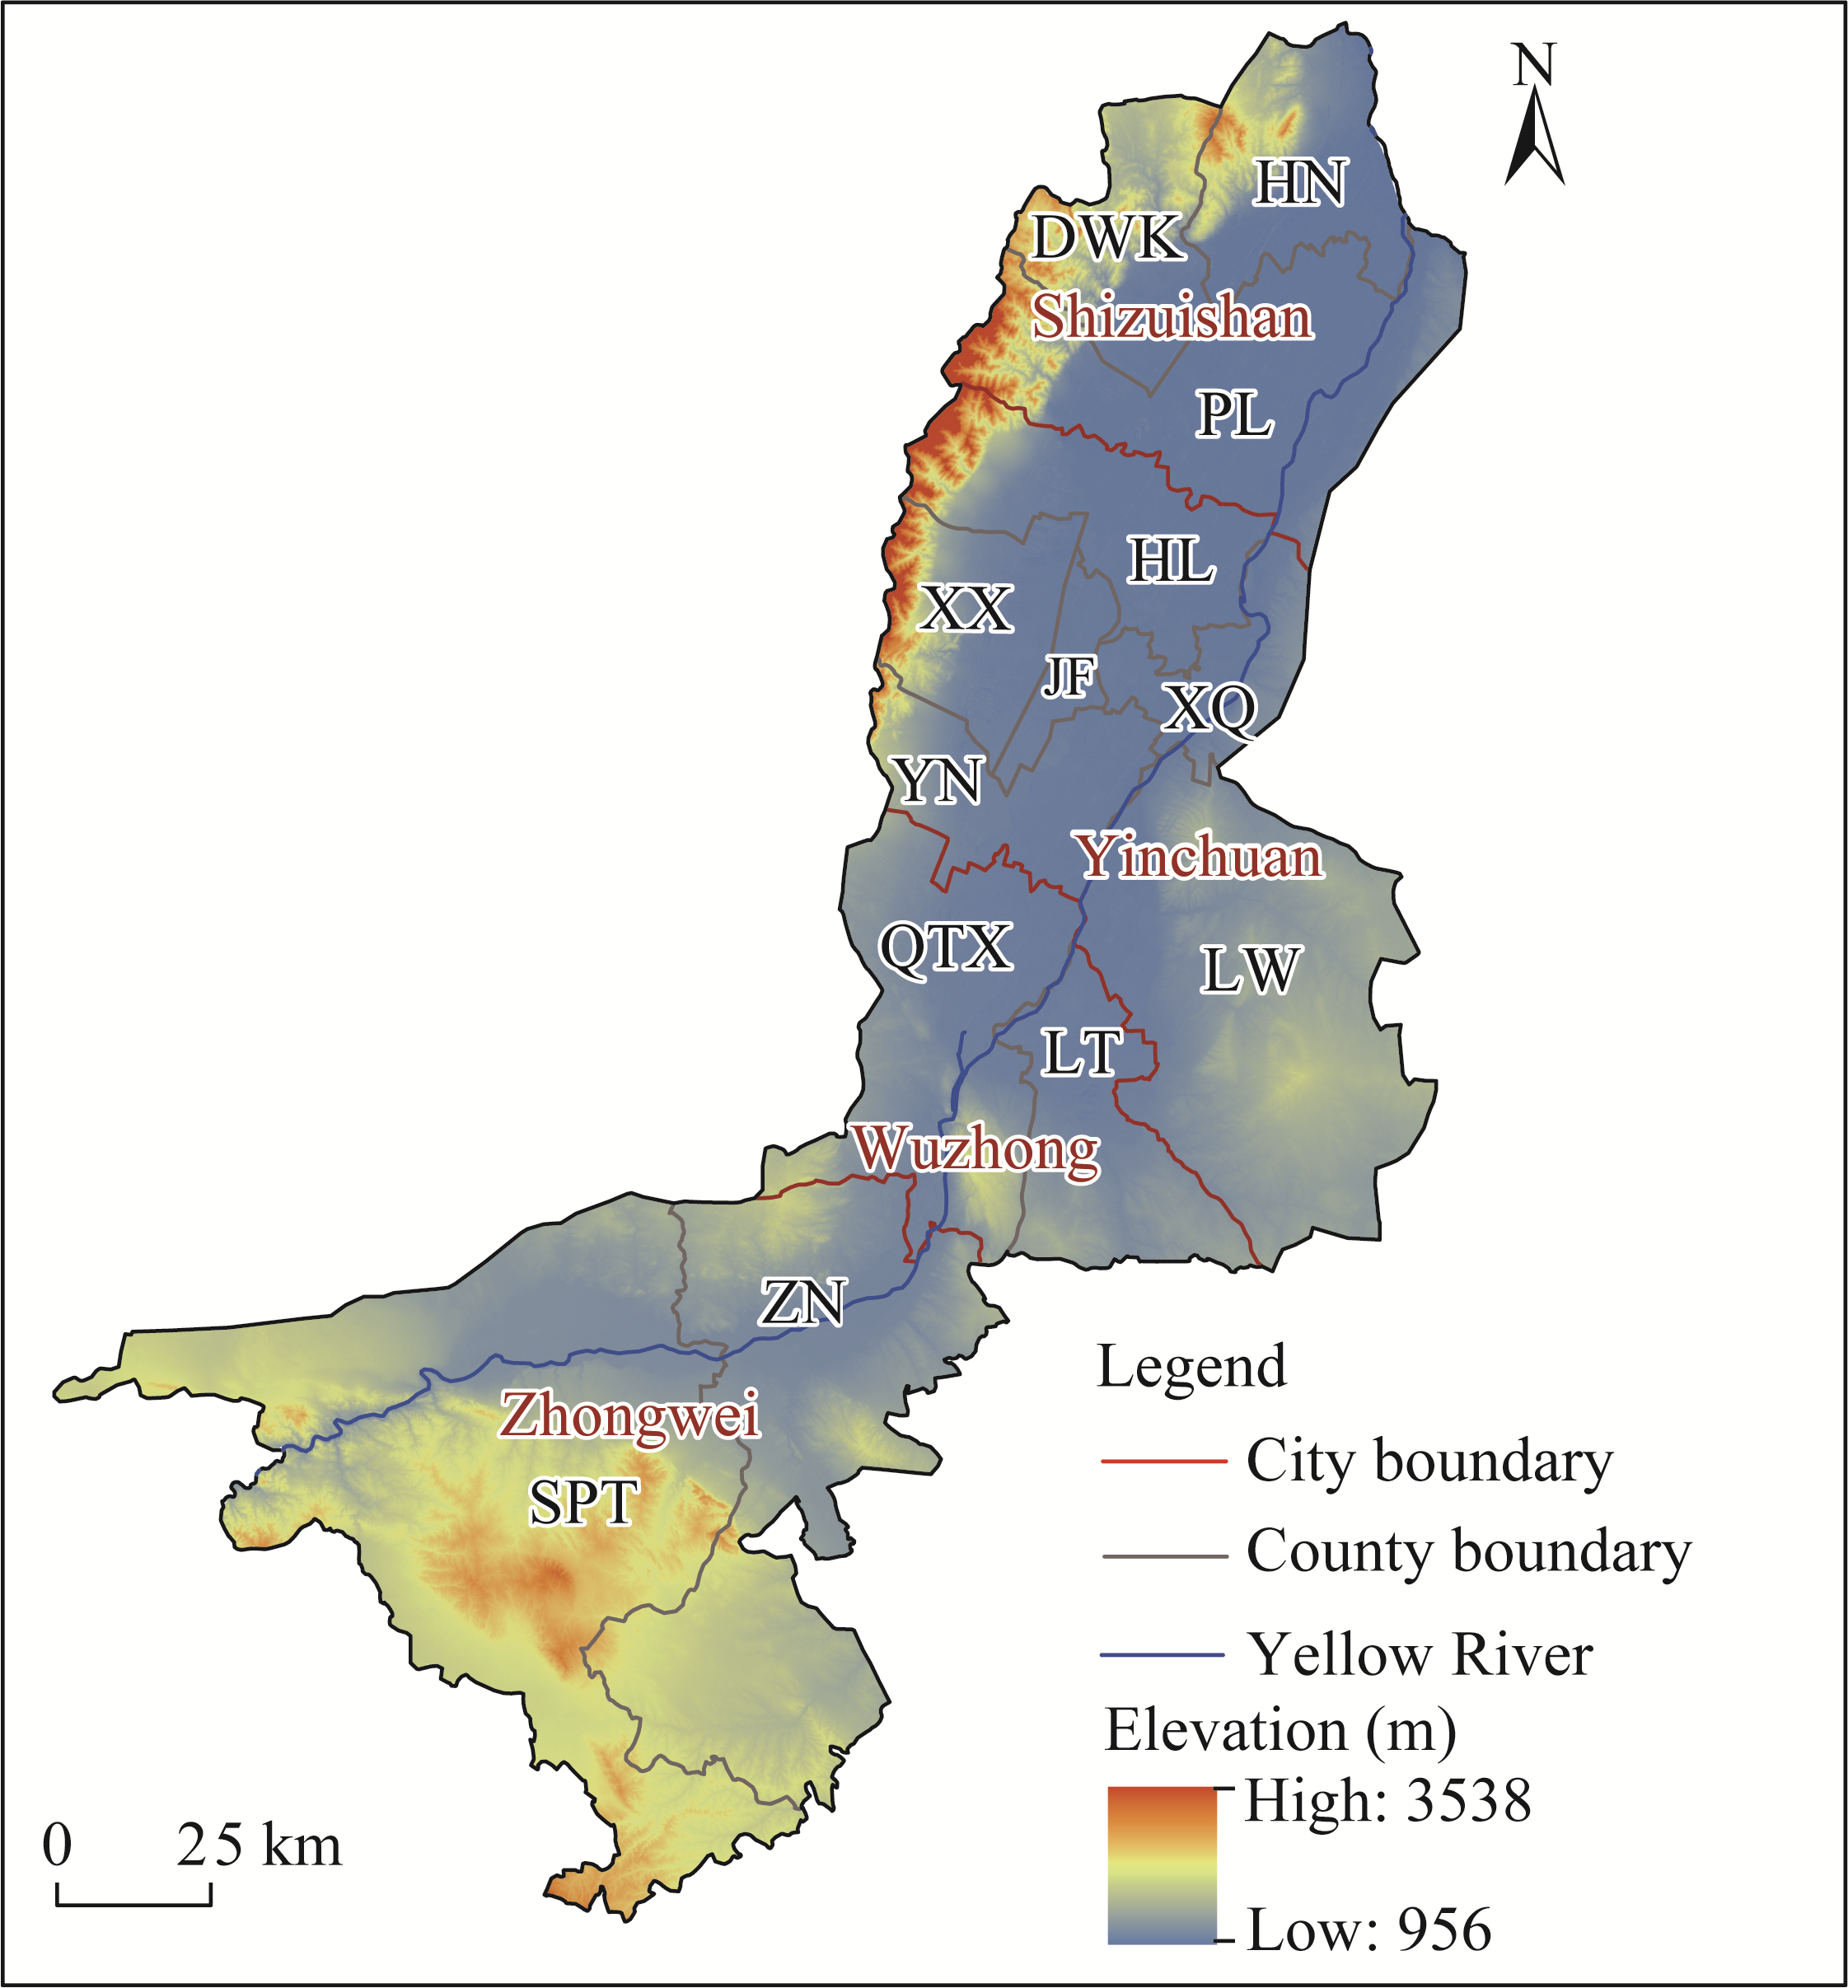
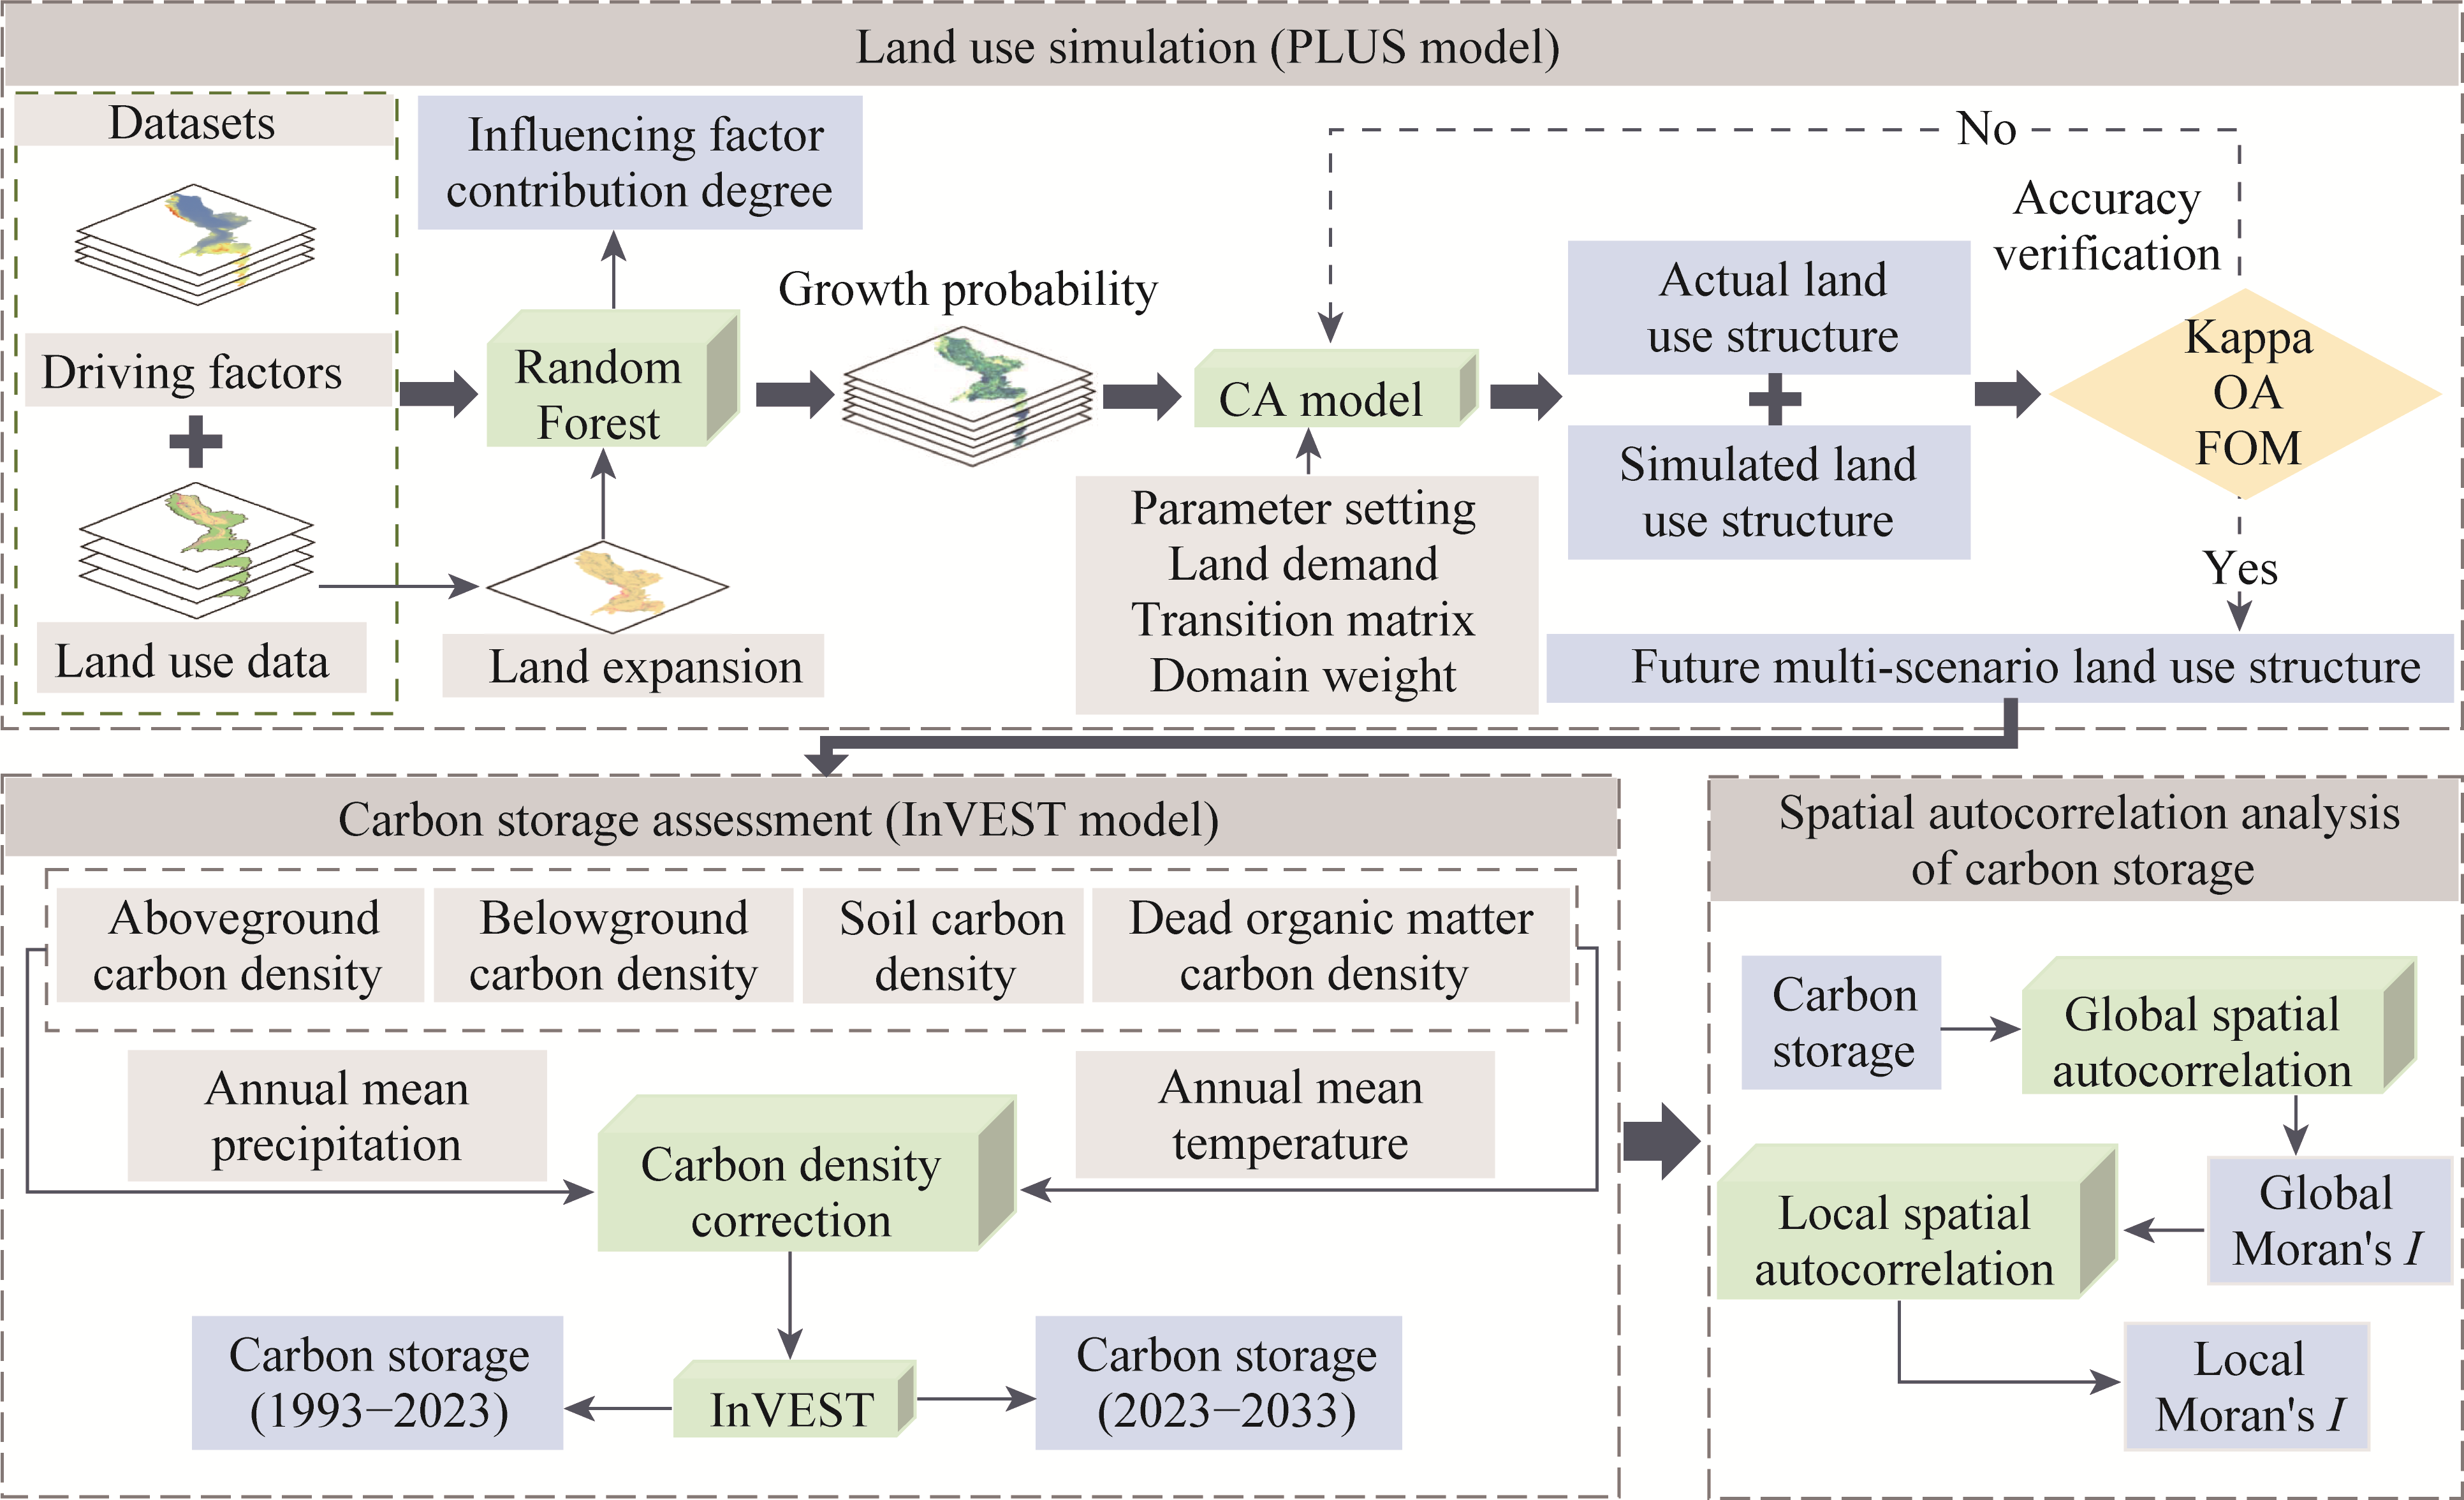
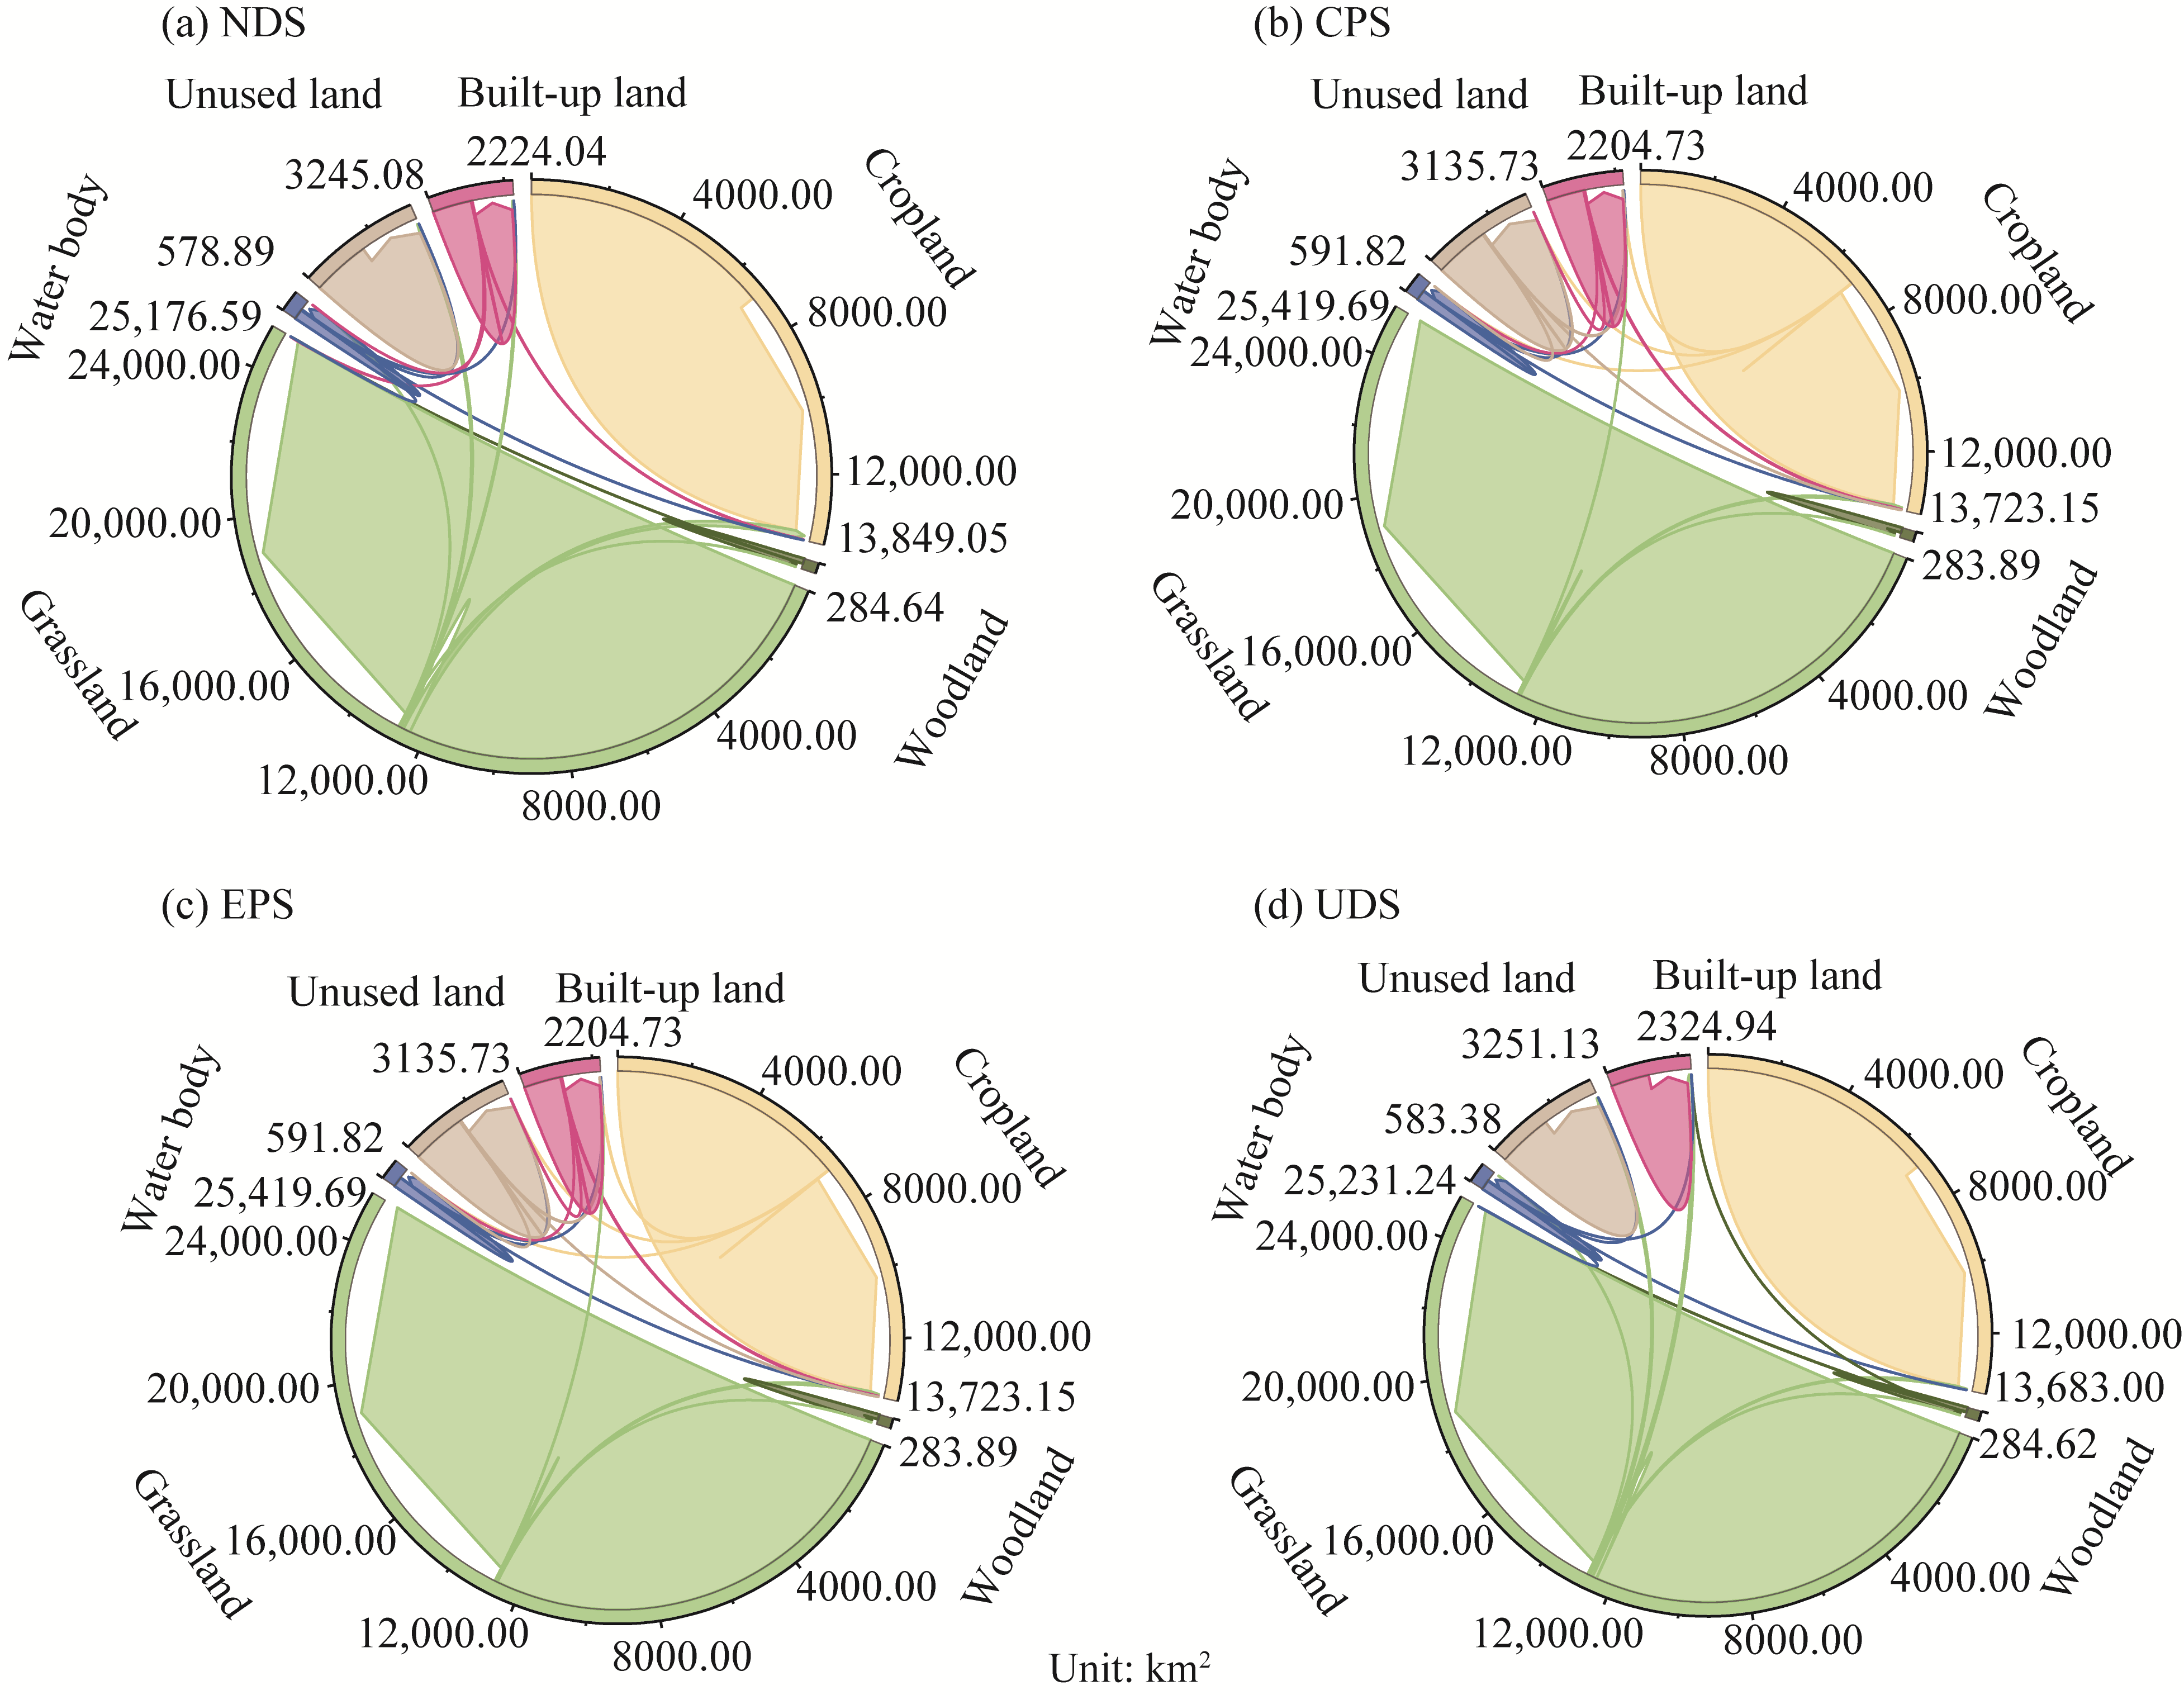
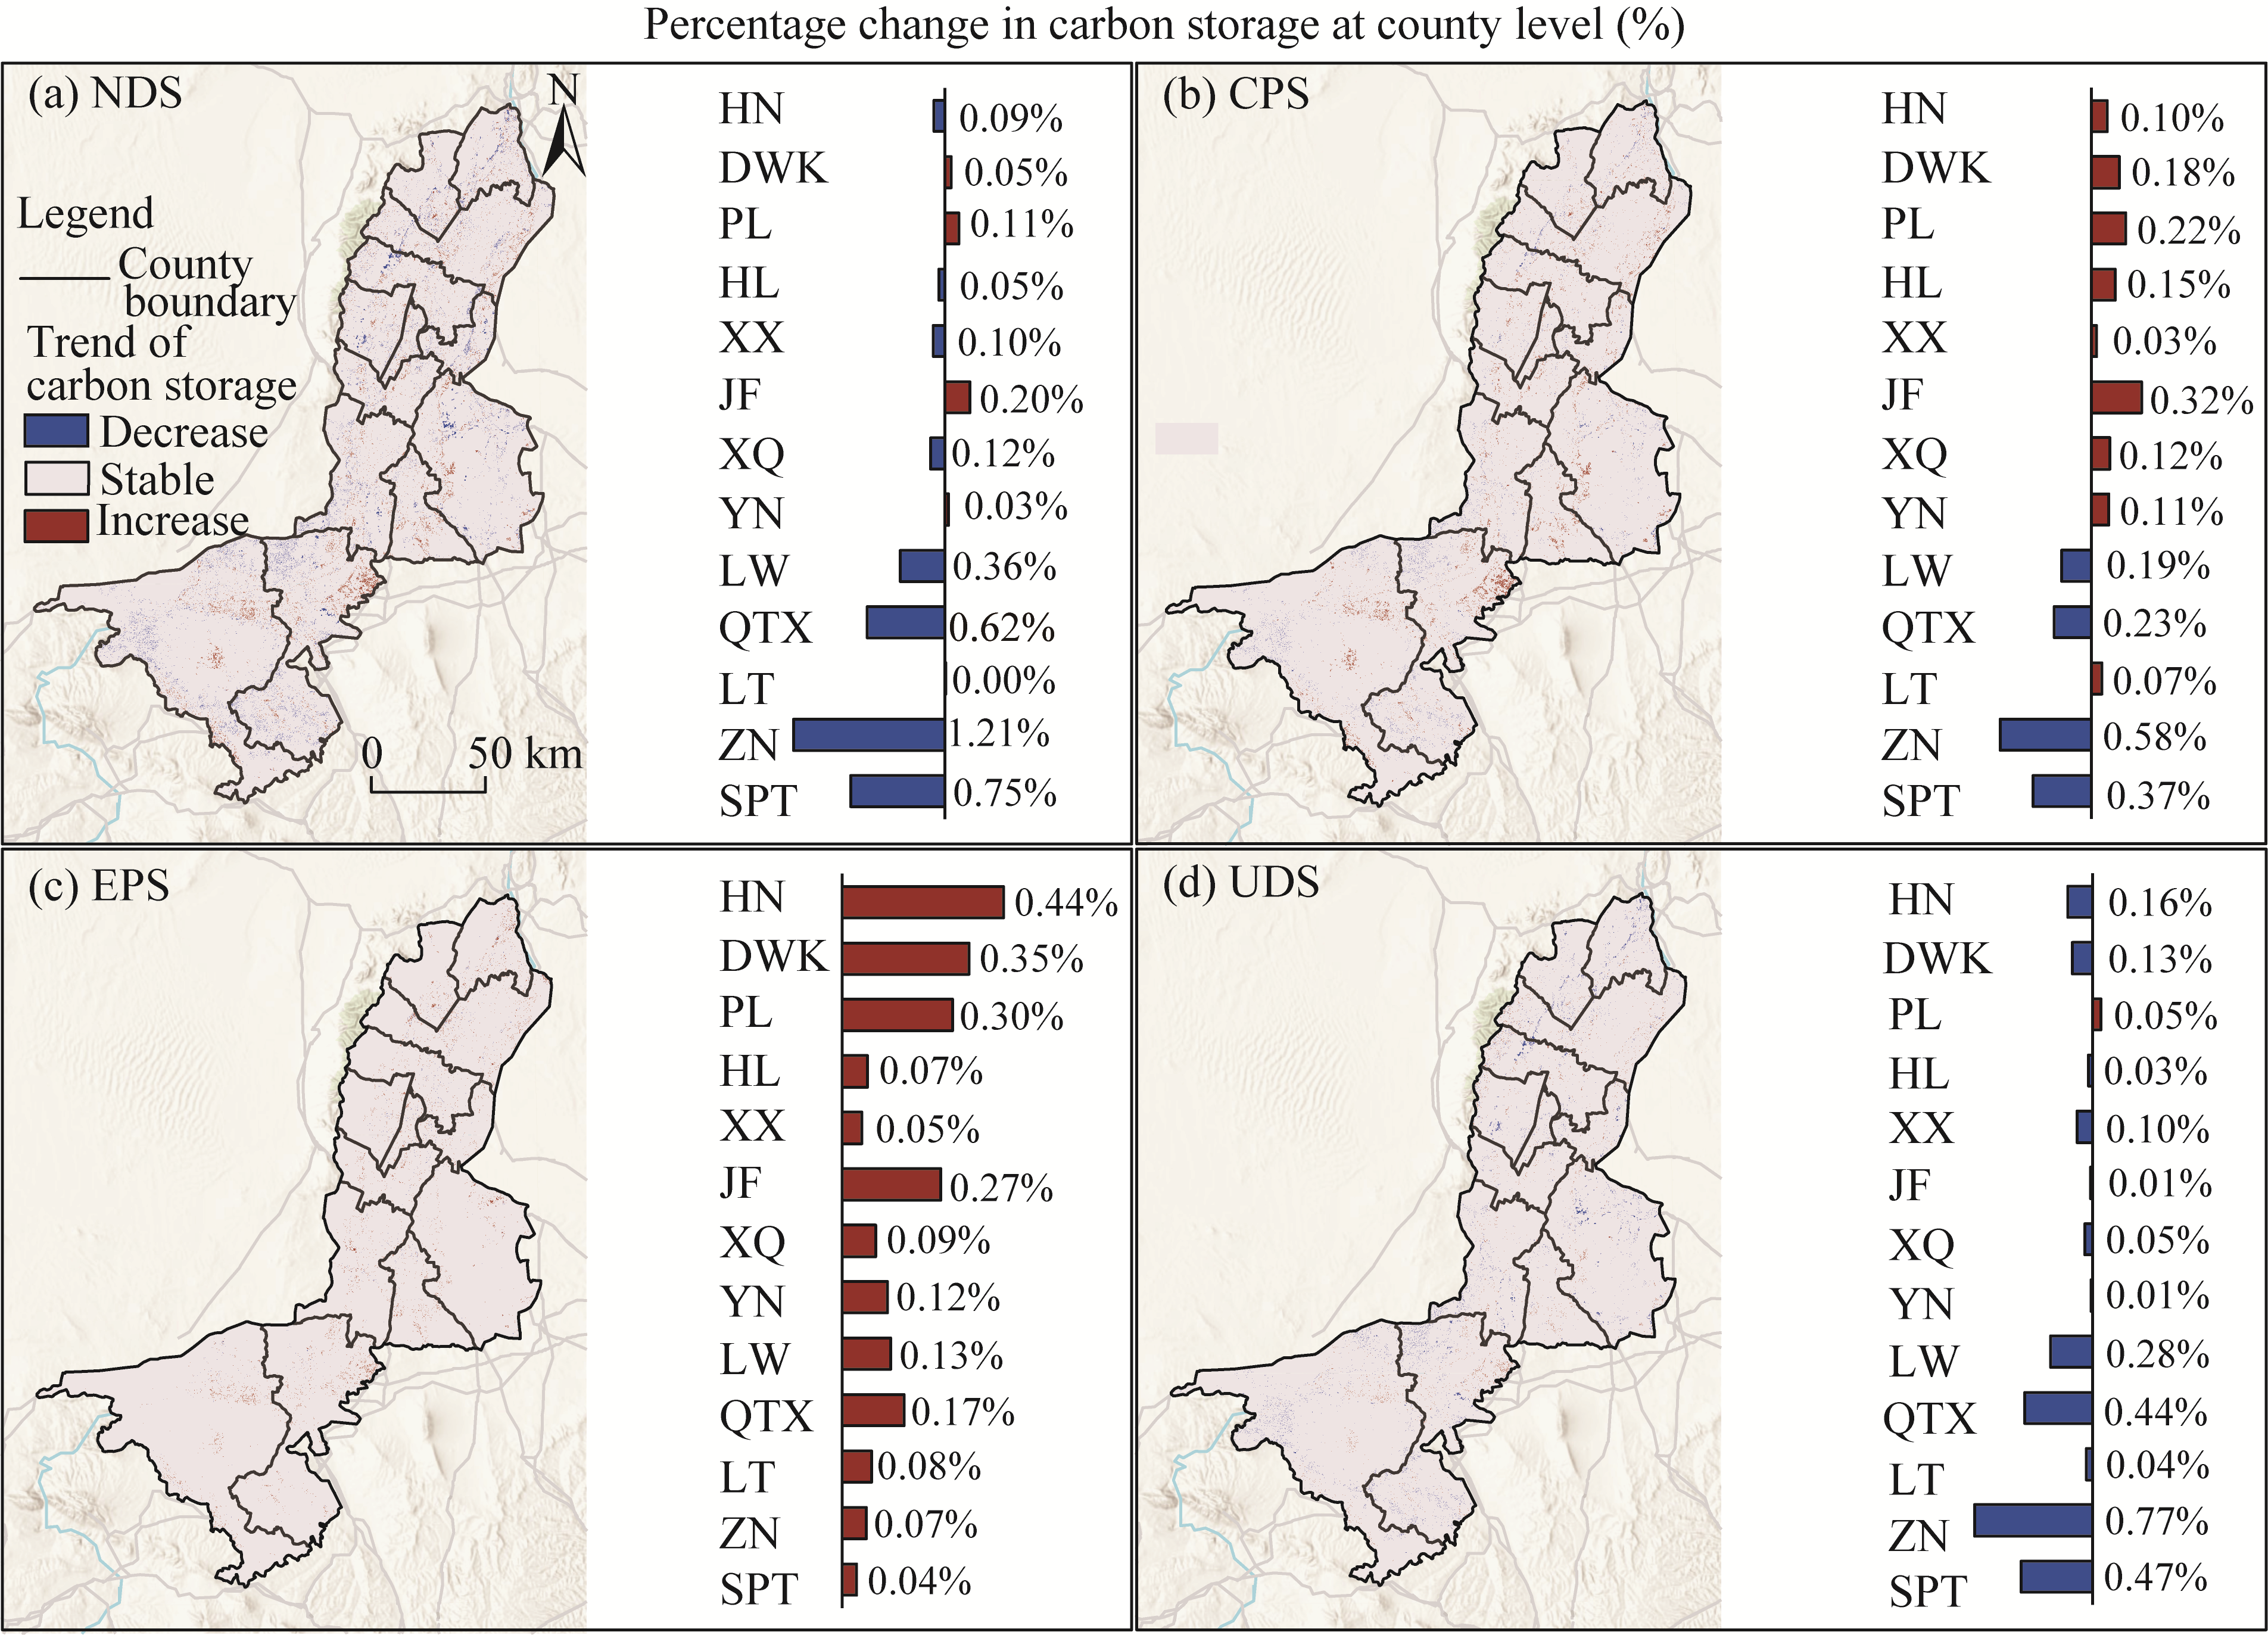
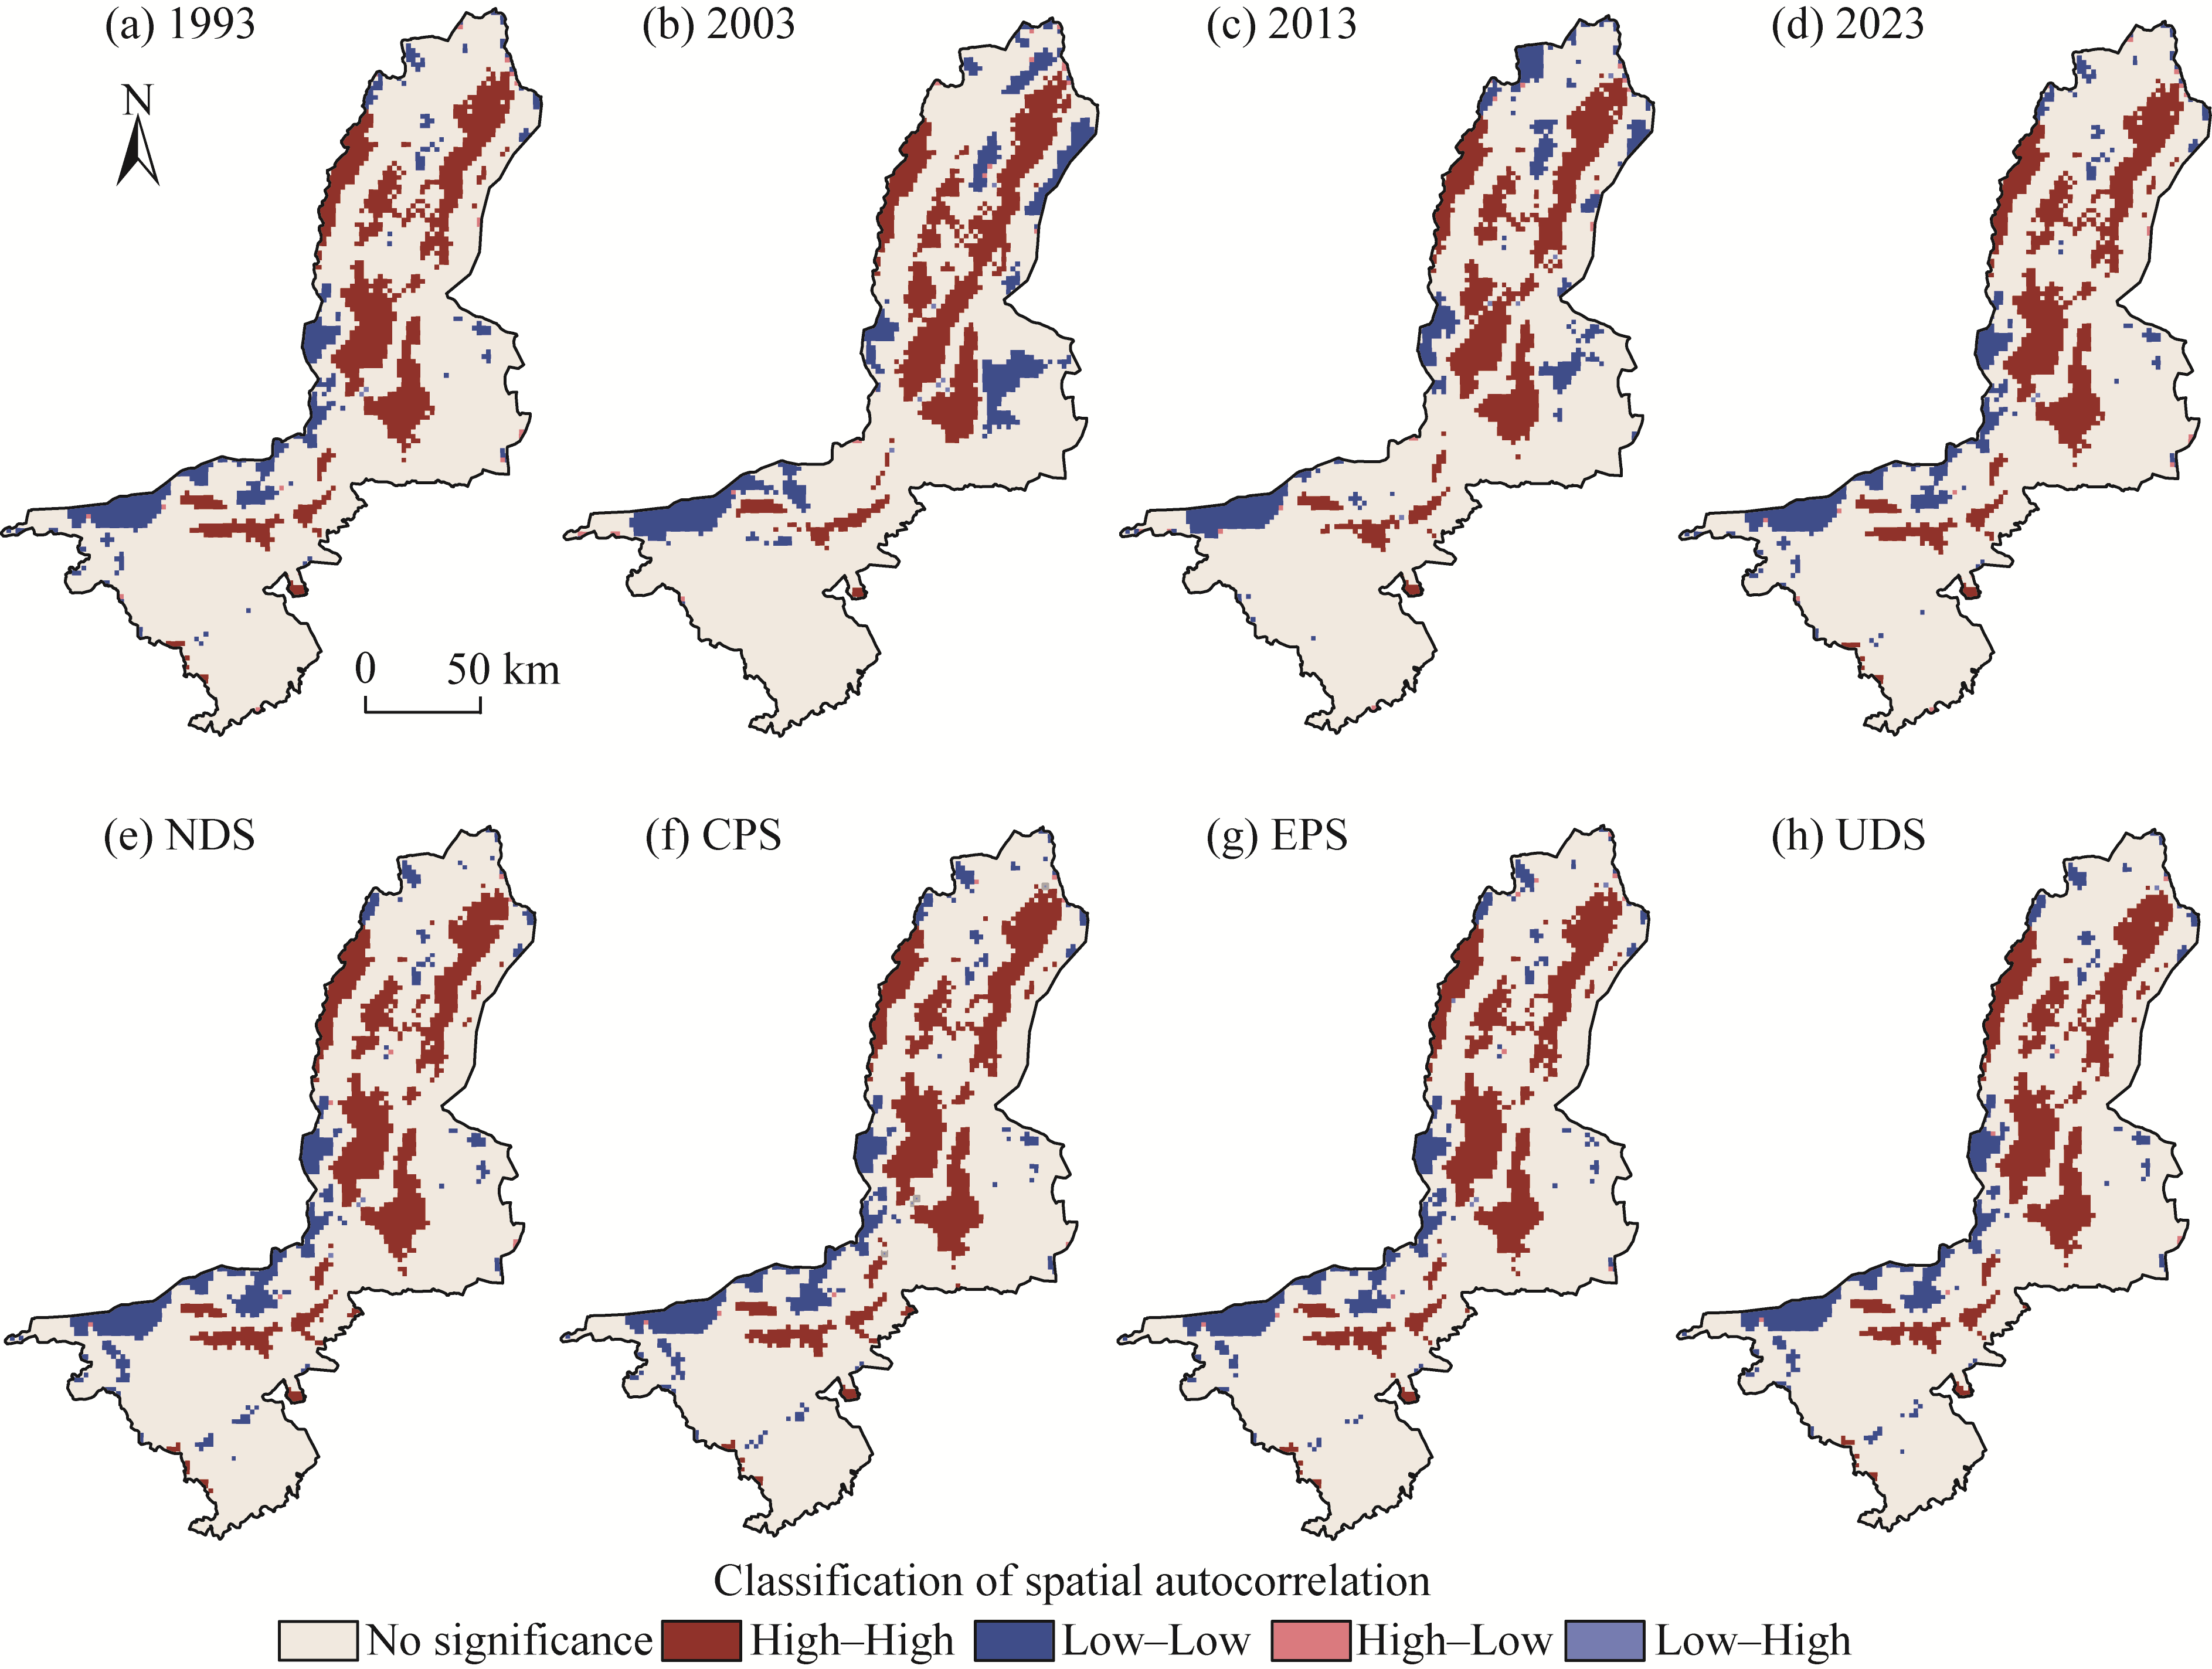
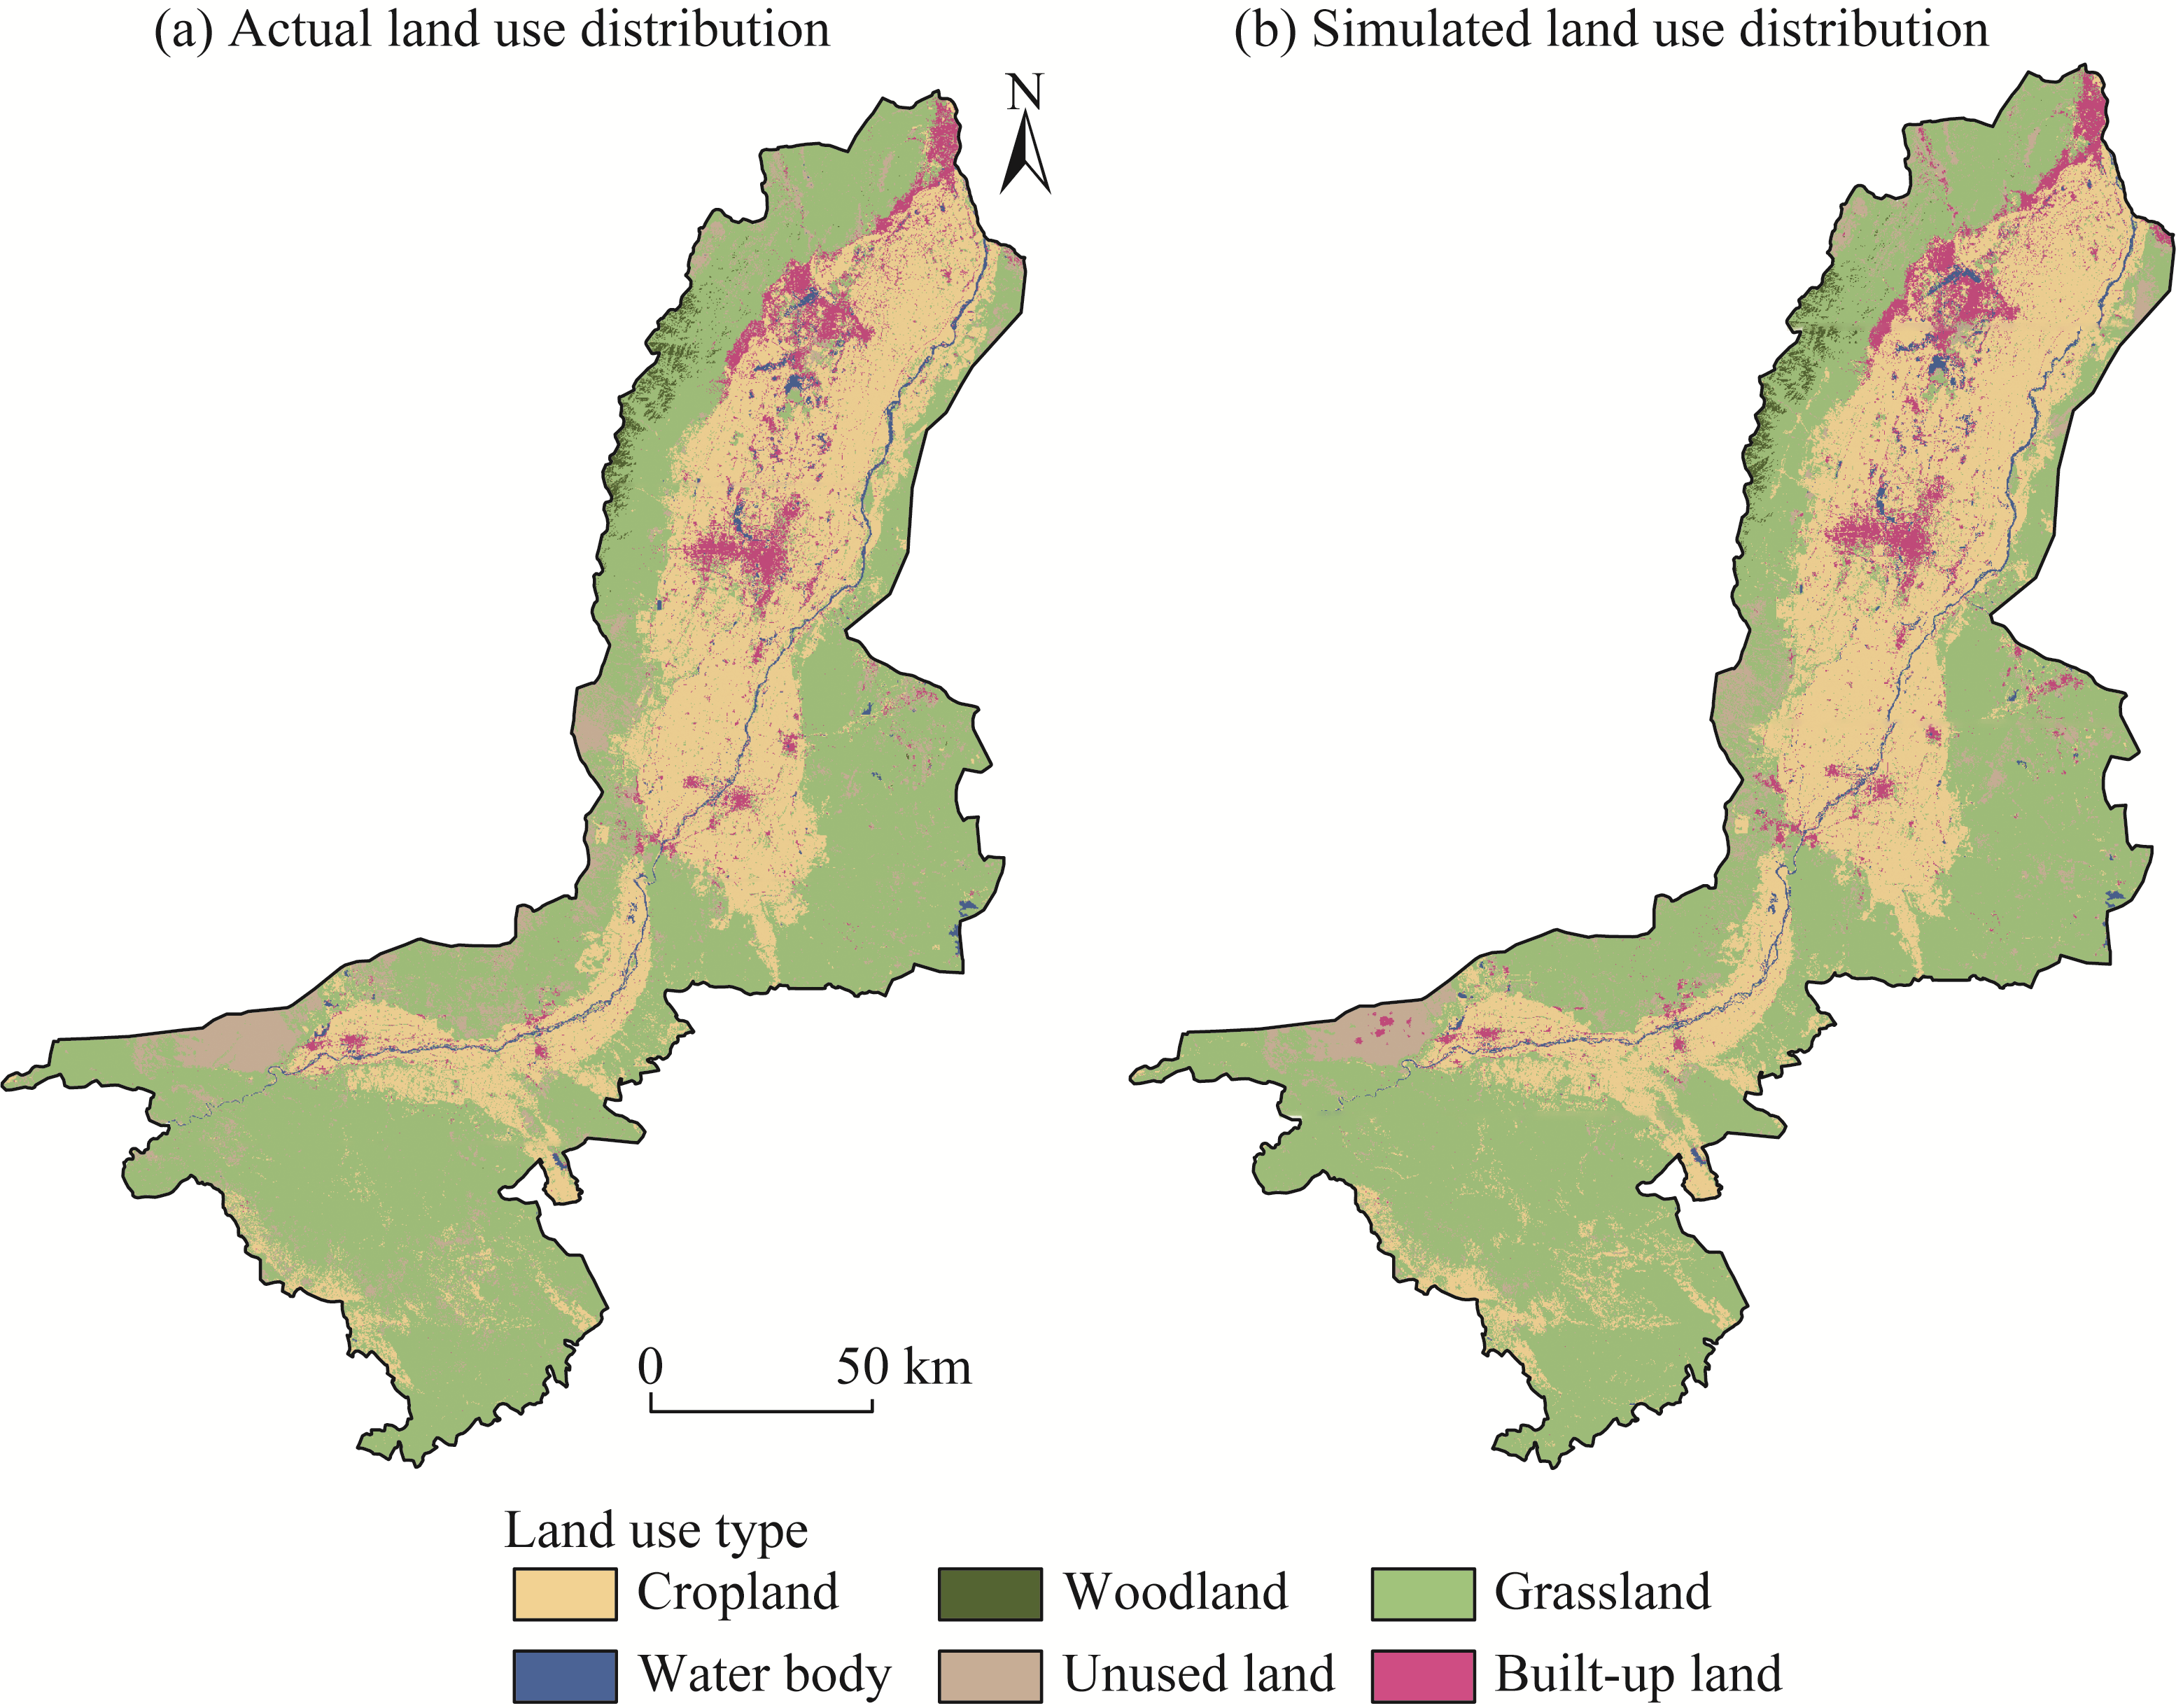
Abstract Terrestrial ecosystems are vital for maintaining equilibrium in the global carbon cycle. Land use and land cover change (LUCC), which is influenced mainly by urbanization and ecological policies, impacts terrestrial ecosystem carbon storage significantly. In this study, spatiotemporal carbon storage changes in the urban belt along the Yellow River in the Ningxia Hui Autonomous Region, China, were estimated through a model that integrated patch-generating land use simulation (PLUS) and integrated valuation of ecosystem services and tradeoffs (InVEST) models from 1993 to 2033. The results revealed that: (1) from 1993 to 2023, the expansion of built-up land and cropland was derived mainly from unused land and grassland, whereas water body and woodland remained relatively stable. Projections to 2033 have indicated that LUCC will continue and be concentrated primarily in the Ningxia Plain; (2) carbon storage increased by a net 5.01×10⁶ Mg C from 1993 to 2023; (3) the spatial distribution of carbon storage revealed that high-value areas were predominantly located in the Helan Mountains and the Ningxia Plain, whereas low-value areas were found in the Tengger Desert; (4) scenario projections indicated that by 2033, the ecological protection scenario (EPS) would achieve a 0.18×10⁶ Mg C increase by reducing the conversion of woodland to cropland and grassland to built-up land, while increasing the conversion of unused land to grassland. In contrast, the natural development scenario (NDS), cropland protection scenario (CPS), and urban development scenario (UDS) decreased carbon storage by 0.60×10⁶, 0.21×10⁶, and 0.42×10⁶ Mg C, respectively; and (5) spatial autocorrelation analysis revealed that high-high carbon storage clusters formed belt-like patterns along the Ningxia Plain and the Helan Mountains, whereas the low-low carbon storage clusters were concentrated in northern Zhongwei City, western Qingtongxia City, western Dawukou District, and the urbanized areas within the central Ningxia Plain. Overall, the study results revealed the close coupling relationship between LUCC and carbon storage functions. Furthermore, the study establishes a framework for carbon management that balances ecological protection with coordinated urban development for the urban belt as well as for similar arid and semi-arid areas. On the basis of these findings, this study provides decision-makers with guidance to optimize ecosystem carbon storage via land use, which plays a key role in developing future land use policies and achieving the ''dual carbon'' goals.
|
|
Received: 24 June 2025
Published: 31 March 2026
|
|
Corresponding Authors:
*DUAN Huan'e (E-mail: duanhuane@mail.lzjtu.cn)
|
|
|
| [1] |
Anindita S, Sleutel S, Vandenberghe D, et al. 2022. Land use impacts on weathering, soil properties, and carbon storage in wet Andosols, Indonesia. Geoderma, 423: 115963, doi: 10.1016/j.geoderma.2022.115963.
|
|
|
| [2] |
Anthony M A, Tedersoo L, De Vos B, et al. 2024. Fungal community composition predicts forest carbon storage at a continental scale. Nature communications, 15(1): 2385, doi: 10.1038/s41467-024-46792-w.
|
|
|
| [3] |
Aryal D R, Ruiz-Corzo R. 2020. Carbon accumulations by stock change approach in tropical highland forests of Chiapas, Mexico. Journal of Forestry Research, 31(6): 2479-2493.
doi: 10.1007/s11676-019-01012-w
|
|
|
| [4] |
Bai Y F, Cotrufo M F. 2022. Grassland soil carbon sequestration: Current understanding, challenges, and solutions. Science, 377(6606): 603-608.
doi: 10.1126/science.abo2380
pmid: 35926033
|
|
|
| [5] |
Bie Q, Huang C L. 2025. Land use/cover changes lead to a decrease in carbon storage in arid regions-a case study of Northwest China. Science of the Total Environment, 992: 179993, doi: 10.1016/j.scitotenv.2025.179993.
|
|
|
| [6] |
Bu X Y, Dong S C, Mi W B, et al. 2019. Spatial-temporal change of carbon storage and sink of wetland ecosystem in arid regions, Ningxia Plain. Atmospheric Environment, 204: 89-101.
doi: 10.1016/j.atmosenv.2019.02.019
|
|
|
| [7] |
Chang X Q, Xing Y Q, Wang J Q, et al. 2022. Effects of land use and cover change (LUCC) on terrestrial carbon stocks in China between 2000 and 2018. Resources, Conservation and Recycling, 182: 106333, doi: 10.1016/j.resconrec.2022.106333.
|
|
|
| [8] |
Chen C, Liang J T, Zhang W W. 2025. Quantifying dynamics of ecosystem carbon storage under influence of land use and land cover change in coastal zone from remote sensing perspective. Sustainable Horizons, 14: 100146, doi: 10.1016/j.horiz.2025. 100146.
|
|
|
| [9] |
Ding J M, Wang W Z, Mi W B, et al. 2023. Spatial characteristics of soil organic carbon in grassland of Ningxia and its influencing factors. Acta Ecologica Sinica, 43: 1913-1922. (in Chinese)
|
|
|
| [10] |
Feng Z Y, Xing W Q, Wang W G, et al. 2024. Assessing the spatiotemporal dynamics of water and carbon fluxes in subtropical forest of Xin'an River Basin using an improved Biome-BGC model. Journal of Hydrology, 635: 131201, doi: 10.1016/j. jhydrol.2024.131201.
|
|
|
| [11] |
Gao M N, Xu R H, Huang J L, et al. 2023. Increase of carbon storage in the Qinghai-Tibet Plateau: Perspective from land-use change under global warming. Journal of Cleaner Production, 414: 137540, doi: 10.1016/j.jclepro.2023.137540.
|
|
|
| [12] |
Gao X, Huang P T, Wang K. 2019. Assessment of the ecosystem stability of Shapotou arid desert nature reserve in Ningxia, China. Acta Ecologica Sinica, 39(17): 6381-6392. (in Chinese)
|
|
|
| [13] |
García-Alonso C R, Arenas-Arroyo E, Pérez-Alcalá G M. 2012. A macro-economic model to forecast remittances based on Monte-Carlo simulation and artificial intelligence. Expert Systems with Applications, 39(9): 7929-7937.
doi: 10.1016/j.eswa.2012.01.108
|
|
|
| [14] |
Golchin A, Misaghi M. 2024. Investigating the effects of climate change and anthropogenic activities on SOC storage and cumulative CO2 emissions in forest soils across altitudinal gradients using the century model. Science of the Total Environment, 943: 173758, doi: 10.1016/j.scitotenv.2024.173758.
|
|
|
| [15] |
Han H Y, Ding J L, Wang J J, et al. 2025. Assessing carbon storage in Xinjiang's arid grassland Ecosystems: Insights from Process-Based modeling. CATENA, 249: 108711, doi: 10.1016/j.catena.2025.108711.
|
|
|
| [16] |
Houghton R A, Hackler J L. 1999. Emissions of carbon from forestry and land-use change in tropical Asia. Global Change Biology, 5(4): 481-492.
doi: 10.1046/j.1365-2486.1999.00244.x
|
|
|
| [17] |
Hu X, Dong C, Zhang Y. 2024. Impacts of cropland utilization patterns on the sustainable use efficiency of cropland based on the human-land perspective. Land, 13(6): 863, doi: 10.3390/land13060863.
|
|
|
| [18] |
Huang H, Zhang W J, Li J, et al. 2020. Application of Monte Carlo and Markov methods for precipitation prediction. Yellow River, 42(5): 19-23.
|
|
|
| [19] |
Kuai Y, Wang C M, Dou X M, et al. 2025. Multiscale modeling of shrub biomass and analysis of carbon pool characteristics in arid and semi-arid regions: A case study of the Hubq Desert, Inner Mongolia of northern China. Journal of Beijing Forestry University, 47(4): 50-60. (in Chinese)
|
|
|
| [20] |
Lai J L, Qi S, Chen J D, et al. 2025. Exploring the spatiotemporal variation of carbon storage on Hainan Island and its driving factors: Insights from InVEST, FLUS models, and machine learning. Ecological Indicators, 172: 113236, doi: 10.1016/j. ecolind.2025.113236.
|
|
|
| [21] |
Lempert R J. 2021. Measuring global climate risk. Nature Climate Change, 11(10): 805-806.
doi: 10.1038/s41558-021-01165-9
|
|
|
| [22] |
Li C H, Ma C H, An S W, et al. 2025a. Simulating the response of ecosystem services to the changes in production-living- ecological land use under different scenarios in the ecological economic belt along the Yellow River in Ningxia Hui Autonomous Region. Remote Sensing for Natural Resources, 37(2): 155-163. (in Chinese)
|
|
|
| [23] |
Li D J, Xu D Y. 2019. Sand fixation function response to climate change and land use in northern China from 1981 to 2015. Aeolian Research, 40: 23-33.
doi: 10.1016/j.aeolia.2019.05.002
|
|
|
| [24] |
Li H J, Zhang K, Liu Y Q, et al. 2025b. Spatiotemporal evolution of land use and carbon storage in China: Multi-scenario simulation and driving factor analysis based on the PLUS-InVEST model and SHAP. Environmental Research, 297(2): 121860, doi: 10.1016/j.envres.2025.121860.
|
|
|
| [25] |
Li J T, Dong H R, Li S X. 2024. Economic development and optimal allocation of land use in ecological emigration area in China. Land Use Policy, 142: 107178, doi: 10.1016/j.landusepol.2024.107178.
|
|
|
| [26] |
Li M, Wu D L, He H, et al. 2025c. Spatio-temporal evolution and driving factors of carbon storage in the Yellow River Basin from 1990 to 2020. Ecology and Environmental Sciences, 34(3): 333-344. (in Chinese)
|
|
|
| [27] |
Li S, Gu Y W, Chen J P, et al. 2016. Spatio-temporal dynamical changes of land use in Ningxia Yellow River valley. Journal of Southwest University (Natural Science Edition), 38(4): 42-49. (in Chinese)
|
|
|
| [28] |
Li X B, Lyu X, Dou H S, et al. 2021. Strengthening grazing pressure management to improve grassland ecosystem services. Global Ecology and Conservation, 31: e01782, doi: 10.1016/j.gecco.2021.e01782.
|
|
|
| [29] |
Li Y X, Liu Z S, Li S J, et al. 2022. Multi-scenario simulation analysis of land use and carbon storage changes in Changchun city based on FLUS and InVEST model. Land, 11(5): 647, doi: 10.3390/land11050647.
|
|
|
| [30] |
Liang X, Guan Q F, Clarke K C, et al. 2021a. Understanding the drivers of sustainable land expansion using a patch-generating land use simulation (PLUS) model: A case study in Wuhan, China. Computers, Environment and Urban Systems, 85: 101569, doi: 10.1016/j.compenvurbsys.2020.101569.
|
|
|
| [31] |
Liang Y J, Hashimoto S, Liu L J. 2021b. Integrated assessment of land-use/land-cover dynamics on carbon storage services in the Loess Plateau of China from 1995 to 2050. Ecological Indicators, 120: 106939, doi: 10.1016/j.ecolind.2020.106939.
|
|
|
| [32] |
Lin Y M, Hu Z R, Li W H, et al. 2024. Response of ecosystem carbon storage to land use change from 1985 to 2050 in the Ningxia Section of Yellow River Basin, China. Journal of Arid Land, 16(1): 110-130.
doi: 10.1007/s40333-024-0052-9
|
|
|
| [33] |
Liu J M, Pei X T, Yu W J, et al. 2024a. How much carbon storage will loss in a desertification area? Multiple policy scenario analysis from Gansu Province. Science of the Total Environment, 913: 169668, doi: 10.1016/j.scitotenv.2023.169668.
|
|
|
| [34] |
Liu L L, Sayer E J, Deng M F, et al. 2023a. The grassland carbon cycle: Mechanisms, responses to global changes, and potential contribution to carbon neutrality. Fundamental Research, 3(2): 209-218.
doi: 10.1016/j.fmre.2022.09.028
|
|
|
| [35] |
Liu S R, Wang H, Li H K, et al. 2024b. Projections of China's forest carbon storage and sequestration and ways of their potential capacity enhancement. Scientia Silvae Sinicae, 60(4): 157-172. (in Chinese)
|
|
|
| [36] |
Liu X W, Zhang R P, Guo J, et al. 2025. Analysis of the spatiotemporal dynamics of grassland carbon sinks in Xinjiang via the improved CASA model. Ecological Indicators, 170: 113062, doi: 10.1016/j.ecolind.2024.113062.
|
|
|
| [37] |
Liu Y, Trancoso R, Ma Q, et al. 2023b. Carbon density in boreal forests responds non-linearly to temperature: An example from the Greater Khingan Mountains, northeast China. Agricultural and Forest Meteorology, 338: 109519, doi: 10.1016/j. agrformet.2023.109519.
|
|
|
| [38] |
Lyu R F, Clarke K C, Zhang J M, et al. 2019. Spatial correlations among ecosystem services and their socio-ecological driving factors: A case study in the city belt along the Yellow River in Ningxia, China. Applied Geography, 108: 64-73.
doi: 10.1016/j.apgeog.2019.05.003
|
|
|
| [39] |
Ma J K, Hao Z X, Shen Y Q, et al. 2025. Spatial-temporal evolution of carbon storage and its driving factors in the Shanxi section of the Yellow River Basin, China. Ecological Modelling, 502: 111039, doi: 10.1016/j.ecolmodel.2025.111039.
|
|
|
| [40] |
Ma Y Q, Huang L, Li J H, et al. 2024. Carbon potential of China's Grain to Green Program and its contribution to the carbon target. Resources, Conservation and Recycling, 200: 107272, doi: 10.1016/j.resconrec.2023.107272.
|
|
|
| [41] |
Mitsova D, Shuster W, Wang X H. 2011. A cellular automata model of land cover change to integrate urban growth with open space conservation. Landscape and Urban Planning, 99(2): 141-153.
doi: 10.1016/j.landurbplan.2010.10.001
|
|
|
| [42] |
Mohammadyari F, Pourkhabbaz H, Tavakoli M, et al. 2021. Integration of neural network, Markov chain and CA Markov models to simulate land use change region of Behbahan. Journal of Research and Rural Planning, 10(3): 81-95.
|
|
|
| [43] |
Nelson E, Mendoza G, Regetz J, et al. 2009. Modeling multiple ecosystem services, biodiversity conservation, commodity production, and tradeoffs at landscape scales. Frontiers in Ecology and the Environment, 7(1): 4-11.
doi: 10.1890/080023
|
|
|
| [44] |
Piao S L, He Y, Wang X H, et al. 2022. Estimation of China's terrestrial ecosystem carbon sink: Methods, progress and prospects. Science China Earth Sciences, 65(4): 641-651.
doi: 10.1007/s11430-021-9892-6
|
|
|
| [45] |
Ran Y J, Zhao X Q, Ye X M, et al. 2024. A framework for territorial spatial ecological restoration zoning integrating ''Carbon neutrality'' and ''Human-geology-ecology'': Theory and application. Sustainable Cities and Society, 115: 105824, doi: 10.1016/j.scs.2024.105824.
|
|
|
| [46] |
Ren W, Banger K, Tao B, et al. 2020. Global pattern and change of cropland soil organic carbon during 1901-2010: Roles of climate, atmospheric chemistry, land use and management. Geography and Sustainability, 1(1): 59-69.
doi: 10.1016/j.geosus.2020.03.001
|
|
|
| [47] |
Roebroek C T, Caporaso L, Alkama R, et al. 2024. Climate policies for carbon neutrality should not rely on the uncertain increase of carbon stocks in existing forests. Environmental Research Letters, 19(4): 044050, doi: 10.1088/1748-9326/ ad34e8.
|
|
|
| [48] |
Roy S, Singha N, Bose A, et al. 2023. Multi-influencing factor (MIF) and RS-GIS-based determination of agriculture site suitability for achieving sustainable development of Sub-Himalayan region, India. Environment, Development and Sustainability, 25(7): 7101-7133.
doi: 10.1007/s10668-022-02360-0
|
|
|
| [49] |
Shi X L, Zhang J, Liu S M, et al. 2025. Impact of land use change on carbon storage in the middle reaches of the Yellow River, China. Journal of Arid Land, 17(2): 167-181.
doi: 10.1007/s40333-025-0007-9
|
|
|
| [50] |
Song C, Yu Q Y, Wang R X, et al. 2021. Spatio-temporal variation of windbreak and sand fixation functions based on vegetation coverage in Baijitan National Nature Reserve, Ningxia. Acta Ecologica Sinica, 41(8): 3131-3143. (in Chinese)
|
|
|
| [51] |
Speak A, Escobedo F J, Russo A, et al. 2020. Total urban tree carbon storage and waste management emissions estimated using a combination of LiDAR, field measurements and an end-of-life wood approach. Journal of Cleaner Production, 256: 120420, doi: 10.1016/j.jclepro.2020.120420.
|
|
|
| [52] |
Tang X L, Zhao X, Bai Y F, et al. 2018. Carbon pools in China's terrestrial ecosystems: New estimates based on an intensive field survey. Proceedings of the National Academy of Sciences, 115(16): 4021-4026.
|
|
|
| [53] |
Tong J H, Hu J H, Lu Z, et al. 2019. The impact of land use and cover change on soil organic carbon and total nitrogen storage in the Heihe River Basin: A meta-analysis. Journal of Geographical Sciences, 29: 1578-1594.
doi: 10.1007/s11442-019-1678-y
|
|
|
| [54] |
Verburg P H, Overmars K P. 2009. Combining top-down and bottom-up dynamics in land use modeling: Exploring the future of abandoned farmlands in Europe with the Dyna-CLUE model. Landscape Ecology, 24: 1167-1181.
doi: 10.1007/s10980-009-9355-7
|
|
|
| [55] |
Verburg P H, Soepboer W, Veldkamp A, et al. 2002. Modeling the spatial dynamics of regional land use: The CLUE-S model. Environmental Management, 30(3): 391-405.
pmid: 12148073
|
|
|
| [56] |
Wang C H, Wang Z H. 2017. Projecting population growth as a dynamic measure of regional urban warming. Sustainable Cities and Society, 32: 357-365.
doi: 10.1016/j.scs.2017.04.010
|
|
|
| [57] |
Wang H Y, Wu L S, Yue Y S, et al. 2024a. Impacts of climate and land use change on terrestrial carbon storage: A multi-scenario case study in the Yellow River Basin (1992-2050). Science of the Total Environment, 930: 172557, doi: 10.1016/j.scitotenv. 2024.172557.
|
|
|
| [58] |
Wang W L, Yu H L, Tong X L, et al. 2024b. Estimating terrestrial ecosystem carbon storage change in the YREB caused by land-use change under SSP-RCPs scenarios. Journal of Cleaner Production, 469: 143205, doi: 10.1016/j.jclepro.2024.143205.
|
|
|
| [59] |
Wu Q, Wang L, Wang T Y, et al. 2024. Spatial-temporal evolution analysis of multi-scenario land use and carbon storage based on PLUS-InVEST model: A case study in Dalian, China. Ecological Indicators, 166: 112448, doi: 10.1016/j.ecolind.2024. 112448.
|
|
|
| [60] |
Xu C L, Zhang Q B, Yu Q, et al. 2023. Effects of land use/cover change on carbon storage between 2000 and 2040 in the Yellow River Basin, China. Ecological Indicators, 151: 110345, doi: 10.1016/j.ecolind.2023.110345.
|
|
|
| [61] |
Xu M Y, Zhang Z Y, Yue C, et al. 2024. Contributions of China's terrestrial ecosystem carbon uptakes to offsetting CO2 emissions under different scenarios over 2001-2060. Global and Planetary Change, 238: 104485, doi: 10.1016/j.gloplacha.2024.104485.
|
|
|
| [62] |
Yu Z L, Zhao M S, Gao Y F, et al. 2023. Multiscenario simulation and prediction of land use in Huaibei city based on CLUE-S and PLUS models. Applied Sciences, 13(12): 7142, doi: 10.3390/app13127142.
|
|
|
| [63] |
Zang J, Li Q, Yu Q, et al. 2025. Study on the relationship between topological characteristics of vegetation ecospatial network and sand fixation function in the Mongolian Plateau. Kuwait Journal of Science, 52(3): 100411, doi: 10.1016/j.kjs.2025.100411.
|
|
|
|
Viewed |
|
|
|
Full text
|
|
|
|
|
Abstract
|
|
|
|
|
Cited |
|
|
|
|
| |
Shared |
|
|
|
|
| |
Discussed |
|
|
|
|