| Research article |
|


|
|
|
| Impact of climate and human activity on NDVI of various vegetation types in the Three-River Source Region, China |
LU Qing1,2,3,4, KANG Haili3, ZHANG Fuqing3, XIA Yuanping3, YAN Bing5,*( ) ) |
1Research Center of Resource and Environment Economics, East China University of Technology, Nanchang 330013, China
2Jiangxi Key Laboratory of Watershed Ecological Process and Information, East China University of Technology, Nanchang 330013, China
3School of Surveying and Geoinformation Engineering, East China University of Technology, Nanchang 330013, China
4Nanchang Key Laboratory of Landscape Process and Territorial Spatial Ecological Restoration, East China University of Technology, Nanchang 330013, China
5Institute of Energy Research, Jiangxi Academy of Sciences, Nanchang 330096, China |
|
|
|
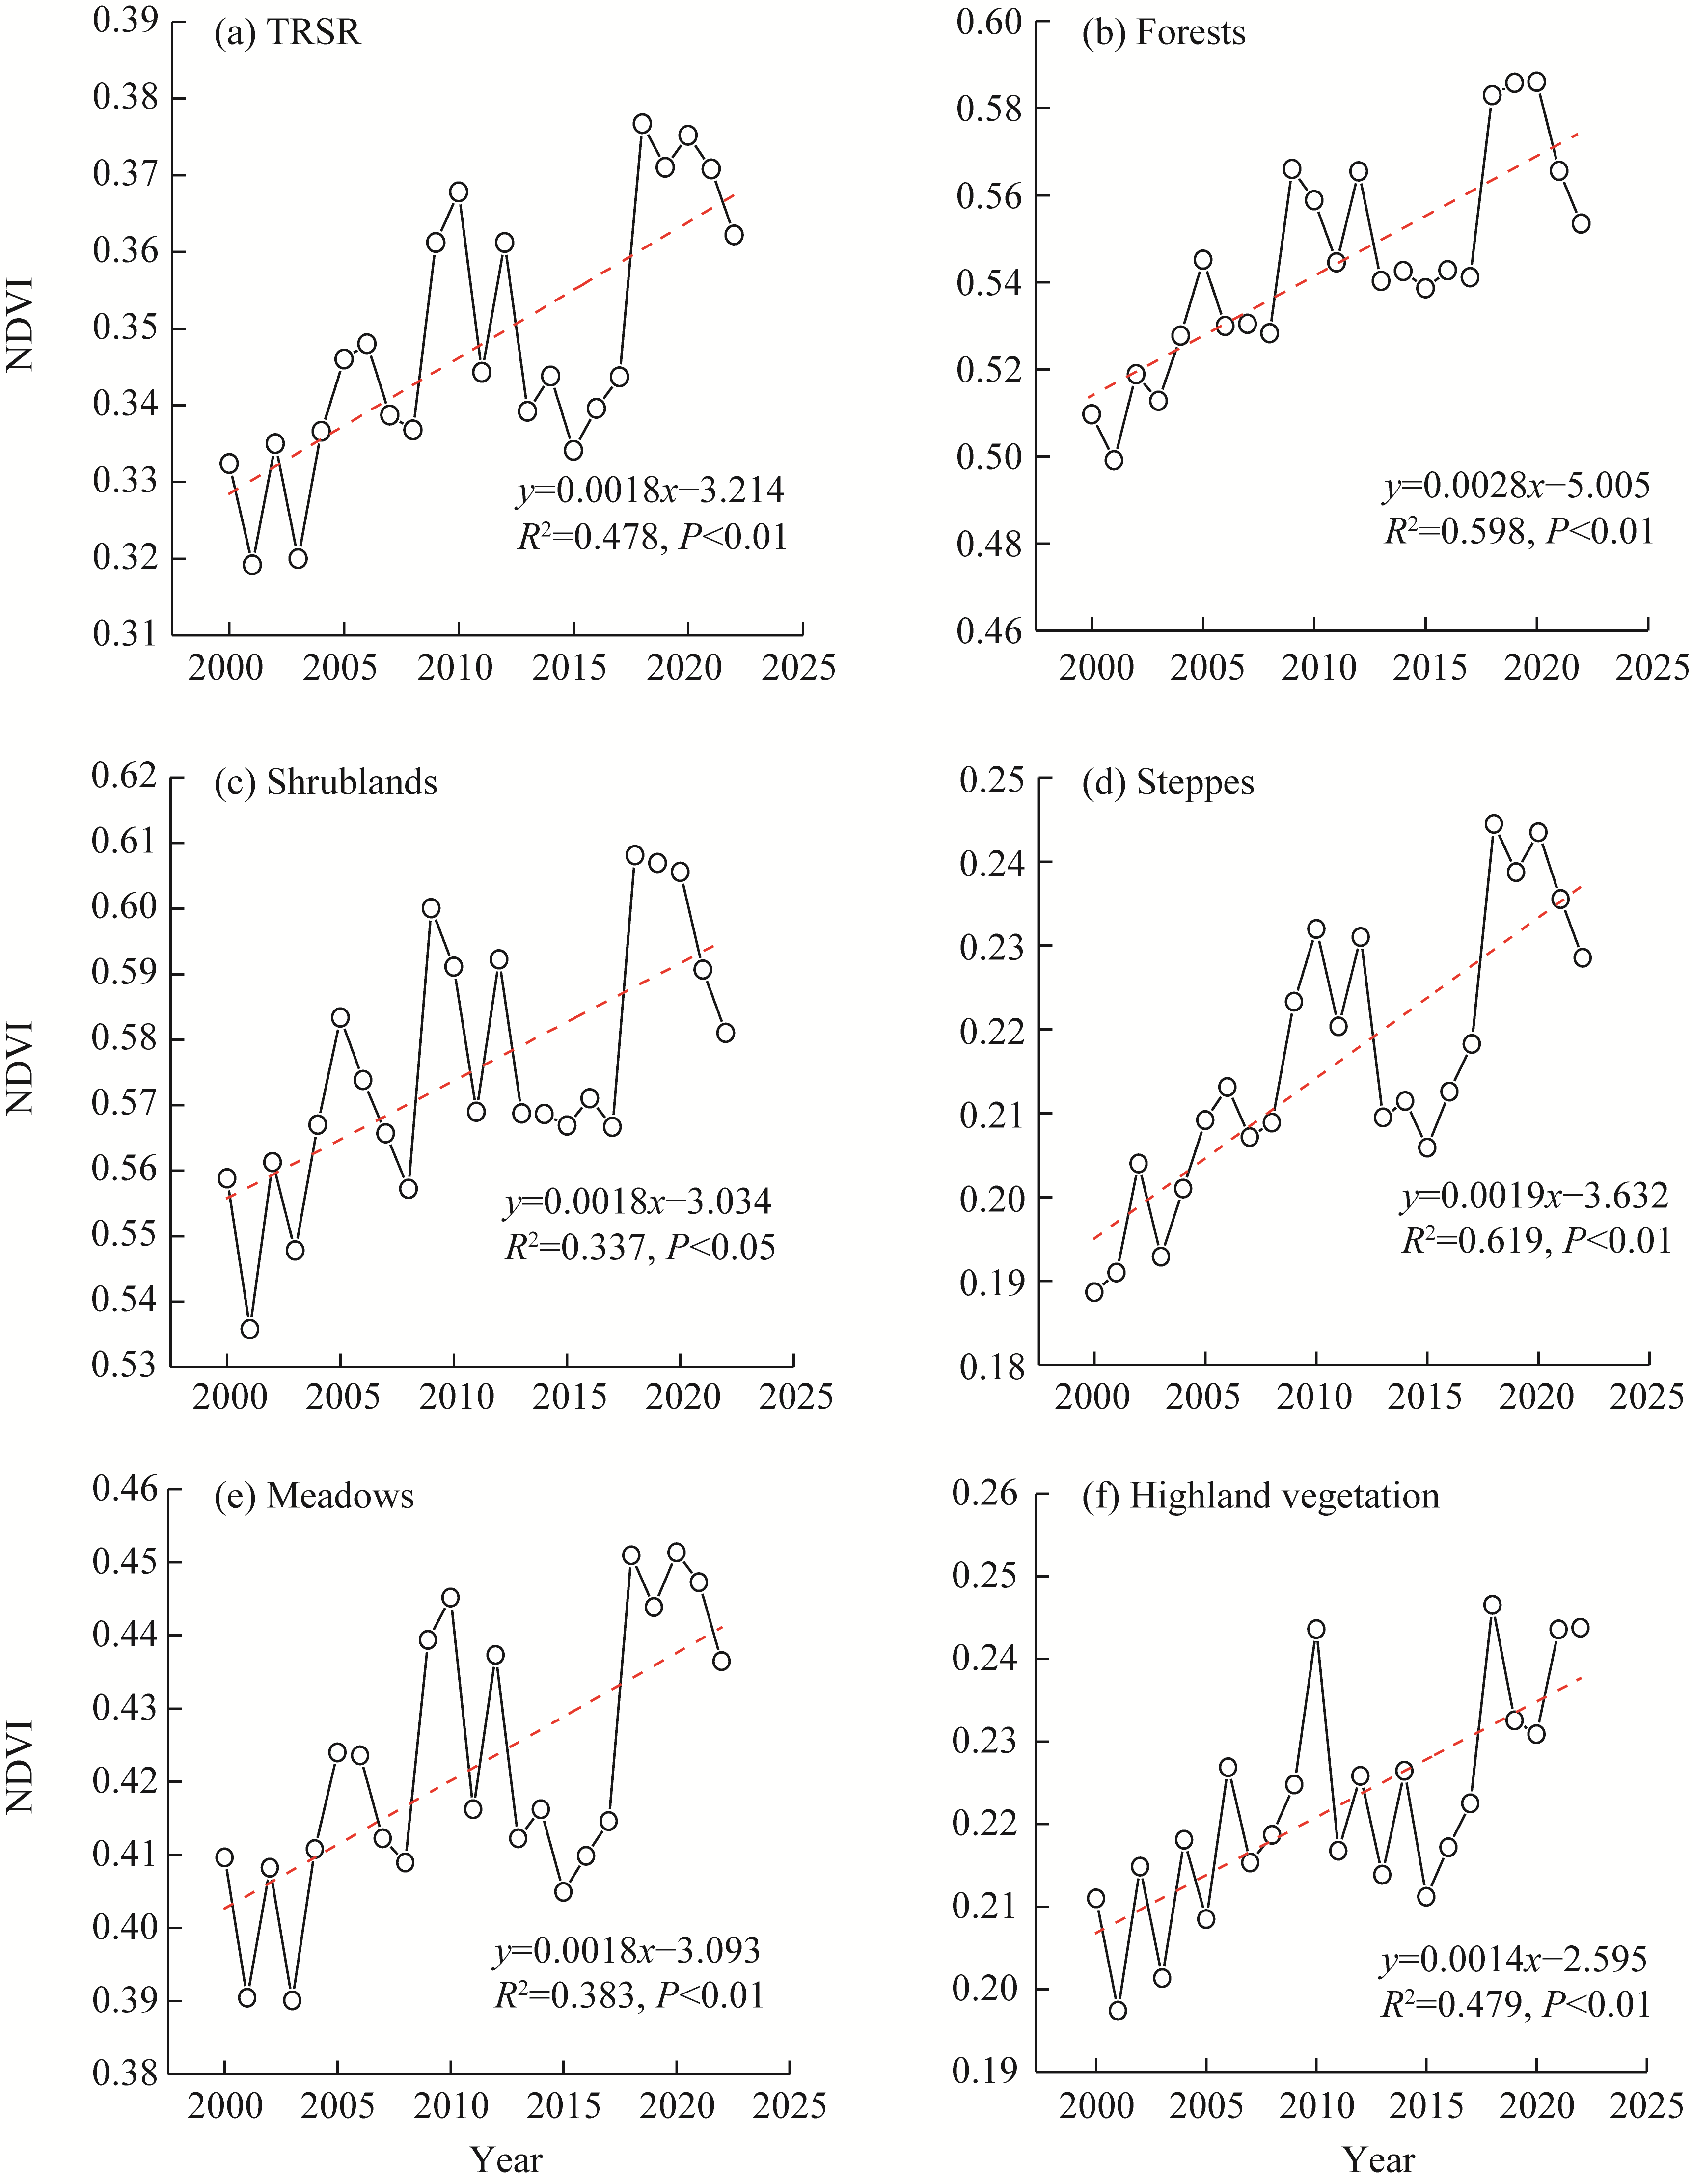
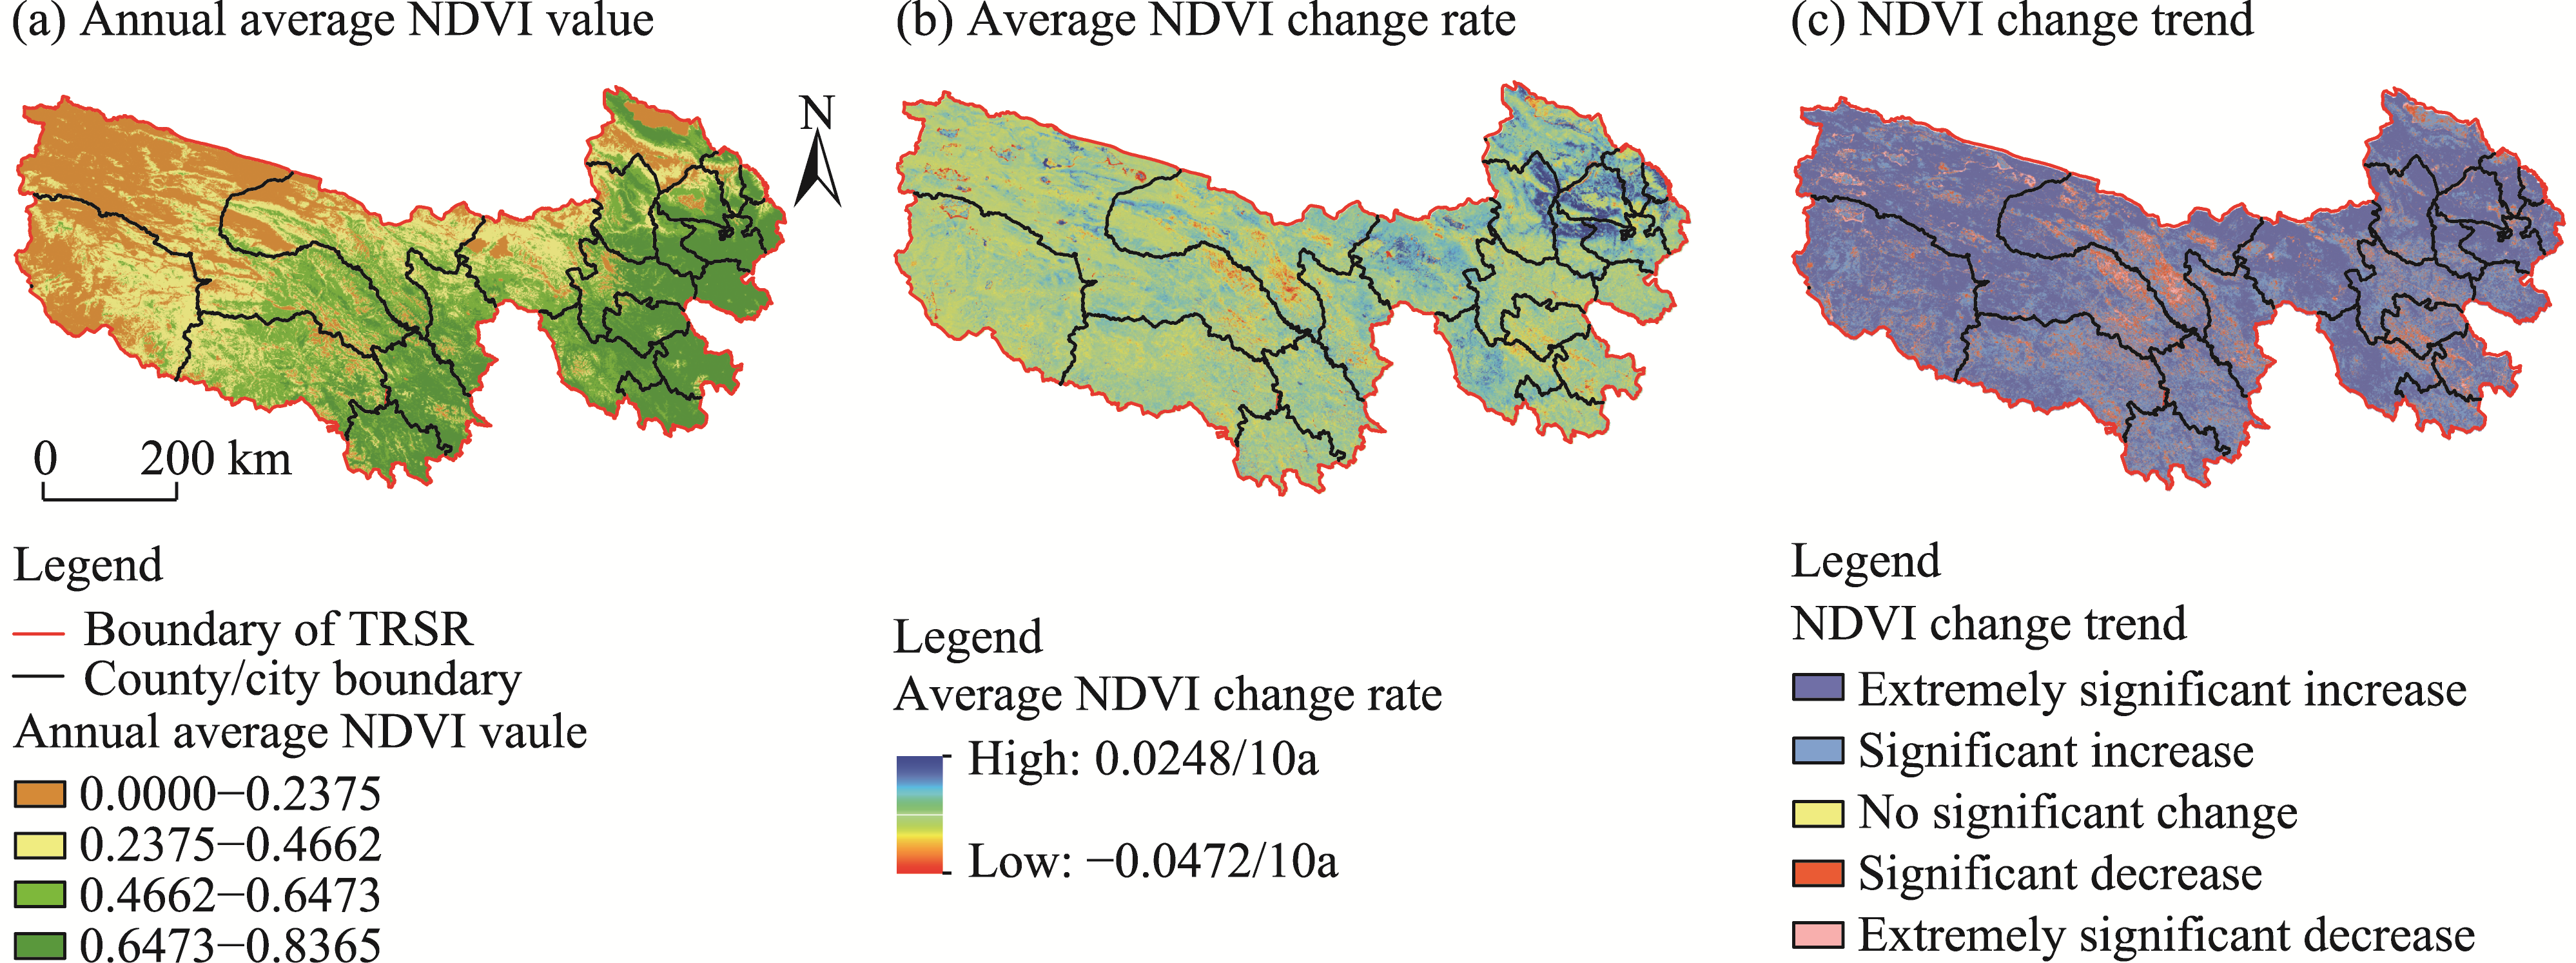
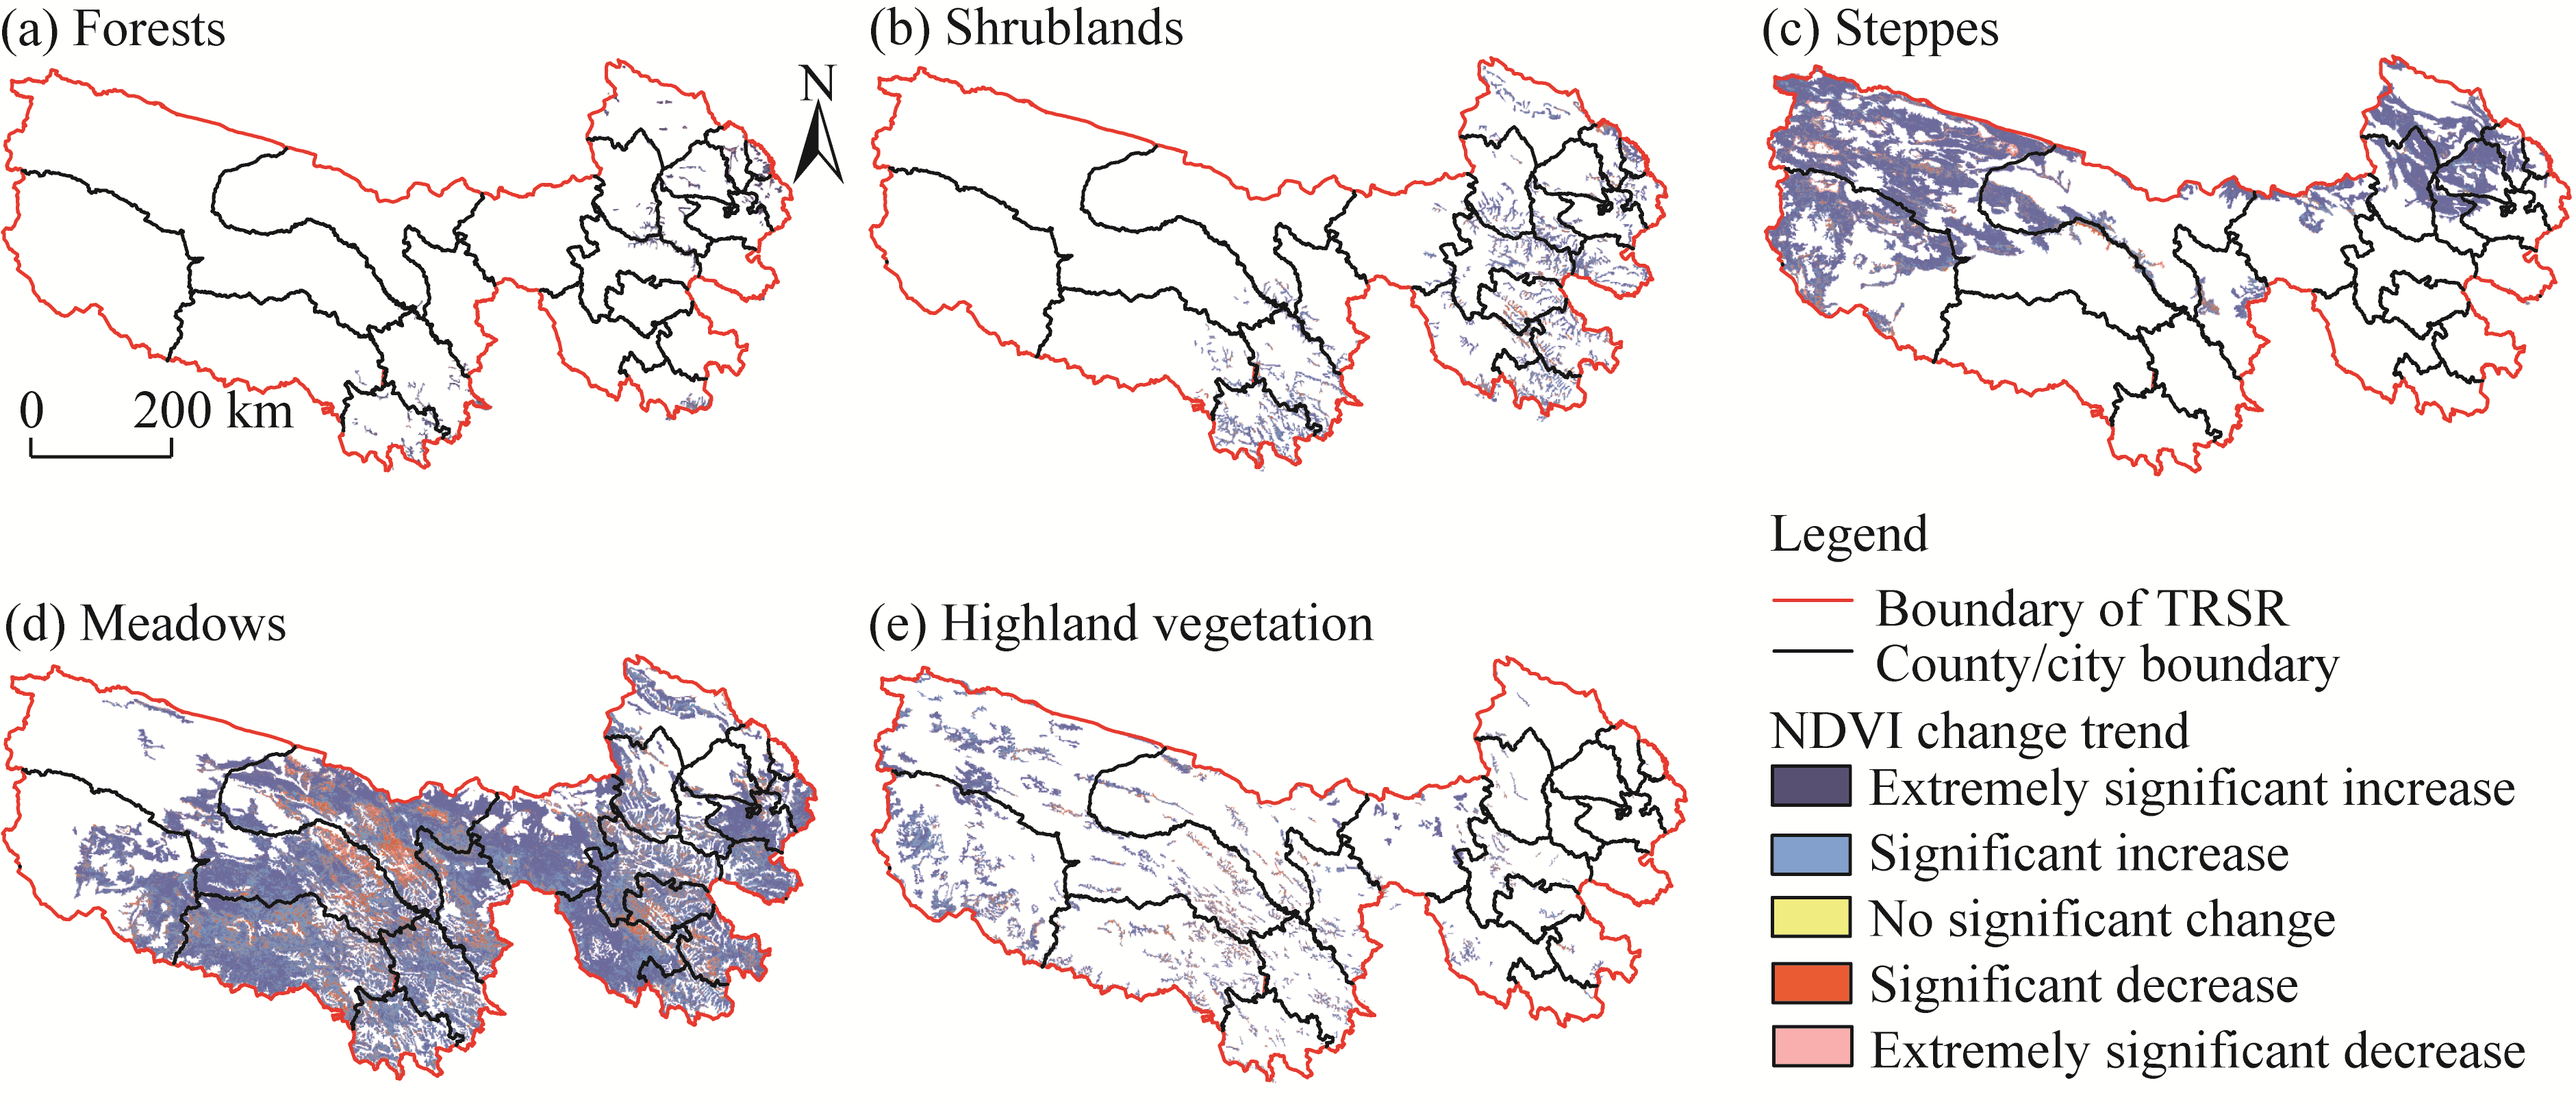
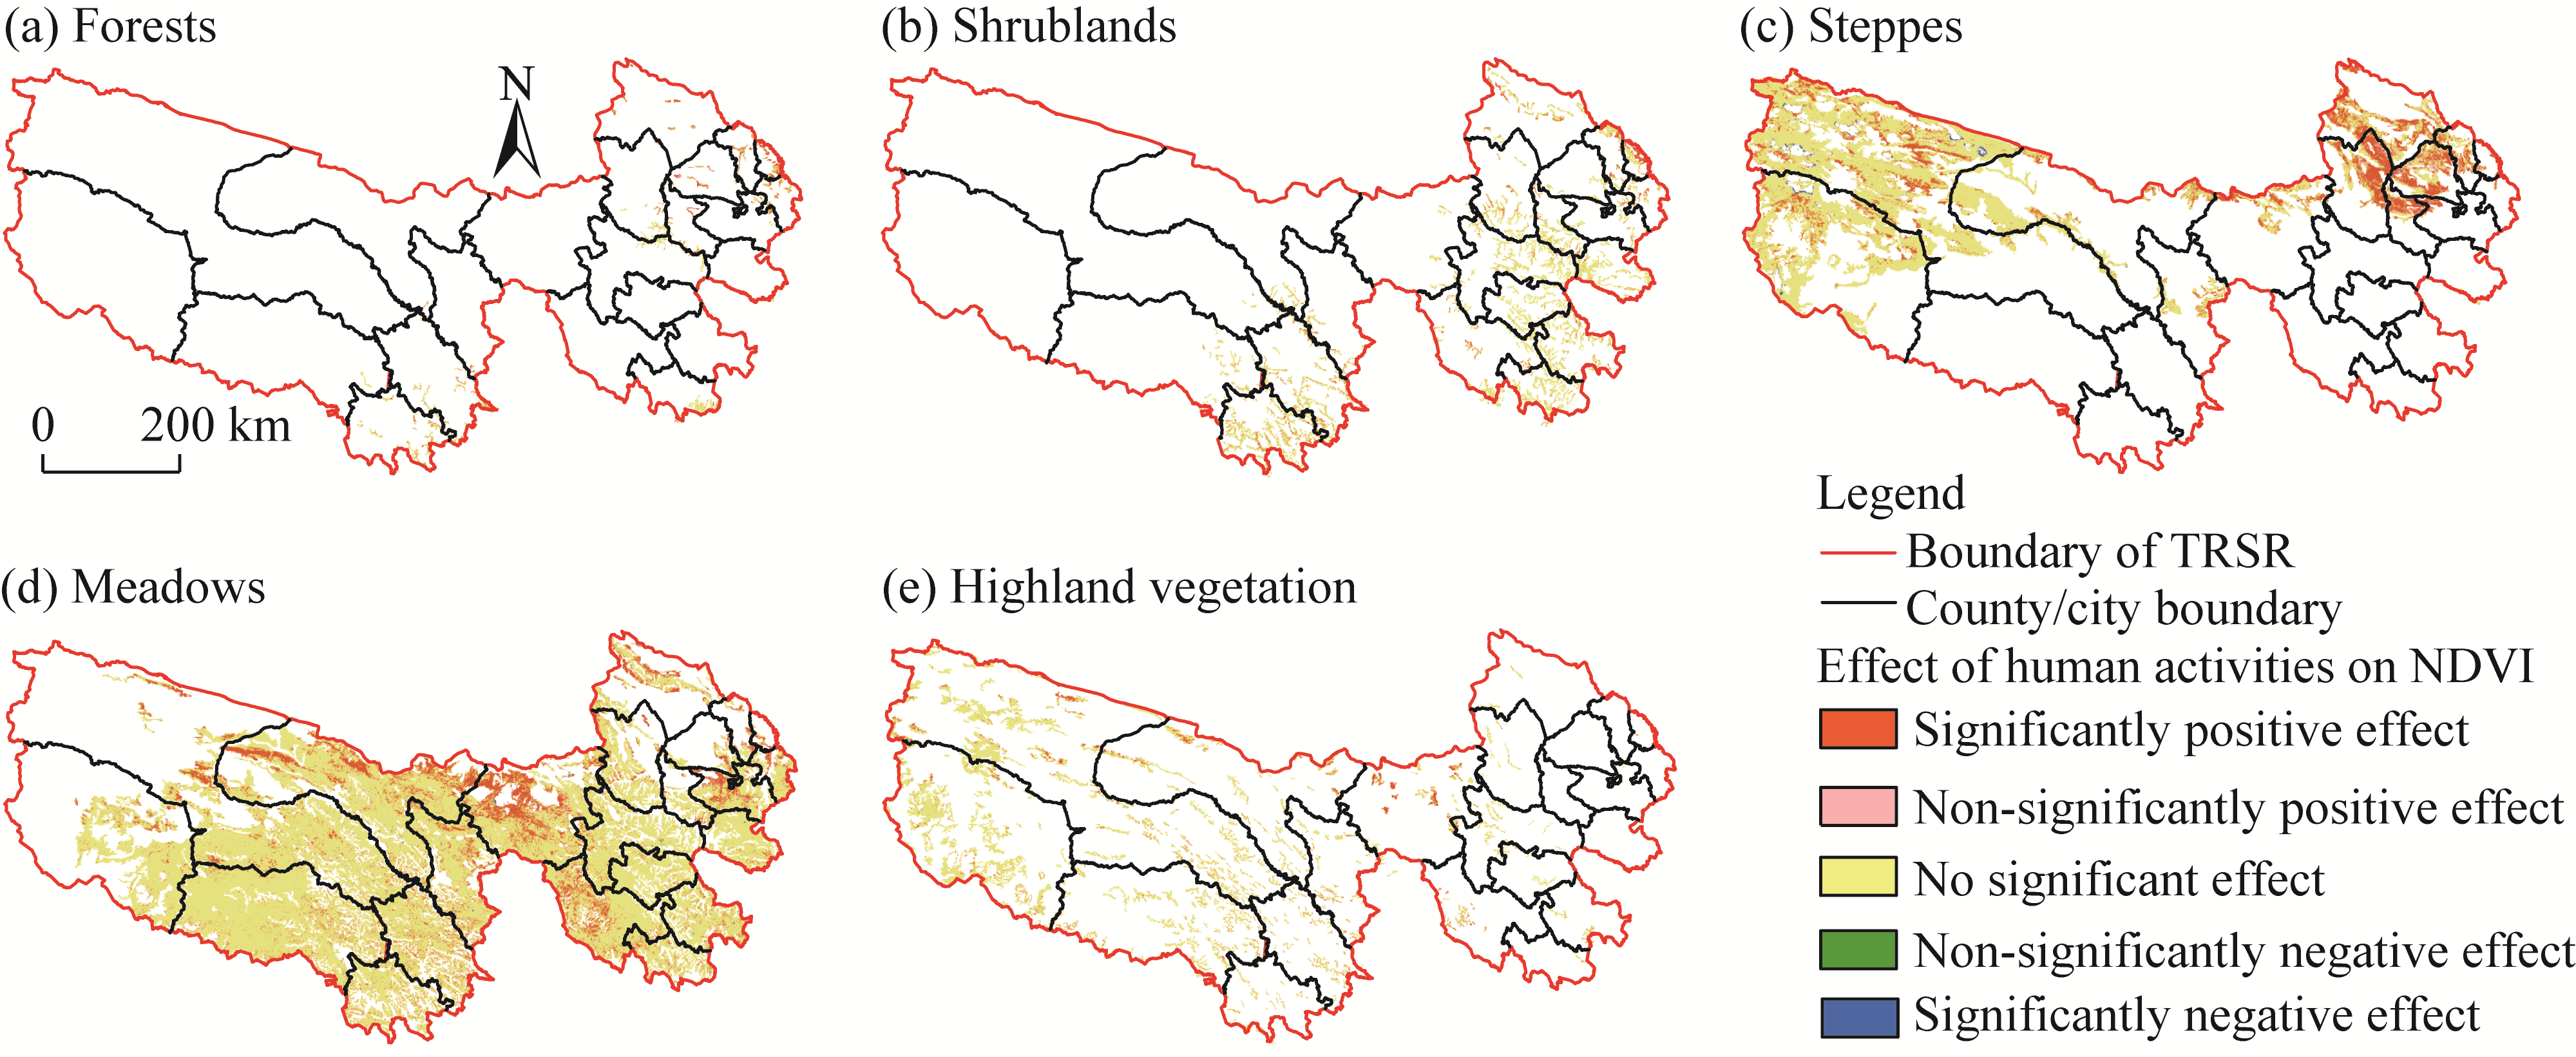
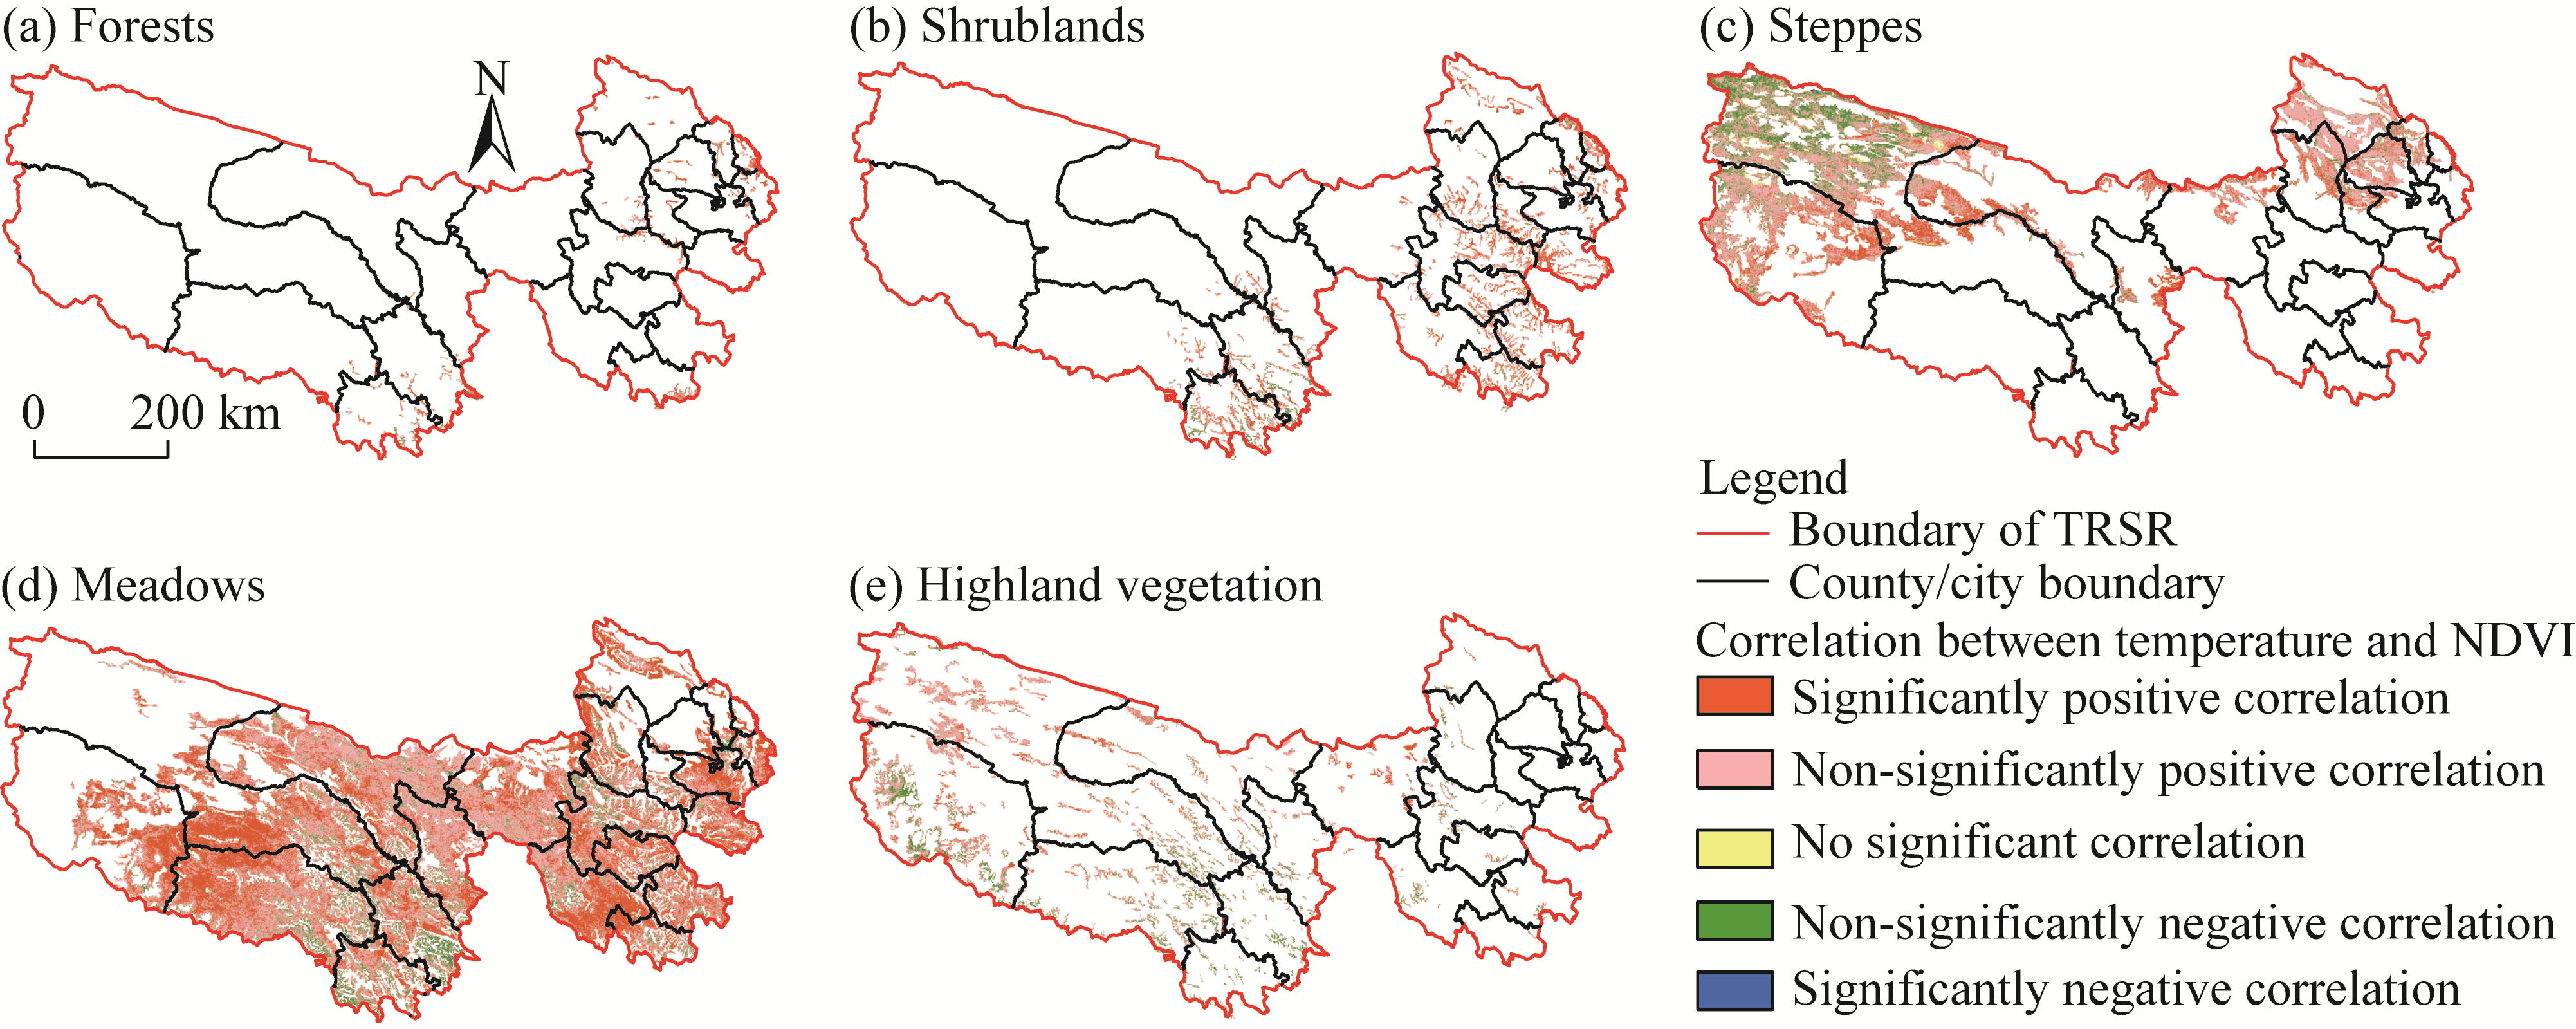
Abstract The Three-River Source Region (TRSR) in China holds a vital position and exhibits an irreplaceable strategic importance in ecological preservation at the national level. On the basis of an in-depth study of the vegetation evolution in the TRSR from 2000 to 2022, we conducted a detailed analysis of the feedback mechanism of vegetation growth to climate change and human activity for different vegetation types. During the growing season, the spatiotemporal variations of normalized difference vegetation index (NDVI) for different vegetation types in the TRSR were analyzed using the Moderate Resolution Imaging Spectroradiometer (MODIS)-NDVI data and meteorological data from 2000 to 2022. In addition, the response characteristics of vegetation to temperature, precipitation, and human activity were assessed using trend analysis, partial correlation analysis, and residual analysis. Results indicated that, after in-depth research, from 2000 to 2022, the TRSR's average NDVI during the growing season was 0.3482. The preliminary ranking of the average NDVI for different vegetation types was as follows: shrubland (0.5762)>forest (0.5443)>meadow (0.4219)>highland vegetation (0.2223)>steppe (0.2159). The NDVI during the growing season exhibited a fluctuating growth trend, with an average growth rate of 0.0018/10a (P<0.01). Notably, forests displayed a significant development trend throughout the growing season, possessing the fastest rate of change in NDVI (0.0028/10a). Moreover, the upward trends in NDVI for forests and steppes exhibited extensive spatial distributions, with significant increases accounting for 95.23% and 93.80%, respectively. The sensitivity to precipitation was significantly enhanced in other vegetation types other than highland vegetation. By contrast, steppes, meadows, and highland vegetation demonstrated relatively high vulnerability to temperature fluctuations. A further detailed analysis revealed that climate change had a significant positive impact on the TRSR from 2000 to 2022, particularly in its northwestern areas, accounting for 85.05% of the total area. Meanwhile, human activity played a notable positive role in the southwestern and southeastern areas of the TRSR, covering 62.65% of the total area. Therefore, climate change had a significantly higher impact on NDVI during the growing season in the TRSR than human activity.
|
|
Received: 10 April 2024
Published: 31 August 2024
|
|
Corresponding Authors:
*YAN Bing (E-mail: yanbing@jxas.ac.cn)
|
|
|
| [1] |
Cai Z Y, Song P F, Wang J B, et al. 2022. Grazing pressure index considering both wildlife and livestock in Three-River Headwaters, Qinghai-Tibetan Plateau. Ecological Indicators, 143: 109338, doi: 10.1016/j.ecolind.2022.109338.
|
|
|
| [2] |
Chen J H, Wang S Q, Chen B, et al. 2021. Comparative analysis on the estimation of diurnal solar-induced chlorophyll fluorescence dynamics for a subtropical evergreen coniferous forest. Remote Sensing, 13(16): 3143, doi: 10.3390/rs13163143.
|
|
|
| [3] |
Chen M Z, Xue Y Y, Xue Y B, et al. 2024. Assessing the effects of climate and human activity on vegetation change in Northern China. Environmental Research, 247: 118233, doi: 10.1016/j.envres.2024.118233.
|
|
|
| [4] |
Chu H S, Venevsky S, Wu C, et al. 2019. NDVI-based vegetation dynamics and its response to climate changes at Amur-Heilongjiang River Basin from 1982 to 2015. Science of the Total Environment, 650: 2051-2062.
|
|
|
| [5] |
Dong S K, Shang Z H, Gao J X, et al. 2022. Enhancing the ecological services of the Qinghai-Tibetan Plateau's grasslands through sustainable restoration and management in era of global change. Agriculture, Ecosystems & Environment, 326: 107756, doi: 10.1016/j.agee.2021.107756.
|
|
|
| [6] |
Fang Y P, Qin D H, Ding Y J. 2011. Frozen soil change and adaptation of animal husbandry: a case of the source regions of Yangtze and Yellow Rivers. Environmental Science & Policy, 14(5): 555-568.
|
|
|
| [7] |
Feng S R, Guo L, Li D D, et al. 2018. Spatial patterns of landscape change in the Three Rivers Headwaters Region of China, 1987-2015. Acta Ecologica Sinica, 38(2): 76-80.
|
|
|
| [8] |
Gao S Q, Dong G T, Jiang X H, et al. 2021. Quantification of natural and anthropogenic driving forces of vegetation changes in the Three-River Headwater Region during 1982-2015 based on geographical detector model. Remote Sensing, 13(20): 4175, doi: 10.3390/rs13204175.
|
|
|
| [9] |
Gong X W, Li Y Q, Wang X Y, et al. 2022. Quantitative assessment of the contributions of climate change and human activities on vegetation degradation and restoration in typical ecologically fragile areas of China. Ecological Indicators, 144: 109536, doi: 10.1016/j.ecolind.2022.109536.
|
|
|
| [10] |
Hossain M, Li J F. 2021. NDVI-based vegetation dynamics and its resistance and resilience to different intensities of climatic events. Global Ecology and Conservation, 30: e01768, doi: 10.1016/j.gecco.2021.e01768.
|
|
|
| [11] |
Hu M Q, Mao F, Sun H, et al. 2011. Study of normalized difference vegetation index variation and its correlation with climate factors in the Three-River-Source Region. International Journal of Applied Earth Observation and Geoinformation, 13(1): 24-33.
|
|
|
| [12] |
Jiang C, Zhang L B. 2016. Ecosystem change assessment in the Three-river Headwater Region, China: Patterns, causes, and implications. Ecological Engineering, 93: 24-36.
|
|
|
| [13] |
Jiao K W, Gao J B, Liu Z H, et al. 2021. Revealing climatic impacts on the temporal and spatial variation in vegetation activity across China: Sensitivity and contribution. Advances in Climate Change Research, 12(3): 409-420.
|
|
|
| [14] |
Jin H Y, Chen X H, Wang Y M, et al. 2021. Spatio-temporal distribution of NDVI and its influencing factors in China. Journal of Hydrology, 603: 127129, doi: 10.1016/j.jhydrol.2021.127129.
|
|
|
| [15] |
Kumar V, Bharti B, Singh H, et al. 2023. Assessing the interrelation between NDVI and climate dependent variables by using granger causality test and vector auto-regressive neural network model. Physics and Chemistry of the Earth, Parts A/B/C, 131: 103428, doi: 10.1016/j.pce.2023.103428.
|
|
|
| [16] |
Li C C, Li H J, Li J Z, et al. 2019. Using NDVI percentiles to monitor real-time crop growth. Computers and Electronics in Agriculture, 162: 357-363.
doi: 10.1016/j.compag.2019.04.026
|
|
|
| [17] |
Li L H, Zhang Y L, Liu L S, et al. 2018a. Spatiotemporal patterns of vegetation greenness change and associated climatic and anthropogenic drivers on the Tibetan Plateau during 2000-2015. Remote Sensing, 10(10): 1525, doi: 10.3390/rs10101525.
|
|
|
| [18] |
Li P, Peng C H, Wang M, et al. 2018b. Dynamics of vegetation autumn phenology and its response to multiple environmental factors from 1982 to 2012 on Qinghai-Tibetan Plateau in China. Science of the Total Environment, 637-638: 855-864.
|
|
|
| [19] |
Li S H, Yu D Y, Huang T, et al. 2022a. Identifying priority conservation areas based on comprehensive consideration of biodiversity and ecosystem services in the Three-River Headwaters Region, China. Journal of Cleaner Production, 359: 132082, doi: 10.1016/j.jclepro.2022.132082.
|
|
|
| [20] |
Li S K, Li X B, Gong J R, et al. 2022b. Quantitative analysis of natural and anthropogenic factors influencing vegetation NDVI changes in temperate drylands from a spatial stratified heterogeneity perspective: a case study of Inner Mongolia grasslands, China. Remote Sensing, 14(14): 3320, doi: 10.3390/rs14143320.
|
|
|
| [21] |
Lin M, Hou L Z, Qi Z M, et al. 2022. Impacts of climate change and human activities on vegetation NDVI in China's Mu Us Sandy Land during 2000-2019. Ecological Indicators, 142: 109164, doi: 10.1016/j.ecolind.2022.109164.
|
|
|
| [22] |
Liu D, Cao C X, Dubovyk O, et al. 2017. Using fuzzy analytic hierarchy process for spatio-temporal analysis of eco-environmental vulnerability change during 1990-2010 in Sanjiangyuan region, China. Ecological Indicators, 73: 612-625.
|
|
|
| [23] |
Liu H J, Zhao X Q, Han X P, et al. 2020. Comparative study of gut microbiota in Tibetan wild asses (Equus kiang) and domestic donkeys (Equus asinus) on the Qinghai-Tibet plateau. PeerJ, 8: e9032, doi: 10.7717/peerj.9032.
|
|
|
| [24] |
Liu H Y, Zhang M Y, Lin Z S, et al. 2018. Spatial heterogeneity of the relationship between vegetation dynamics and climate change and their driving forces at multiple time scales in Southwest China. Agricultural and Forest Meteorology, 256-257: 10-21.
|
|
|
| [25] |
Liu X F, Zhang J S, Zhu X F, et al. 2014a. Spatiotemporal changes in vegetation coverage and its driving factors in the Three-River Headwaters Region during 2000-2011. Journal of Geographical Sciences, 24: 288-302.
|
|
|
| [26] |
Liu X F, Zhu X F, Zhu W Q, et al. 2014b. Changes in spring phenology in the Three-Rivers Headwater Region from 1999 to 2013. Remote Sensing, 6(9): 9130-9144.
|
|
|
| [27] |
Liu Y, Liu H H, Chen Y, et al. 2022. Quantifying the contributions of climate change and human activities to vegetation dynamic in China based on multiple indices. Science of the Total Environment, 838: 156553, doi: 10.1016/j.scitotenv.2022.156553.
|
|
|
| [28] |
Liu Y F, Xu M, Guo B, et al. 2023. Changes in the vegetation NPP of mainland China under the combined actions of climatic-socioeconomic factors. Forests, 14(12): 2341, doi: 10.3390/f14122341.
|
|
|
| [29] |
Ma B R, Zeng W H, Hu G Z, et al. 2022. Normalized difference vegetation index prediction based on the delta downscaling method and back-propagation artificial neural network under climate change in the Sanjiangyuan region, China. Ecological Informatics, 72: 101883, doi: 10.1016/j.ecoinf.2022.101883.
|
|
|
| [30] |
Ma M Y, Wang Q M, Liu R, et al. 2023. Effects of climate change and human activities on vegetation coverage change in northern China considering extreme climate and time-lag and -accumulation effects. Science of the Total Environment, 860: 160527, doi: 10.1016/j.scitotenv.2022.160527.
|
|
|
| [31] |
Mao D H, Wang Z M, Luo L, et al. 2012. Integrating AVHRR and MODIS data to monitor NDVI changes and their relationships with climatic parameters in Northeast China. International Journal of Applied Earth Observation and Geoinformation, 18: 528-536.
|
|
|
| [32] |
Meng X Y, Gao X, Li S Y, et al. 2020. Spatial and temporal characteristics of vegetation NDVI changes and the driving forces in Mongolia during 1982-2015. Remote Sensing, 12(4): 603, doi: 10.3390/rs12040603.
|
|
|
| [33] |
Miehe G, Schleuss P, Seeber E, et al. 2019. The Kobresia pygmaea ecosystem of the Tibetan highlands—Origin, functioning and degradation of the world's largest pastoral alpine ecosystem. Science of the Total Environment, 648: 754-771.
|
|
|
| [34] |
Ning X G, Zhu N, Liu Y F, et al. 2022. Quantifying impacts of climate and human activities on the grassland in the Three-River Headwater Region after two phases of ecological project. Geography and Sustainability, 3(2): 164-176.
|
|
|
| [35] |
Pang G J, Wang X J, Yang M X. 2017. Using the NDVI to identify variations in, and responses of, vegetation to climate change on the Tibetan Plateau from 1982 to 2012. Quaternary International, 444(Part A): 87-96.
|
|
|
| [36] |
Peng W F, Kuang T T, Tao S. 2019. Quantifying influences of natural factors on vegetation NDVI changes based on geographical detector in Sichuan, western China. Journal of Cleaner Production, 233: 353-367.
|
|
|
| [37] |
Ren Y T, Zhang F, Zhao C L, et al. 2023. Attribution of climate change and human activities to vegetation NDVI in Jilin Province, China during 1998-2020. Ecological Indicators, 153: 110415, doi: 10.1016/j.ecolind.2023.110415.
|
|
|
| [38] |
Shen X J, An R, Feng L, et al. 2018. Vegetation changes in the Three-River Headwaters Region of the Tibetan Plateau of China. Ecological Indicators, 93: 804-812.
|
|
|
| [39] |
Shi S Y, Yu J J, Wang F, et al. 2021. Quantitative contributions of climate change and human activities to vegetation changes over multiple time scales on the Loess Plateau. Science of the Total Environment, 755: 142419, doi: 10.1016/j.scitotenv.2020.142419.
|
|
|
| [40] |
Sun L J, Zhao D, Zhang G Z, et al. 2022. Using SPOT VEGETATION for analyzing dynamic changes and influencing factors on vegetation restoration in the Three-River Headwaters Region in the last 20 years (2000-2019), China. Ecological Engineering, 183: 106742, doi: 10.1016/j.ecoleng.2022.106742.
|
|
|
| [41] |
Sun Q Y, Liu W W, Gao Y N, et al. 2020. Spatiotemporal variation and climate influence factors of vegetation ecological quality in the Sanjiangyuan National Park. Sustainability, 12(16): 6634, doi: 10.3390/su12166634.
|
|
|
| [42] |
Sun Y L, Yang Y L, Zhang L, et al. 2015. The relative roles of climate variations and human activities in vegetation change in North China. Physics and Chemistry of the Earth, Parts A/B/C, 87-88: 67-78.
|
|
|
| [43] |
Tong S Q, Zhang J Q, Bao Y H, et al. 2017. Spatial and temporal variations of vegetation cover and the relationships with climate factors in Inner Mongolia based on GIMMS NDVI3g data. Journal of Arid Land, 9(3): 394-407.
doi: 10.1007/s40333-017-0016-4
|
|
|
| [44] |
Wang C Y, Wang J N, Naudiyal N, et al. 2021a. Multiple effects of topographic factors on spatio-temporal variations of vegetation patterns in the Three Parallel Rivers Region, Southeast Qinghai-Tibet Plateau. Remote Sensing, 14(1): 151, doi: 10.3390/rs14010151.
|
|
|
| [45] |
Wang G Q, Li J Y, Sivakumar B, et al. 2020a. Attribution of growing season vegetation activity to climate change and human activities in the Three-River Headwaters Region, China. Journal of Hydroinformatics, 22(1): 186-204.
|
|
|
| [46] |
Wang J Y, Sun H Z, Xiong J N, et al. 2021b. Dynamics and drivers of vegetation phenology in Three-River Headwaters Region based on the Google Earth Engine. Remote Sensing, 13(13): 2528, doi: 10.3390/rs13132528.
|
|
|
| [47] |
Wang L, Bi Y Q, Wang F T, et al. 2022. Scrutinise the variations of glaciers and their climatic attributions in the Sanjiangyuan National Park during 1969-2018. Advances in Climate Change Research, 13(4): 531-539.
|
|
|
| [48] |
Wang M Y, Fu J, Wu Z T, et al. 2020b. Spatiotemporal variation of NDVI in the vegetation growing season in the source region of the Yellow River, China. ISPRS International Journal of Geo-Information, 9(4): 282, doi: 10.3390/ijgi9040282.
|
|
|
| [49] |
Wang R J, Ding Y J, Shangguan D H, et al. 2023. Projections of glacier peak water and its timing in the Sanjiangyuan on the Tibet Plateau. Journal of Hydrology: Regional Studies, 45: 101313, doi: 10.1016/j.ejrh.2022.101313.
|
|
|
| [50] |
Xu B N, Li J J, Liu Y G, et al. 2024. Disentangling the response of vegetation dynamics to natural and anthropogenic drivers over the Qinghai-Tibet Plateau using dimensionality reduction and structural equation model. Forest Ecology and Management, 554: 121677, doi: 10.1016/j.foreco.2023.121677.
|
|
|
| [51] |
Xu J Y, Chen J X, Liu Y X, et al. 2020. Identification of the geographical factors influencing the relationships between ecosystem services in the Belt and Road region from 2010 to 2030. Journal of Cleaner Production, 275: 124153, doi: 10.1016/j.jclepro.2020.124153.
|
|
|
| [52] |
Xue J, Li Z X, Feng Q, et al. 2023. Construction of ecological conservation pattern based on ecosystem services of Three River Headwaters, western China. Global Ecology and Conservation, 44: e02491, doi: 10.1016/j.gecco.2023.e02491.
|
|
|
| [53] |
Yang J, Yan D M, Yu Z L, et al. 2024. NDVI variations of different terrestrial ecosystems and their response to major driving factors on two side regions of the Hu-Line. Ecological Indicators, 159: 111667, doi: 10.1016/j.ecolind.2024.111667.
|
|
|
| [54] |
Yang L, Shen F X, Zhang L, et al. 2021. Quantifying influences of natural and anthropogenic factors on vegetation changes using structural equation modeling: A case study in Jiangsu Province, China. Journal of Cleaner Production, 280: 124330, doi: 10.1016/j.jclepro.2020.124330.
|
|
|
| [55] |
Yi L, Sun Y, Ouyang X, et al. 2022. Identifying the impacts of climate change and human activities on vegetation cover changes: a case study of the Yangtze River Basin, China. International Journal of Environmental Research and Public Health, 19(10): 6239, doi: 10.3390/ijerph19106239.
|
|
|
| [56] |
Yu S, Du W L, Zhang X, et al. 2023. Spatiotemporal changes in NDVI and its driving factors in the Kherlen River Basin. Chinese Geographical Science, 33: 377-392.
|
|
|
| [57] |
Zhai D C, Gao X Z, Li B L, et al. 2022. Diverse chronic responses of vegetation aboveground net primary productivity to climatic changes on Three-River Headwaters region. Ecological Indicators, 139: 108925, doi: 10.1016/j.ecolind.2022.108925.
|
|
|
| [58] |
Zhai X H, Liang X L, Yan C Z, et al. 2020. Vegetation dynamic changes and their response to ecological engineering in the Sanjiangyuan Region of China. Remote Sensing, 12(24): 4035, doi: 10.3390/rs12244035.
|
|
|
| [59] |
Zhang L H, Jia L Z, He L Y, et al. 2023. Homeostatic evidence of management-induced phosphorus decoupling from soil microbial carbon and nitrogen metabolism. Journal of Plant Ecology, 16(6): rtad035, doi: 10.1093/jpe/rtad035.
|
|
|
| [60] |
Zhang X C, Jin X M. 2021. Vegetation dynamics and responses to climate change and anthropogenic activities in the Three-River Headwaters Region, China. Ecological Indicators, 131: 108223, doi: 10.1016/j.ecolind.2021.108223.
|
|
|
| [61] |
Zhang Y, Zhang C B, Wang Z Q, et al. 2016. Vegetation dynamics and its driving forces from climate change and human activities in the Three-River Source Region, China from 1982 to 2012. Science of the Total Environment, 563-564: 210-220.
|
|
|
| [62] |
Zheng Y T, Han J C, Huang Y F, et al. 2018. Vegetation response to climate conditions based on NDVI simulations using stepwise cluster analysis for the Three-River Headwaters region of China. Ecological Indicators, 92: 18-29.
|
|
|
|
Viewed |
|
|
|
Full text
|
|
|
|
|
Abstract
|
|
|
|
|
Cited |
|
|
|
|
| |
Shared |
|
|
|
|
| |
Discussed |
|
|
|
|