| Research article |
|


|
|
|
| Dynamic evolution of the NDVI and driving factors in the Mu Us Sandy Land of China from 2002 to 2021 |
CHAO Yan, ZHU Yonghua, WANG Xiaohan, LI Jiamin, LIANG Li'e*( ) ) |
| College of Civil Engineering and Architecture, Yan'an University, Yan'an 716000, China |
|
|
|
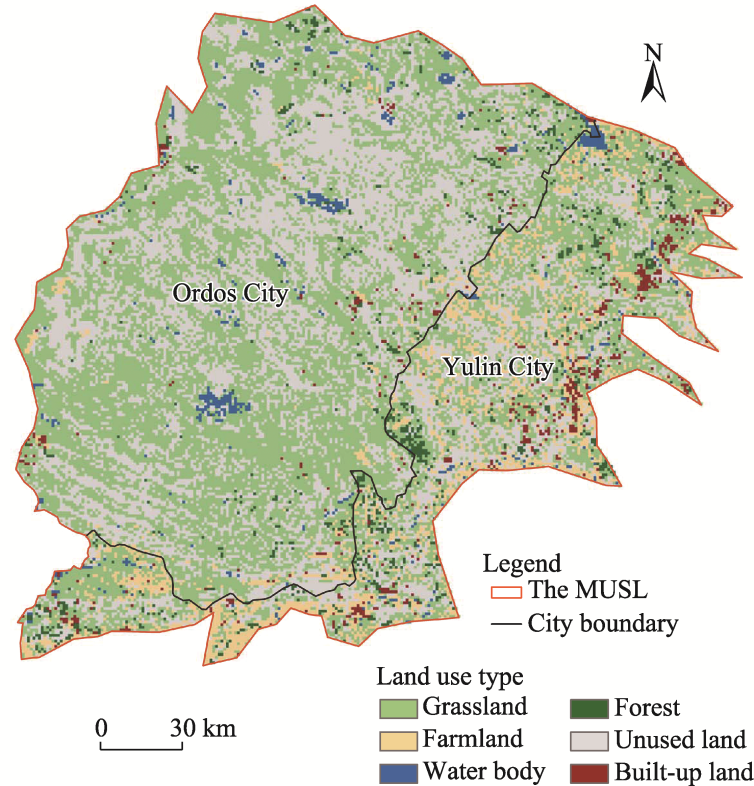
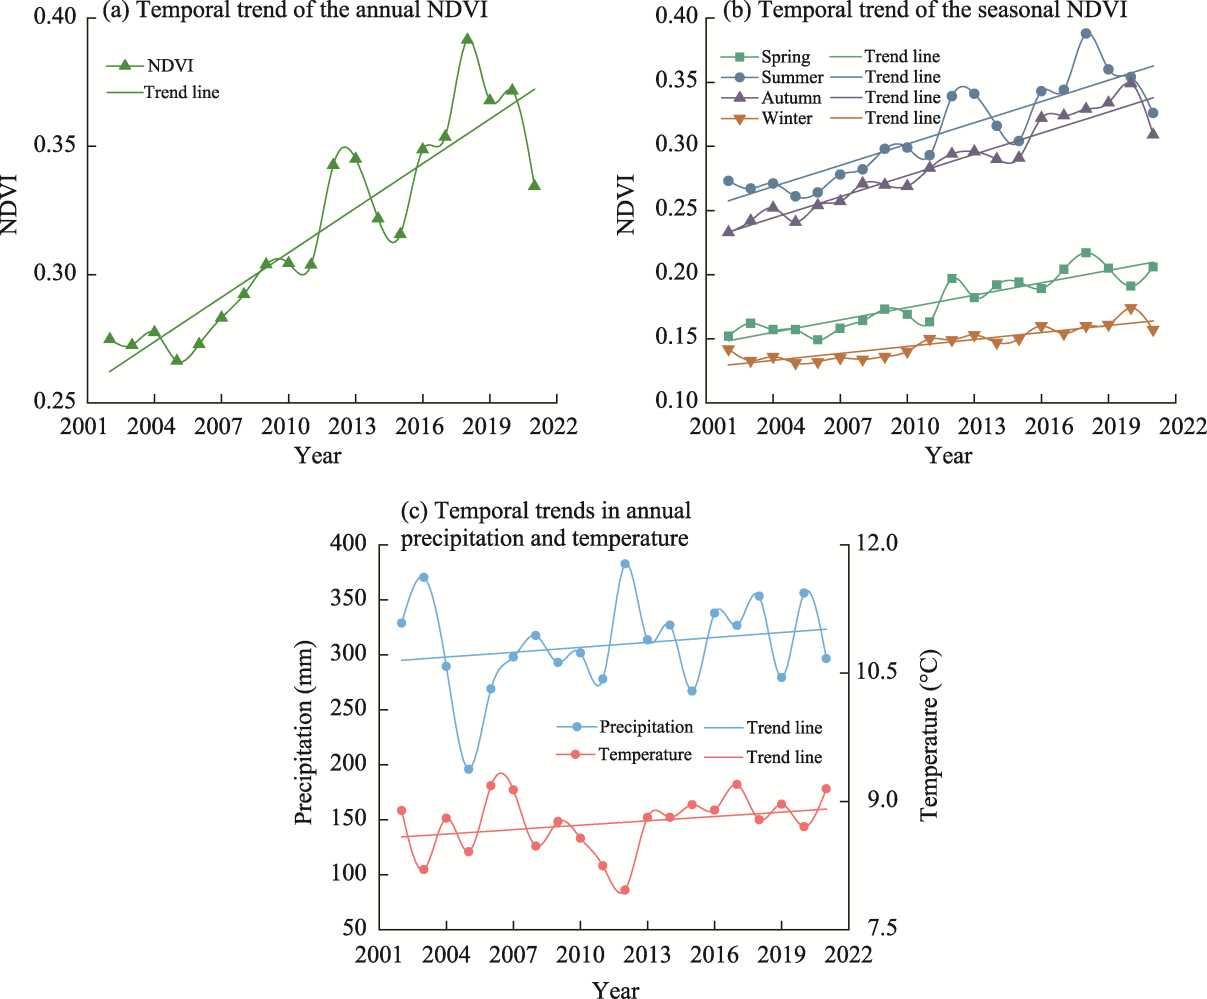
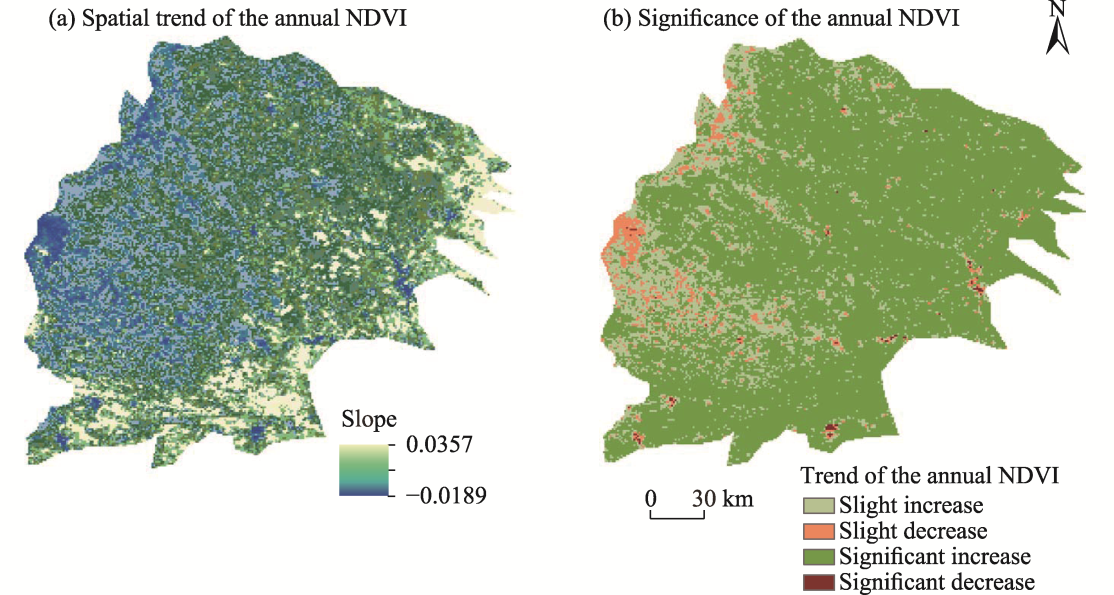
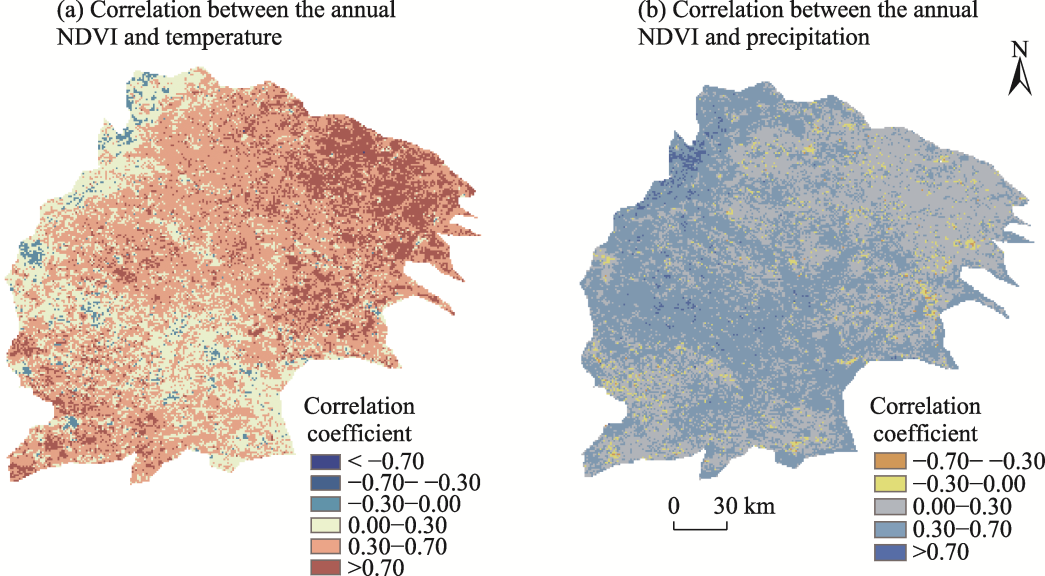
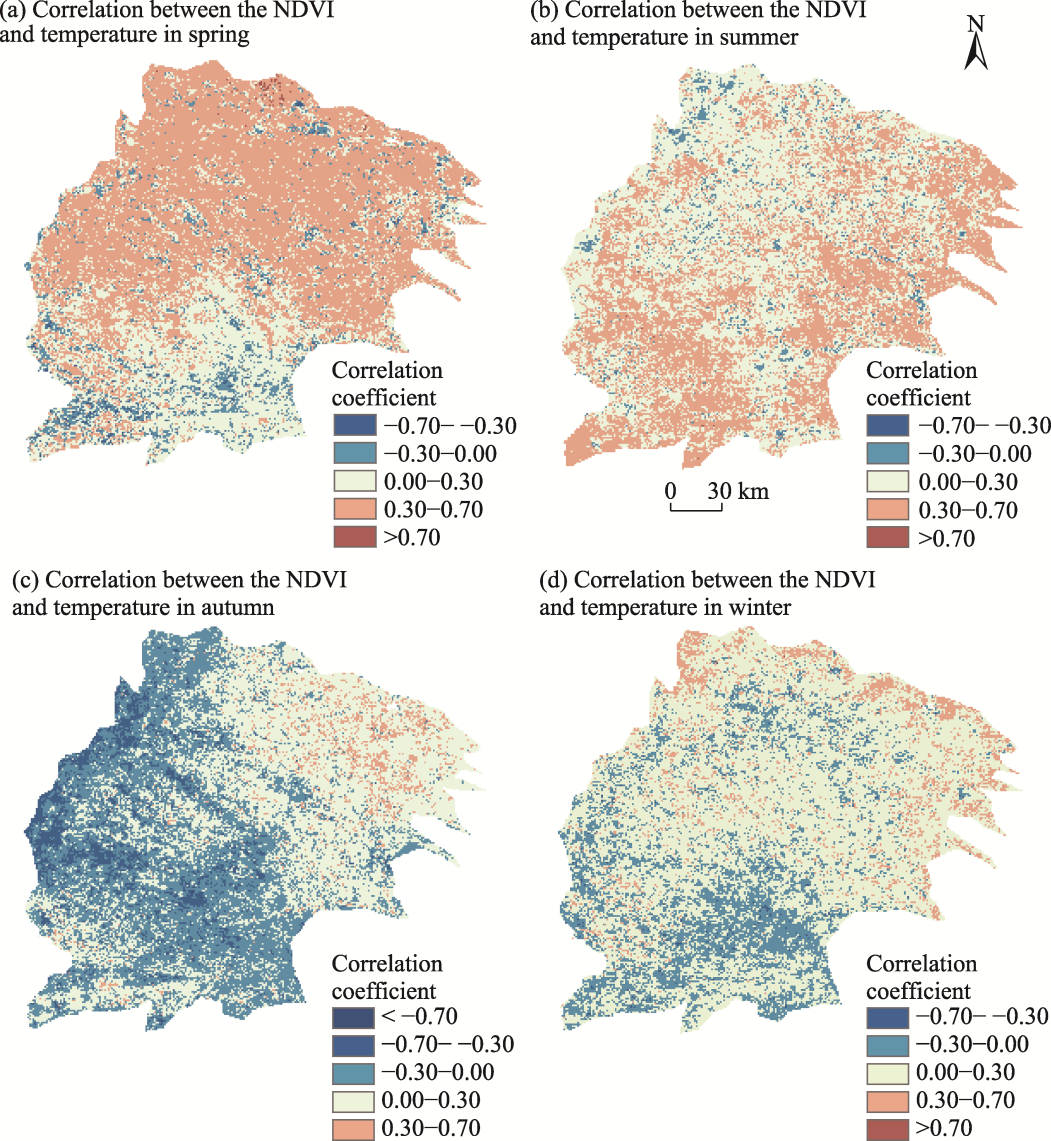
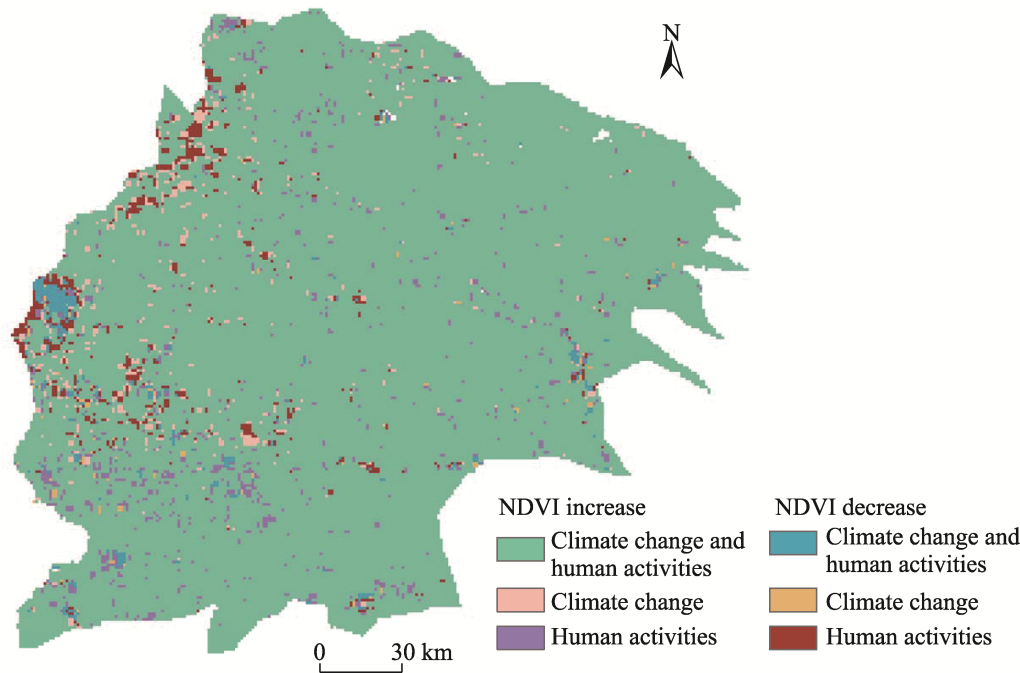
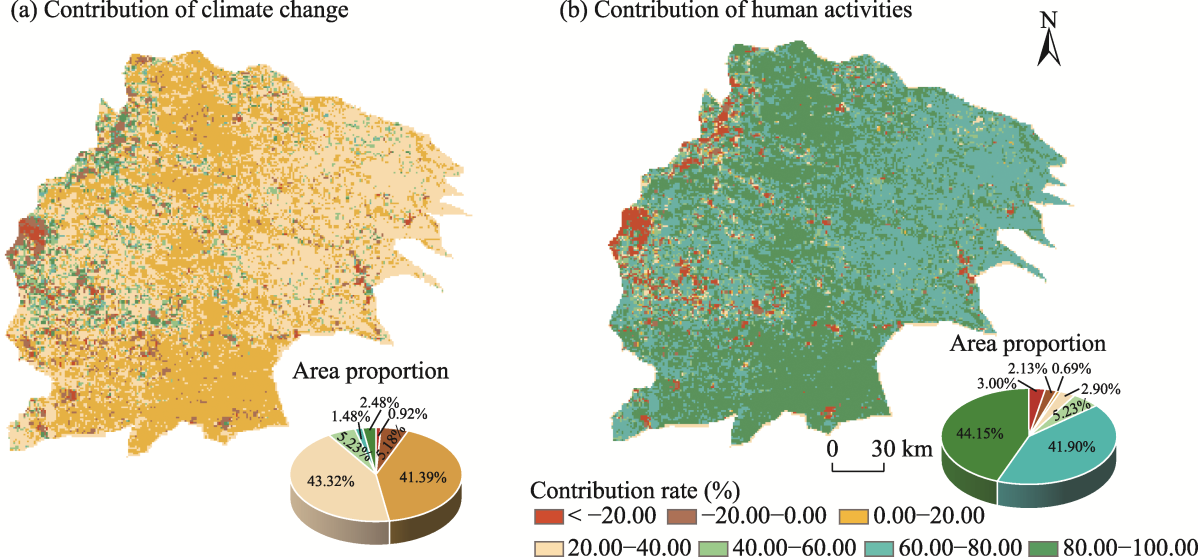
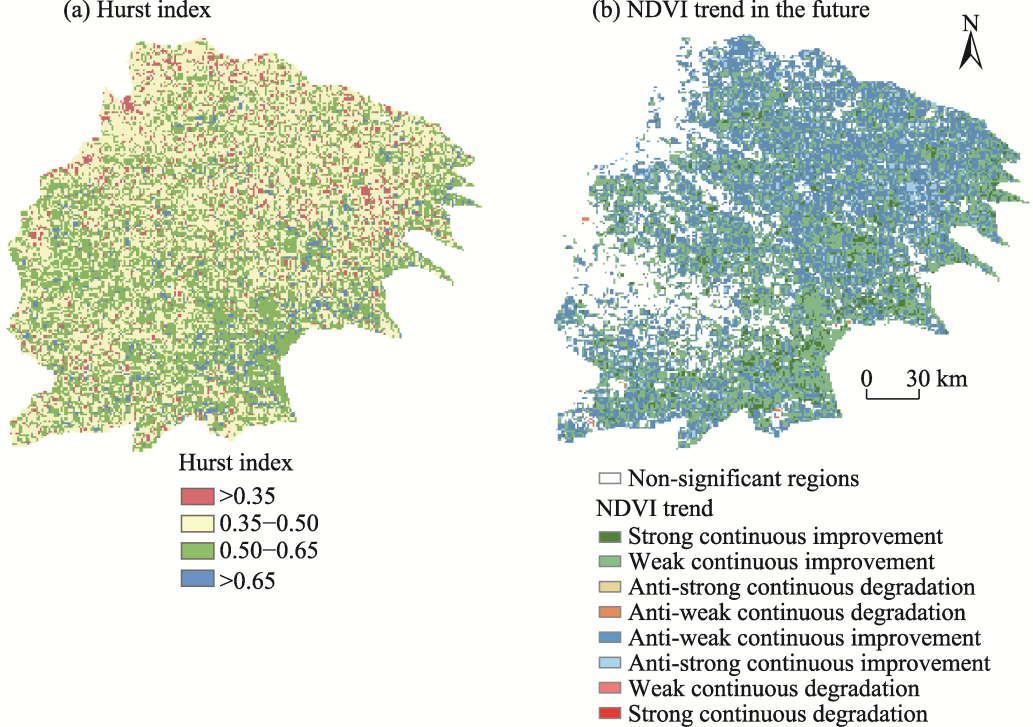
Abstract Investigating the spatiotemporal evolution of vegetation and its response mechanisms to natural and anthropogenic elements is crucial for regional vegetation restoration and ecological preservation. The Mu Us Sandy Land (MUSL), which is situated in the semi-arid zone of northwestern China adjacent to the Loess Plateau, has been at the forefront of desertification and oasis formation over the past two millennia. This study is based on the synthesis of the Normalized Difference Vegetation Index (NDVI) data from MOD13A3 data in the MODIS (Moderate-Resolution Imaging Spectroradiometer) dataset (2002-2021) and climate data (temperature and precipitation) at annual and monthly scales from the National Earth System Science Data Center. A range of analytical methods, including univariate linear regression, Theil-Sen trend analysis and Mann-Kendall significance test, correlation analysis, residual analysis, and Hurst index, were used to explore the response mechanisms of the NDVI to climate change and human activities and to predict the future trends of the NDVI in the MUSL. The results showed that through the method of correlation analysis, in terms of both spatially averaged correlation coefficients and area proportion, the NDVI was positively correlated with temperature and precipitation in 97.59% and 96.51% of the study area, respectively, indicating that temperature has a greater impact on the NDVI than precipitation. Residual analysis quantified the contributions of climate change and human activities to the NDVI changes, revealing that climate change and human activities contribute up to 30.00% and 70.00%, respectively, suggesting that human activities predominantly affect the NDVI changes in the MUSL. The Hurst index was used to categorize the future trend of the NDVI into four main directions of development: continuous degradation (0.05% of the study area), degradation in the past but improvement in the future (54.45%), improvement in the past but degradation in the future (0.13%), and continuous improvement (45.36%). In more than 50.00% of the regions that have been degraded in the past but were expected to improve in the future, the NDVI was expected to exhibit a stable trend of anti-persistent improvement. These findings provide theoretical support for future ecological protection, planning, and the implementation of ecological engineering in the MUSL, and also offer a theoretical basis for the planning and execution of construction projects, environmental protection measures, and the sustainable development of vegetation.
|
|
Received: 30 November 2024
Published: 31 May 2025
|
|
Corresponding Authors:
*LIANG Li'e (E-mail: ydjzlle89@yau.edu.cn)
|
| About author: First author contact: The first author and the second author contributed equally to this work. |
|
|
| [1] |
Bryan B A, Gao L, Ye Y Q, et al. 2018. China's response to a national land-system sustainability emergency. Nature, 559: 193-204.
|
|
|
| [2] |
Chai H B, Guan P J, Hu J B, et al. 2023. Temporal and spatial variations in the normalized difference vegetation index in Shanxi section of the Yellow River Basin and coal mines and their response to climatic factors. Applied Sciences, 13(23): 12596, doi: 10.3390/app132312596.
|
|
|
| [3] |
Deng H, Shu S G, Song Y Q, et al. 2007. Distribution of sand dunes and sand shifts along the southern fringe of the Mu Us Desert since the Ming Dynasty. Chinese Science Bulletin, 52(22): 3128-3138.
|
|
|
| [4] |
Gao W D, Zheng C, Liu X H, et al. 2022. NDVI-based vegetation dynamics and their responses to climate change and human activities from 1982 to 2020: A case study in the Mu Us Sandy Land, China. Ecological Indicators, 137: 108745, doi: 10.1016/j.ecolind.2022.108745.
|
|
|
| [5] |
Gao X, Huang X X, Lo K, et al. 2021. Vegetation responses to climate change in the Qilian Mountain Nature Reserve, Northwest China. Global Ecology and Conservation, 28: e01698, doi: 10.1016/j.gecco.2021.e01698.
|
|
|
| [6] |
Güçlü Y S. 2020. Improved visualization for trend analysis by comparing with classical Mann-Kendall test and ITA. Journal of Hydrology, 584: 124674, doi: 10.1016/j.jhydrol.2020.124674.
|
|
|
| [7] |
Guo Y, Zhang L F, He Y, et al. 2024. LSTM time series NDVI prediction method incorporating climate elements: A case study of Yellow River Basin, China. Journal of Hydrology, 629: 130518, doi: 10.1016/j.jhydrol.2023.130518.
|
|
|
| [8] |
Gutman G, Ignatov A. 1998. The derivation of the green vegetation fraction from NOAA/AVHRR data for use in numerical weather prediction models. International Journal of Remote Sensing, 19(8): 1533-1543.
|
|
|
| [9] |
He Z, Zhou T, Chen J Q, et al. 2023. Impacts of climate warming and humidification on vegetation activity over the Tibetan Plateau. Forests, 14(10): 2055, doi: 10.3390/f14102055.
|
|
|
| [10] |
Hou H F, Li R P, Zheng H X, et al. 2023. Regional NDVI attribution analysis and trend prediction based on the informer model: A case study of the Maowusu Sandland. Agronomy, 13(12): 2882, doi: 10.3390/agronomy13122882.
|
|
|
| [11] |
Ji X Y, Yang J Z, Liu J Y, et al. 2023. Analysis of spatial-temporal changes and driving forces of desertification in the Mu Us Sandy Land from 1991 to 2021. Sustainability, 15(13): 10399, doi: 10.3390/su151310399.
|
|
|
| [12] |
Jiang R G, Xie J C, He H L, et al. 2016. Spatiotemporal variability and predictability of Normalized Difference Vegetation Index (NDVI) in Alberta, Canada. International Journal of Biometeorology, 60(9): 1389-1403.
doi: 10.1007/s00484-015-1132-5
pmid: 26768143
|
|
|
| [13] |
Li X, Xu J W, Jia Y Y, et al. 2024. Spatio-temporal dynamics of vegetation over cloudy areas in Southwest China retrieved from four NDVI products. Ecological Informatics, 81: 102630, doi: 10.1016/j.ecoinf.2024.102630.
|
|
|
| [14] |
Li Y, Zhang W, Schwalm C R, et al. 2023. Widespread spring phenology effects on drought recovery of Northern Hemisphere ecosystems. Nature Climate Change, 13(2): 182-188.
|
|
|
| [15] |
Liao J, Peng F, Kang W P, et al. 2024. No increase of soil wind erosion with the establishment of center pivot irrigation system in Mu-Us sandy land. Science of the Total Environment, 939: 173558, doi: 10.1016/j.scitotenv.2024.173558.
|
|
|
| [16] |
Lin J, Bo W H, Dong X P, et al. 2024. Evolution of vegetation cover and impacts of climate change and human activities in arid regions of Northwest China: A Mu Us Sandy Land case. Environment, Development and Sustainability, doi: 10.1007/s10668-024-04704-4.
|
|
|
| [17] |
Lin M, Hou L Z, Qi Z M, et al. 2022. Impacts of climate change and human activities on vegetation NDVI in China's Mu Us Sandy Land during 2000-2019. Ecological Indicators, 142: 109164, doi: 10.1016/j.ecolind.2022.109164.
|
|
|
| [18] |
Liu Q, Yang Z P, Han F, et al. 2016. NDVI-based vegetation dynamics and their response to recent climate change: A case study in the Tianshan Mountains, China. Environmental Earth Sciences, 75(16): 1189, doi: 10.1007/s12665-016-5987-5.
|
|
|
| [19] |
Liu X K, Dong Z B, Ding Y P, et al. 2022a. Development of center pivot irrigation farmlands from 2009 to 2018 in the Mu Us dune field, China: Implication for land use planning. Journal of Geographical Sciences, 32(10): 1956-1968.
|
|
|
| [20] |
Liu Y, Liu H H, Chen Y, et al. 2022b. Quantifying the contributions of climate change and human activities to vegetation dynamic in China based on multiple indices. Science of the Total Environment, 838: 156553, doi: 10.1016/j.scitotenv.2022.156553.
|
|
|
| [21] |
Lu Q, Kang H L, Zhang F Q, et al. 2024. Impact of climate and human activity on NDVI of various vegetation types in the Three-River Source Region, China. Journal of Arid Land, 16(8): 1080-1097.
doi: 10.1007/s40333-024-0104-1
|
|
|
| [22] |
Miao Y F, Jin H L, Cui J X. 2016. Human activity accelerating the rapid desertification of the Mu Us Sandy Lands, North China. Scientific Reports, 6(1): 23003, doi: 10.1038/srep23003.
|
|
|
| [23] |
Mu S J, Li J L, Zhou W, et al. 2013. Spatial-temporal distribution of net primary productivity and its relationship with climate factors in Inner Mongolia from 2001 to 2010. Acta Ecologica Sinica, 33(12): 3752-3764. (in Chinese)
|
|
|
| [24] |
Mumtaz F, Li J, Liu Q H, et al. 2023. Spatio-temporal dynamics of land use transitions associated with human activities over Eurasian Steppe: Evidence from improved residual analysis. Science of the Total Environment, 905: 166940, doi: 10.1016/j.scitotenv.2023.166940.
|
|
|
| [25] |
Pei H W, Liu M Z, Jia Y G, et al. 2021. The trend of vegetation greening and its drivers in the agro-pastoral ecotone of northern China, 2000-2020. Ecological Indicators, 129: 108004, doi: 10.1016/j.ecolind.2021.108004.
|
|
|
| [26] |
Peng S Z, Ding Y X, Liu W Z, et al. 2019. 1 km monthly temperature and precipitation dataset for China from 1901 to 2017. Earth System Science Data, 11(4): 1931-1946.
|
|
|
| [27] |
Piedallu C, Chéret V, Denux J P, et al. 2019. Soil and climate differently impact NDVI patterns according to the season and the stand type. Science of the Total Environment, 651: 2874-2885.
doi: 10.1016/j.scitotenv.2018.10.052
|
|
|
| [28] |
Rivas-Tabares D A, Saa-Requejo A, Martín-Sotoca J J, et al. 2021. Multiscaling NDVI series analysis of rainfed cereal in Central Spain. Remote Sensing, 13(4): 568, doi: 10.3390/rs13040568.
|
|
|
| [29] |
Sen P K. 1968. Estimates of the regression coefficient based on Kendall's Tau. Journal of the American Statistical Association, 63(324): 1379-1389.
|
|
|
| [30] |
Shaanxi Province Department of Water Resources. 2002-2021. Shaanxi Water Resources Bulletin. Xi'an: Shaanxi Province Department of Water Resources. (in Chinese)
|
|
|
| [31] |
Shi H, Liu X H, Chen Z F, et al. 2019. Eco-environmental problems and their solution strategy for large-scale land consolidation and development in Mu Us Sandy Land of Yulin in North Shaanxi. Chinese Journal of Ecology, 38(7): 2228-2235. (in Chinese)
|
|
|
| [32] |
Shi L, Fan H J, Yang L Y, et al. 2023. NDVI-based spatial and temporal vegetation trends and their response to precipitation and temperature changes in the Mu Us Desert from 2000 to 2019. Water Science & Technology, 88(2): 430-442.
|
|
|
| [33] |
Sun C, Bai X L, Wang X P, et al. 2024. Response of vegetation variation to climate change and human activities in the Shiyang River Basin of China during 2001-2022. Journal of Arid Land, 16(8): 1044-1061.
doi: 10.1007/s40333-024-0059-2
|
|
|
| [34] |
Sun Z H, Mao Z G, Yang L Y, et al. 2021. Impacts of climate change and afforestation on vegetation dynamic in the Mu Us Desert, China. Ecological Indicators, 129: 108020, doi: 10.1016/j.ecolind.2021.108020.
|
|
|
| [35] |
Teeuwen R, Milias V, Bozzon A, et al. 2024. How well do NDVI and OpenStreetMap data capture people's visual perceptions of urban greenspace? Landscape and Urban Planning, 245: 105009, doi: 10.1016/j.landurbplan.2024.105009.
|
|
|
| [36] |
Tong C F, Hou H F, Zheng H X, et al. 2024. A coupled model for forecasting spatiotemporal variability of regional drought in the Mu Us Sandy Land using a meta-heuristic algorithm. Land, 13(11): 1731, doi: 10.3390/land13111731.
|
|
|
| [37] |
Wang H, Li Z H, Chen L, et al. 2024a. The disparity in Normalized Difference Vegetarian Index response to climate warming and humidification in the Tibetan Plateau before and after 1998. Remote Sensing, 16(12): 2121, doi: 10.3390/rs16122121.
|
|
|
| [38] |
Wang X M, Ge Q S, Geng X, et al. 2023. Unintended consequences of combating desertification in China. Nature Communications, 14(1): 1139, doi: 10.1038/s41467-023-36835-z.
pmid: 36854712
|
|
|
| [39] |
Wang Y, Li S H, Yi S W, et al. 2024b. Multiple age control of young nebkhas in the Mu Us dune field, north-central China. Quaternary Geochronology, 82: 101531, doi: 10.1016/j.quageo.2024.101531.
|
|
|
| [40] |
Water Resources Department of Inner Mongolia Autonomous Region. 2002-2021. Inner Mongolia Water Resources Bulletin. Hohhot: Water Resources Department of Inner Mongolia Autonomous Region. (in Chinese)
|
|
|
| [41] |
Wu B, Ci L J. 2002. Landscape change and desertification development in the Mu Us Sandland, northern China. Journal of Arid Environments, 50(3): 429-444.
|
|
|
| [42] |
Xu D Y, Li C L, Song X, et al. 2014. The dynamics of desertification in the farming-pastoral region of North China over the past 10 years and their relationship to climate change and human activity. CATENA, 123: 11-22.
|
|
|
| [43] |
Xu Z N, Liang W, Lei J H, et al. 2025. Monitoring and assessment of desertification reversal in ecologically fragile areas: A case study of the Mu Us Sandy Land. Journal of Environmental Management, 373: 123695, doi: 10.1016/j.jenvman.2024.123695.
|
|
|
| [44] |
Xu Z W, Lu H Y. 2021. Aeolian environmental change studies in the Mu Us Sandy Land, north-central China: Theory and recent progress. Acta Geographica Sinica, 76(9): 2203-2223. (in Chinese)
doi: 10.11821/dlxb202109012
|
|
|
| [45] |
Yan F, Wu B, Wang Y J. 2015. Estimating spatiotemporal patterns of aboveground biomass using Landsat TM and MODIS images in the Mu Us Sandy Land, China. Agricultural and Forest Meteorology, 200: 119-128.
|
|
|
| [46] |
Zhang H, Guo J T, Li X T, et al. 2023. Spatiotemporal variation in and responses of the NDVI to climate in western Ordos and eastern Alxa. Sustainability, 15(5): 4375, doi: 10.3390/su15054375.
|
|
|
| [47] |
Zhang H B, Tang H J, Yang G X, et al. 2009. Changes of spatial-temporal characteristics based on MODIS NDVI data in Inner Mongolia grassland from 2000 to 2008. Transactions of the Chinese Society of Agricultural Engineering, 25(9): 168-175. (in Chinese)
|
|
|
| [48] |
Zhang M M, Wu X Q. 2020. The rebound effects of recent vegetation restoration projects in Mu Us Sandy Land of China. Ecological Indicators, 113: 106228, doi: 10.1016/j.ecolind.2020.106228.
|
|
|
| [49] |
Zhao H Y, Yan C Z, Li S, et al. 2023a. Remote sensing monitoring of the recent rapid increase in cultivation activities and its effects on desertification in the Mu Us Desert, China. Journal of Arid Land, 15(7): 812-826.
|
|
|
| [50] |
Zhao L L, Li L S, Li Y B, et al. 2023b. Monitoring vegetation drought in the nine major river basins of China based on a new developed Vegetation Drought Condition Index. Journal of Arid Land, 15(12): 1421-1438.
|
|
|
| [51] |
Zhao Z Y, Liu X M, Liu T X, et al. 2024. Analysis of spatial and temporal trends of vegetation cover evolution and its driving forces from 2000 to 2020—A case study of the WuShen counties in the Maowusu Sandland. Forests, 15(10): 1762, doi: 10.3390/f15101762.
|
|
|
| [52] |
Zhou Y T, Liu F G, Zhang G M, et al. 2024. Response of the Normalized Difference Vegetation Index (NDVI) to snow cover changes on the Qinghai-Tibet Plateau. Remote Sensing, 16(12): 2140, doi: 10.3390/rs16122140.
|
|
|
|
Viewed |
|
|
|
Full text
|
|
|
|
|
Abstract
|
|
|
|
|
Cited |
|
|
|
|
| |
Shared |
|
|
|
|
| |
Discussed |
|
|
|
|