| Research article |
|

|
|
|
| Driving mechanism and nonlinear threshold identification of vegetation in China: Based on causal inference and machine learning |
ZHANG Houtian1, WANG Shidong2,*( ), DING Junjie3 ), DING Junjie3 |
1School of Intelligent Construction and Civil Engineering, Luoyang Institute of Science and Technology, Luoyang 471023, China
2School of Surveying and Land Information Engineering, Henan Polytechnic University, Jiaozuo 454000, China
3Yellow River Engineering Consulting Co., Ltd., Zhengzhou 450003, China |
|
|
|
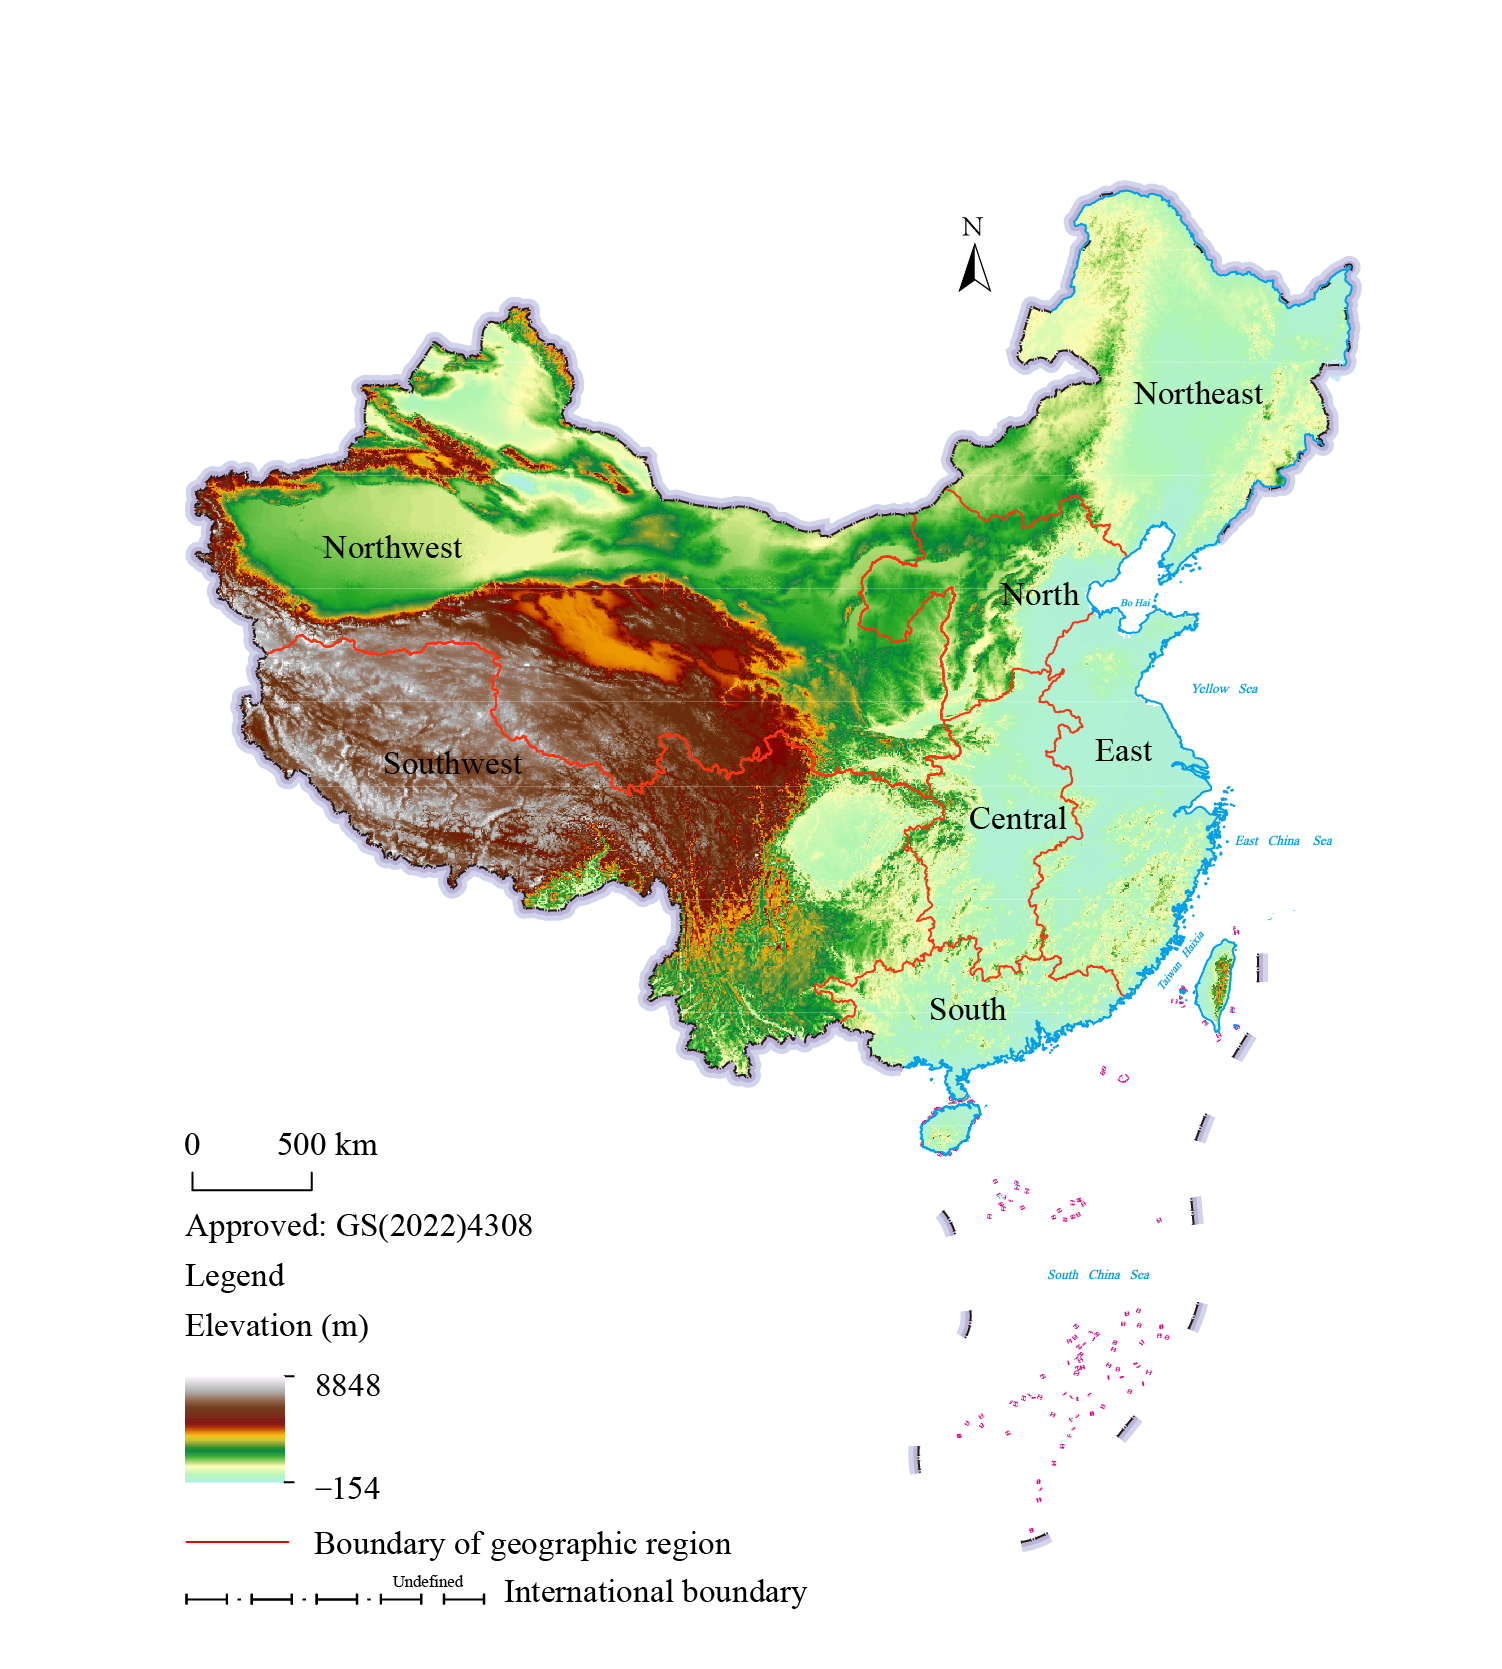
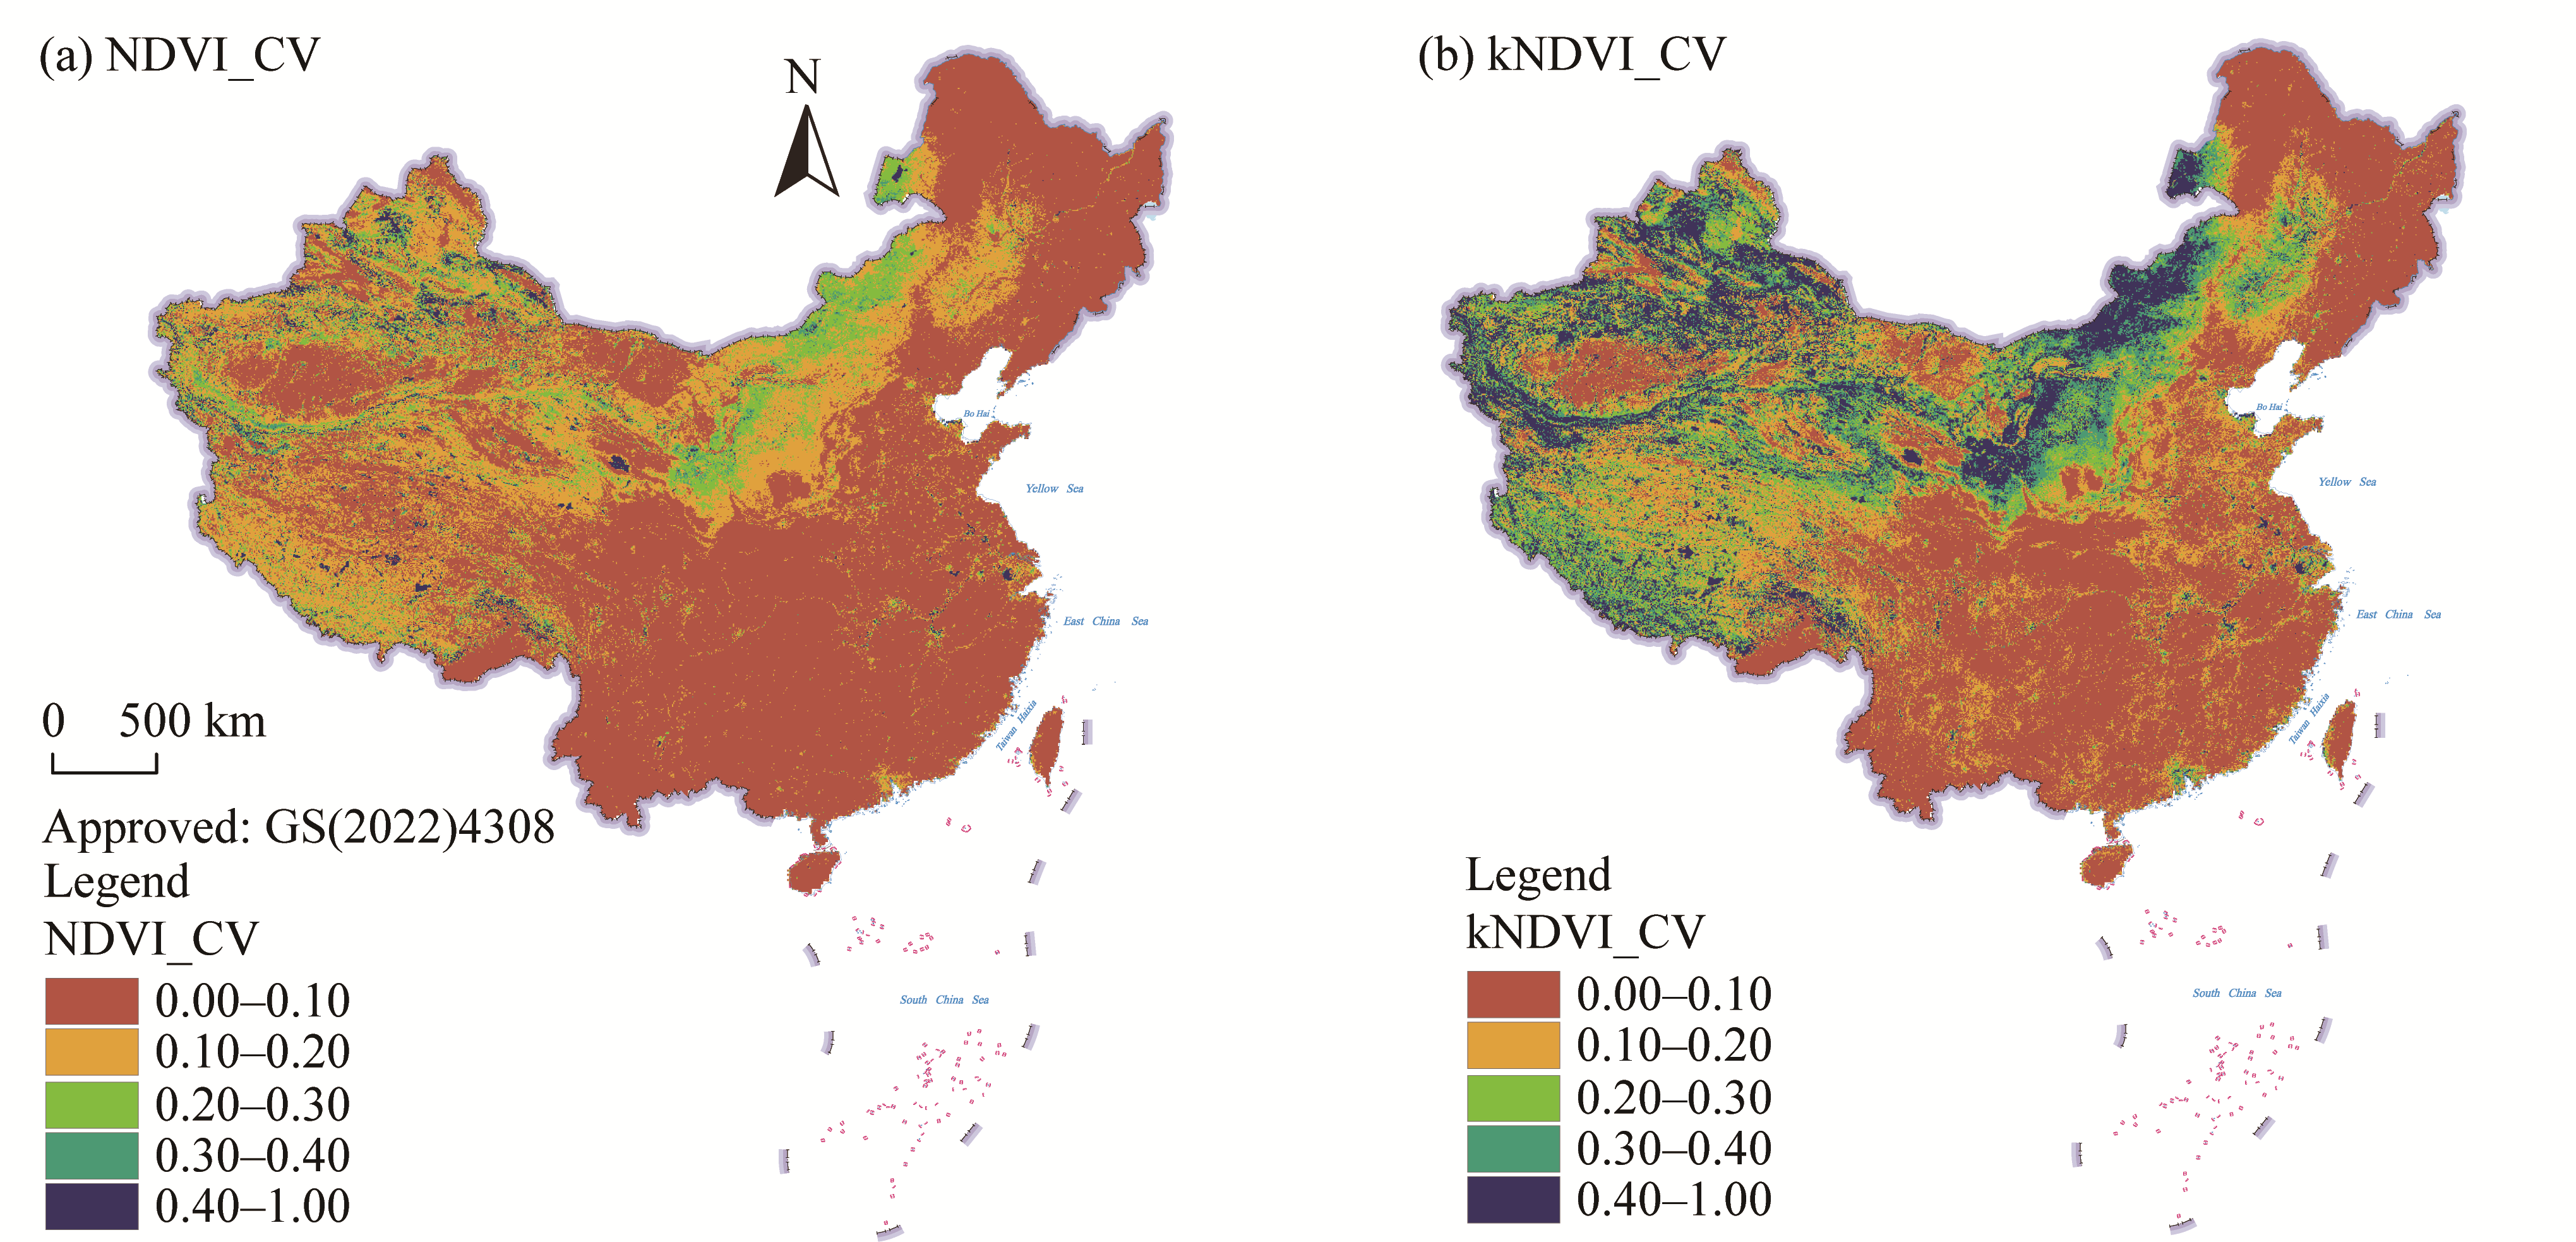
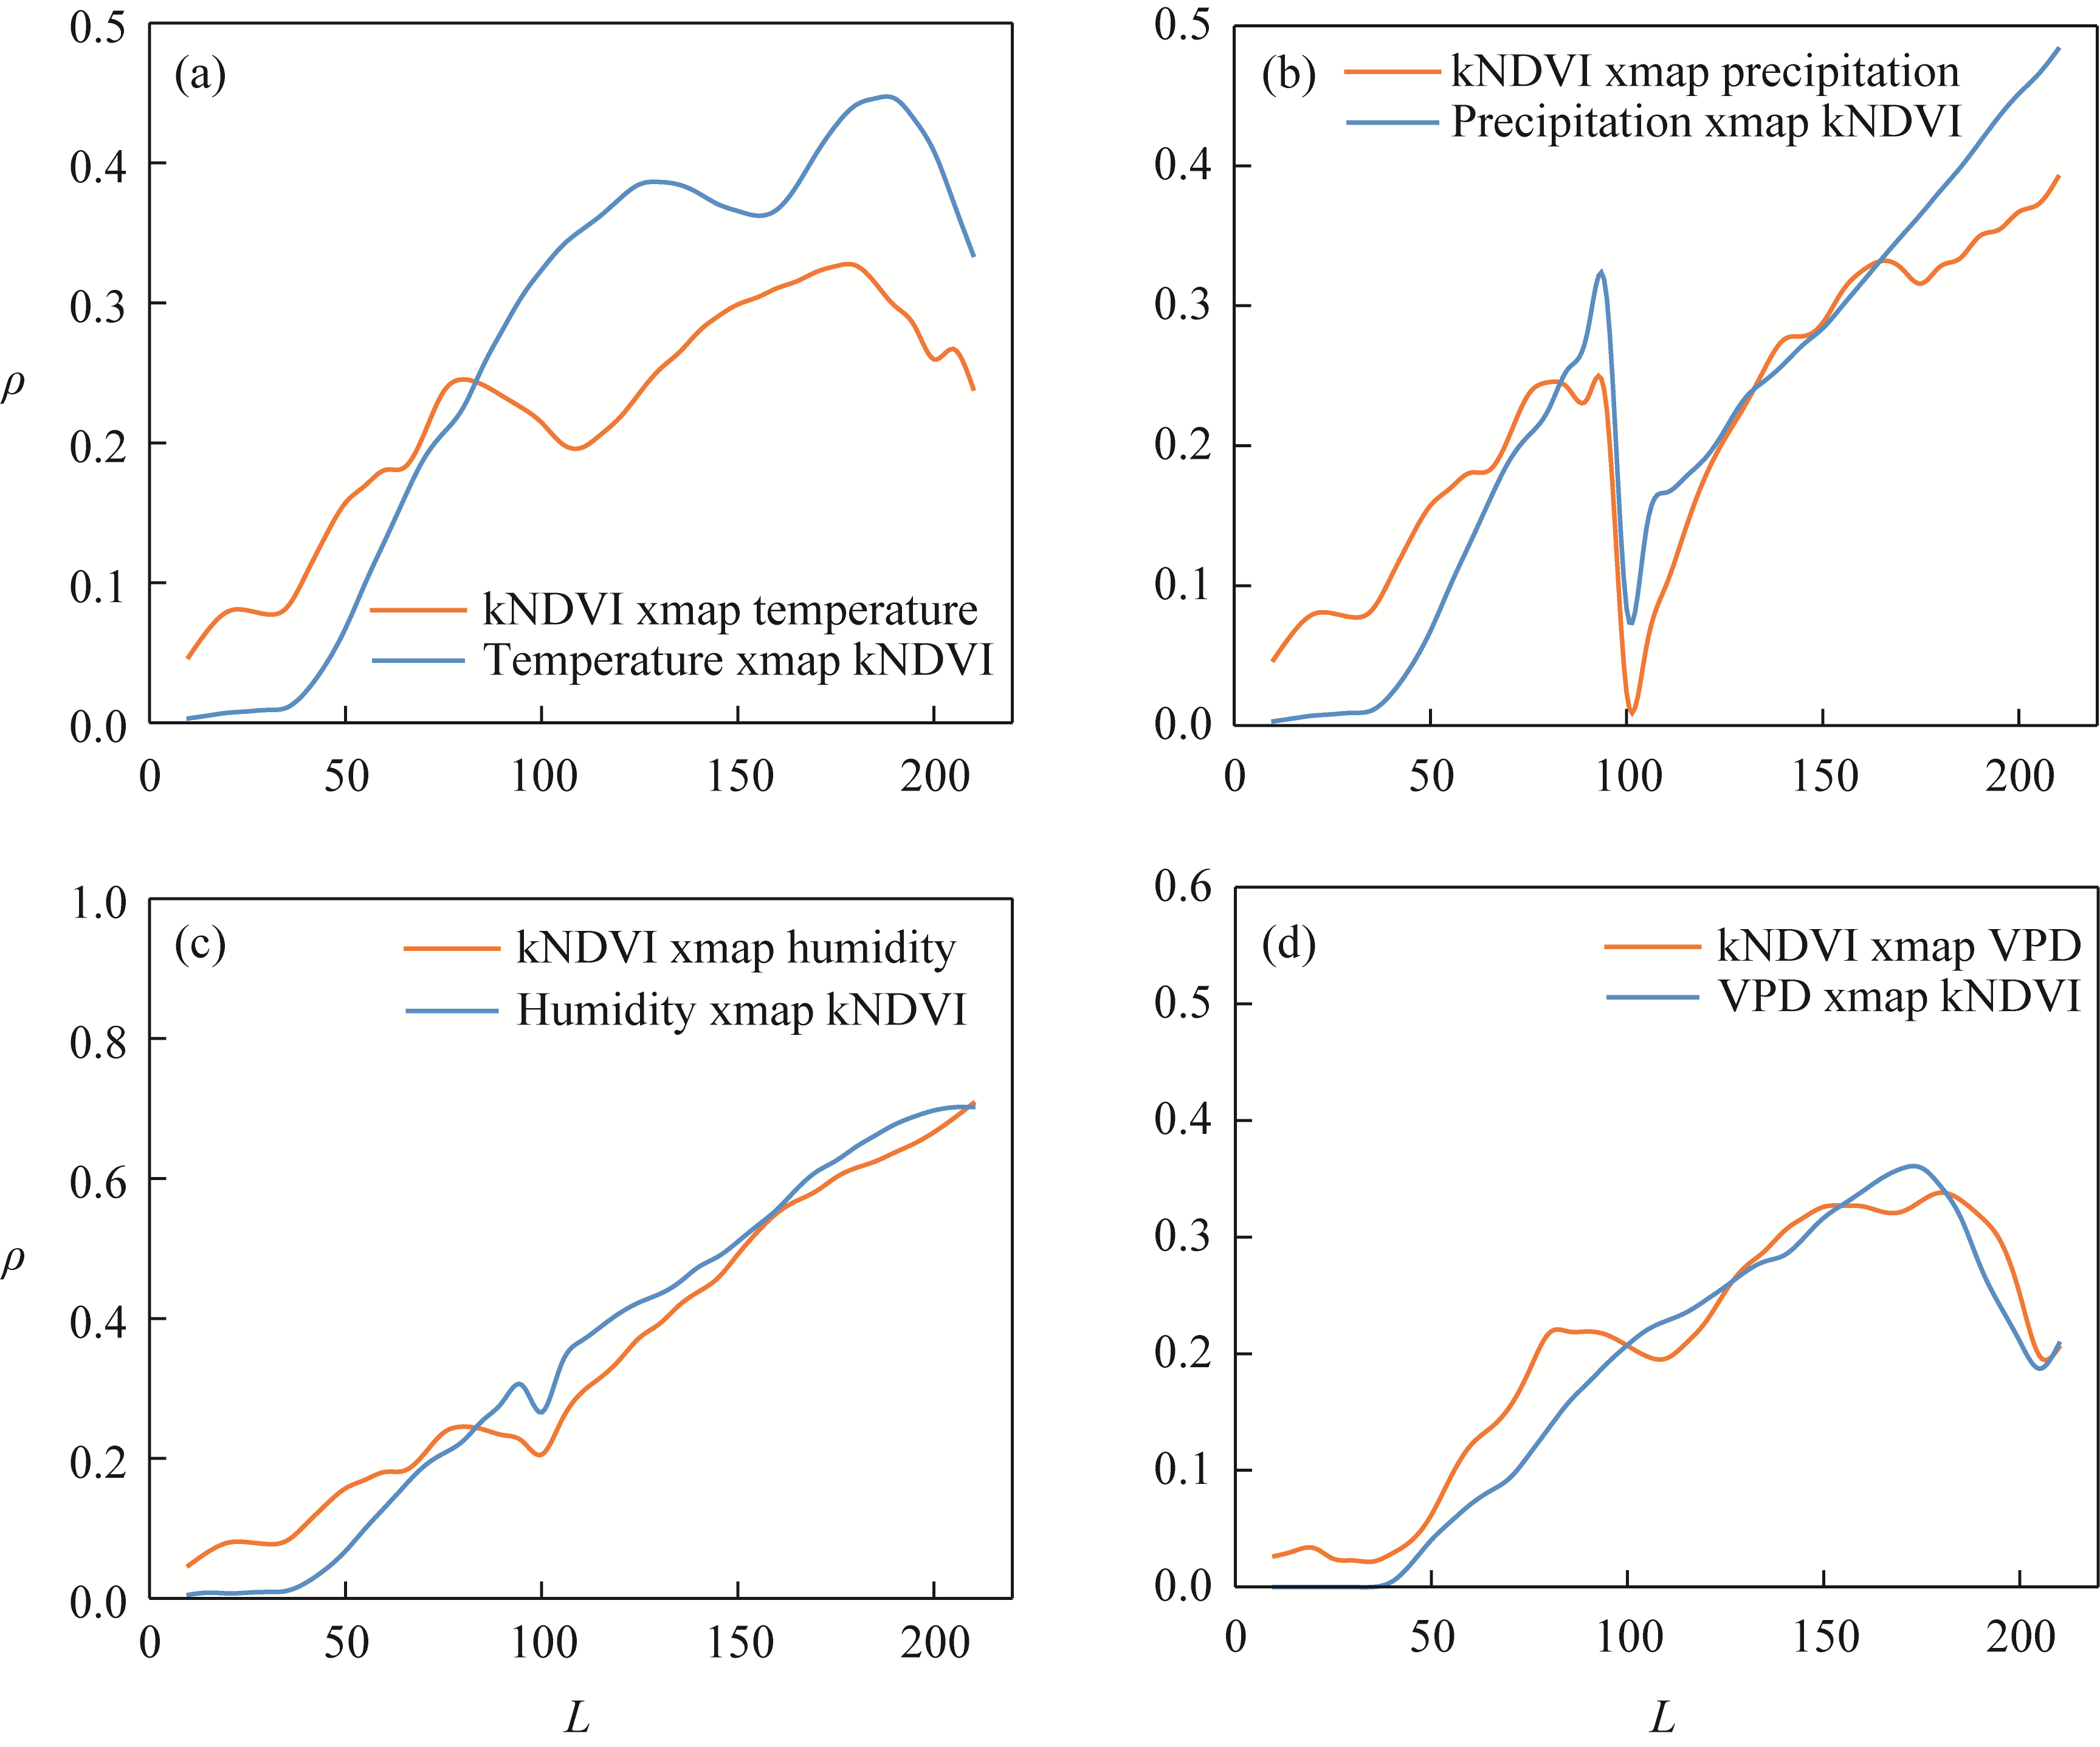
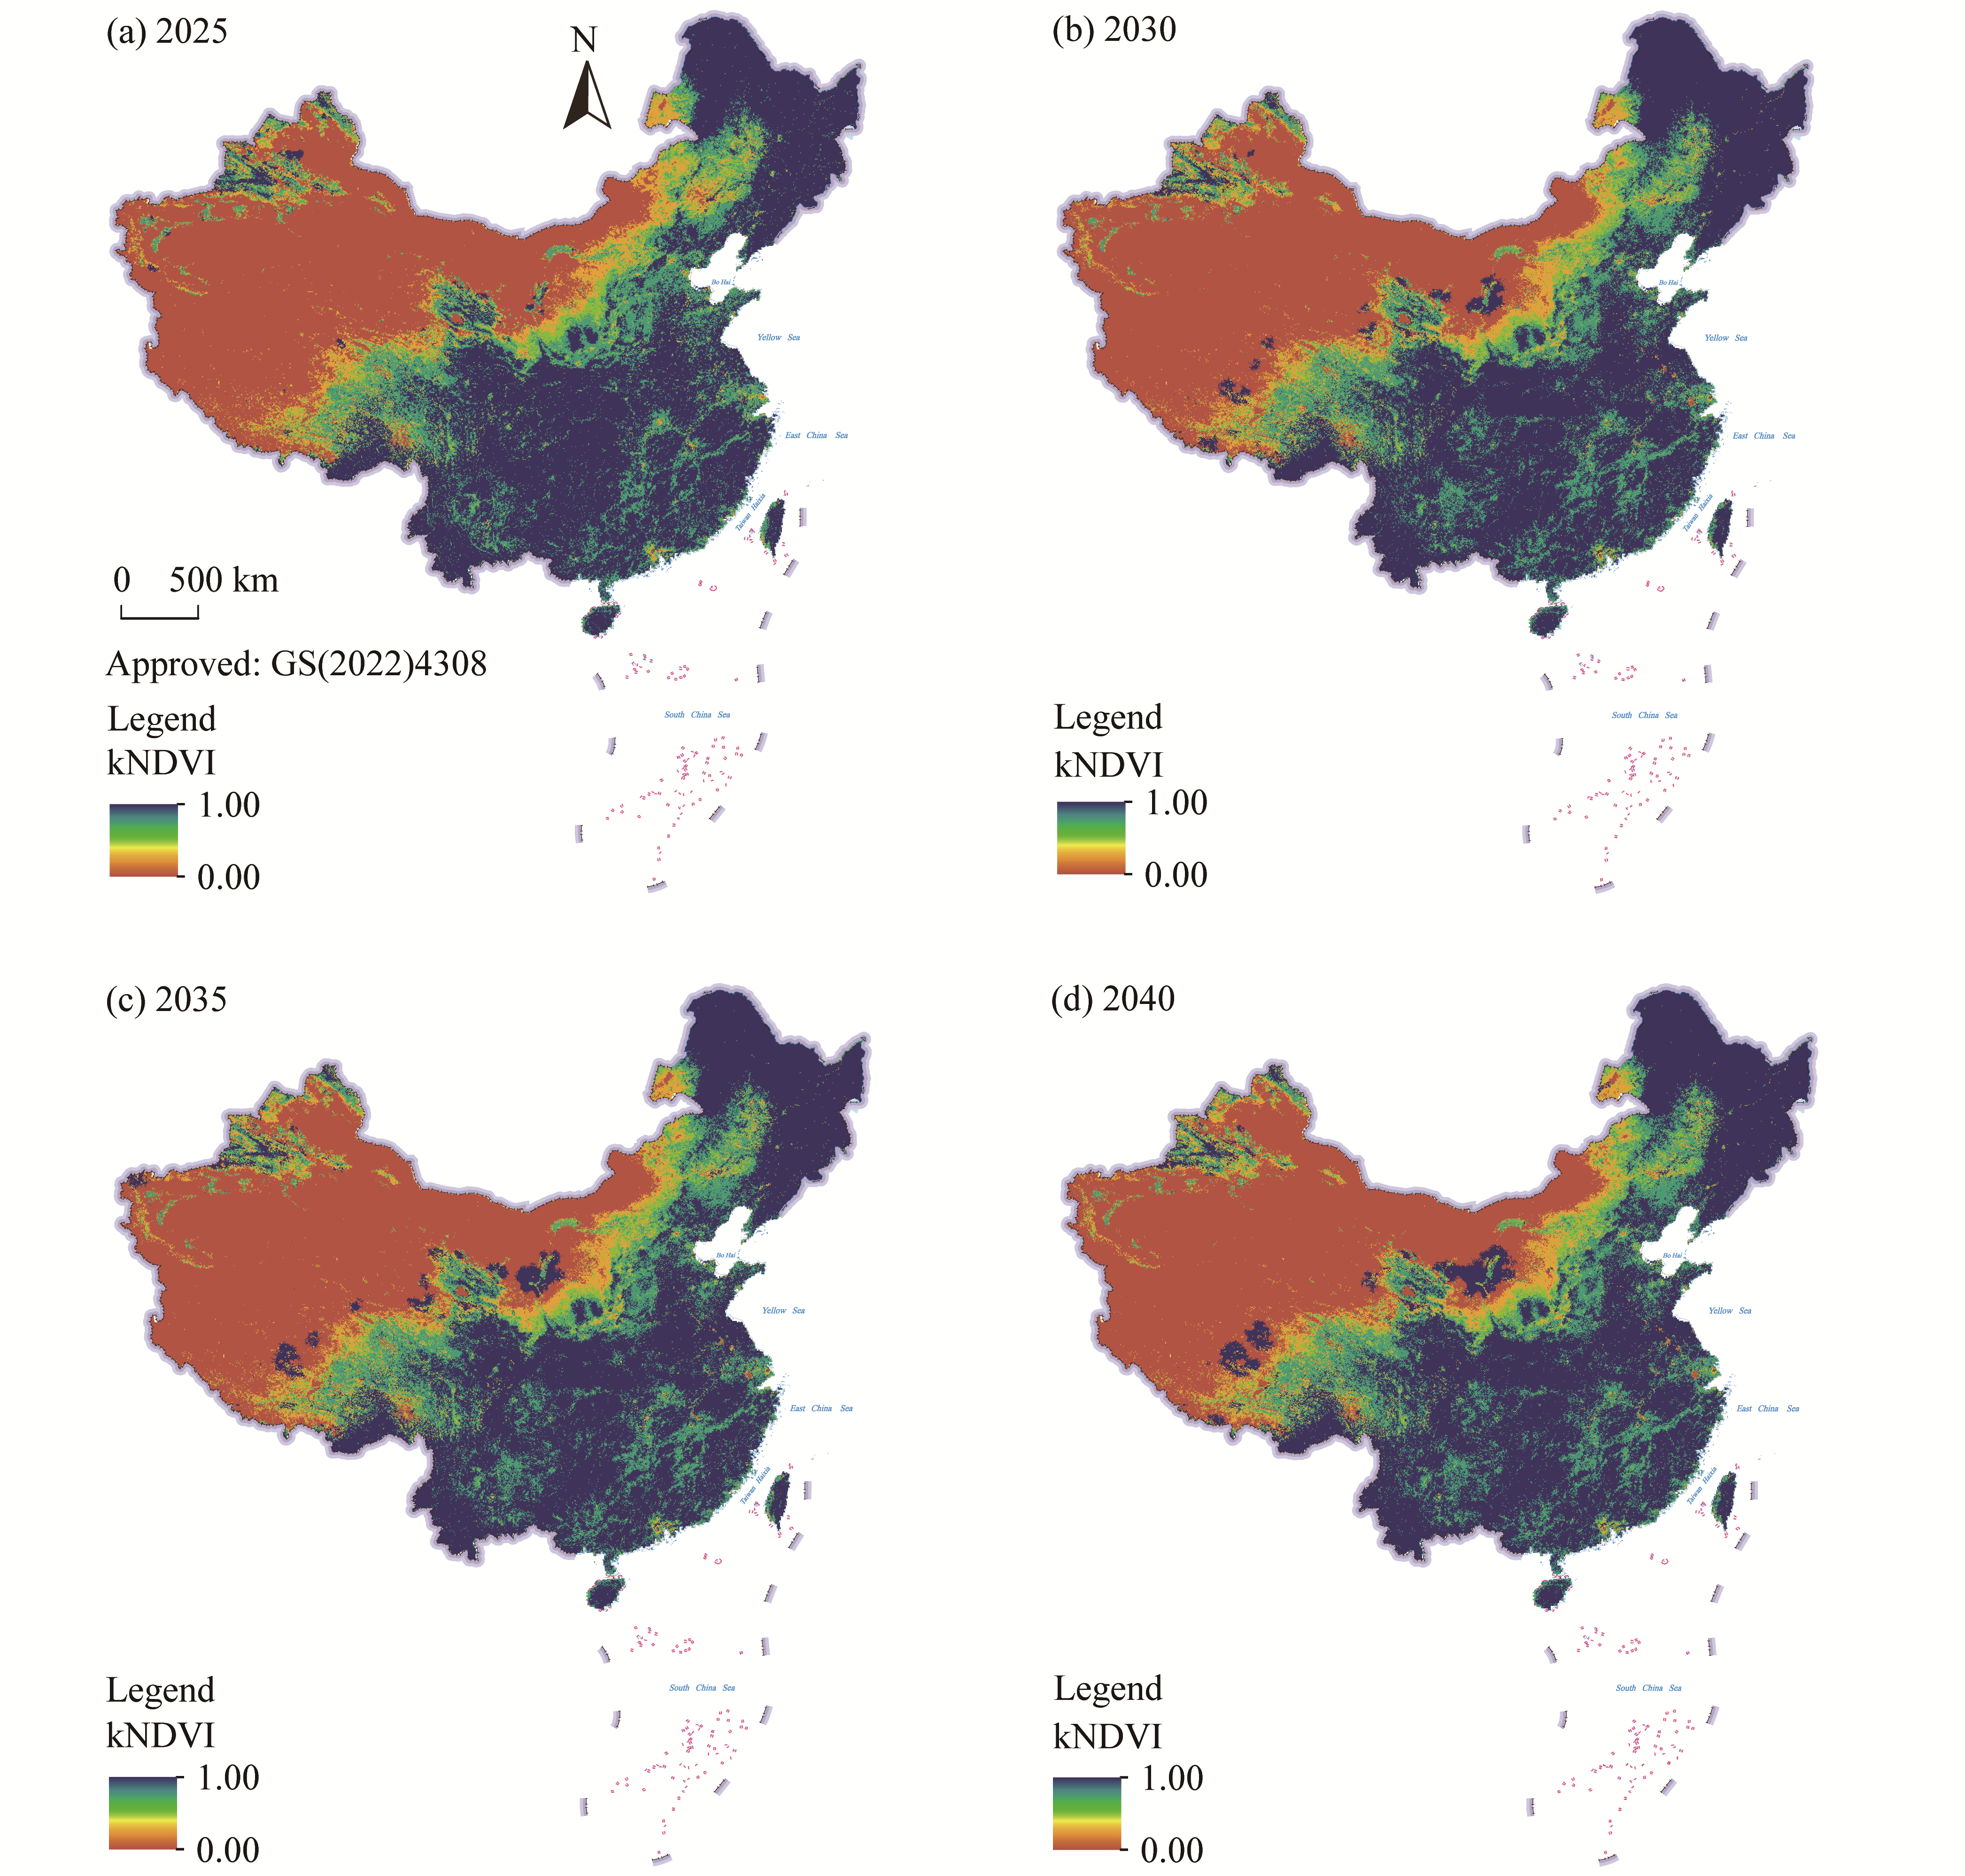
Abstract Climate change significantly affects vegetation dynamics. Thus, understanding interactions between vegetation and climatic factors is essential for ecological management. This study used kernel Normalized Difference Vegetation Index (kNDVI) and climatic data (temperature, precipitation, humidity, and vapor pressure deficit (VPD)) of China from 2000 to 2022, integrating Geographic Convergent Cross Mapping (GCCM) causal modeling, Extreme Gradient Boosting-Shapley Additive Explanations (XGBoost-SHAP) nonlinear threshold identification, and Geographical Simulation and Optimization Systems-Future Land Use Simulation (GeoSOS-FLUS) spatial prediction modeling to investigate vegetation spatiotemporal characteristics, driving mechanisms, nonlinear thresholds, and future spatial patterns. Results indicated that from 2000 to 2022, China's kNDVI showed an overall increasing trend (annual average ranging from 0.29 to 0.33) with distinct spatial differentiation: 52.77% of areas locating in agricultural and ecological restoration regions in the central-eastern plain) experienced vegetation improvement, whereas 2.68% of areas locating in the southeastern coastal urbanized regions and the Yangtze River Delta experience vegetation degradation. The coefficient of variation (CV) of kNDVI at 0.30-0.40 (accounting for 10.61%) was significantly higher than that of NDVI (accounting for 1.80%). Climate-driven mechanisms exhibited notable library length (L) dependence. At short-term scales (L<50), vegetation-driven transpiration regulated local microclimate, with a causal strength from kNDVI to temperature of 0.04-0.15; at long-term scales (L>100), cumulative temperature effects dominated vegetation dynamics, with a causal strength from temperature to kNDVI of 0.33. Humidity and kNDVI formed bidirectional positive feedback at long-term scales (L=210, causal strength>0.70), whereas the long-term suppressive effect of VPD was particularly pronounced (causal strength=0.21) in arid areas. The optimal threshold intervals identified were temperature at -12.18°C-0.67°C, precipitation at 24.00-159.74 mm, humidity of lower than 22.00%, and VPD of <0.07, 0.17-0.24, and >0.30 kPa; notably, the lower precipitation threshold (24.00 mm) represented the minimum water requirements for vegetation recovery in arid areas. Future kNDVI spatial patterns are projected to continue the trend of "southeastern optimization and northwestern delay" from 2025 to 2040: the area proportion of high kNDVI value (>0.50) will rise from 40.43% to 41.85%, concentrated in the Sichuan Basin and the southern hills; meanwhile, the proportion of low-value areas of kNDVI (0.00-0.10) in the arid northwestern areas will decline by only 1.25%, constrained by sustained temperature and VPD stress. This study provides a scientific basis for vegetation dynamic regulation and sustainable development under climate change.
|
|
Received: 31 May 2025
Published: 31 October 2025
|
|
Corresponding Authors:
*WANG Shidong (E-mail: wsd0908@hpu.edu.cn)
|
|
|
| [1] |
Abatzoglou J T, Dobrowski S Z, Parks S A, et al. 2018. TerraClimate, a high-resolution global dataset of monthly climate and climatic water balance from 1958-2015. Scientific Data, 5: 170191, doi: 10.1038/sdata.2017.191.
|
|
|
| [2] |
Allen C D, Breshears D D, McDowell N G. 2015. On underestimation of global vulnerability to tree mortality and forest die-off from hotter drought in the Anthropocene. Ecosphere, 6(8): 1-55.
|
|
|
| [3] |
Allouche O, Tsoar A, Kadmon R. 2006. Assessing the accuracy of species distribution models: prevalence, kappa and the true skill statistic (TSS). Journal of Applied Ecology, 43(6): 1223-1232.
|
|
|
| [4] |
Atkeson C G, Moore A W, Schaal S. 1997. Locally weighted learning for control. Artificial Intelligence Review, 11: 75-113.
|
|
|
| [5] |
Bonan G. 2015. Ecological Climatology:Concepts and Applications (3rd ed). Cambridge: Cambridge University Press, 156-158, 199-201.
|
|
|
| [6] |
Breiman L. 2001. Random forests. Machine Learning, 45: 5-32.
|
|
|
| [7] |
Camps-Valls G, Campos-Taberner M, Moreno-Martínez Á, et al. 2021. A unified vegetation index for quantifying the terrestrial biosphere. Science Advances, 7(9): eabc7447, doi: 10.1126/sciadv.abc7447.
|
|
|
| [8] |
Chen T Q, Guestrin C. 2016. XGBoost:A scalable tree boosting system. In:Proceedings of the 22nd ACM SIGKDD International Conference on Knowledge Discovery and Data Mining. Association for Computing Machinery. New York, USA, 785-794.
|
|
|
| [9] |
Chen T T, Peng L, Wang Y X. 2024. Prediction of global water use efficiency and its response to vapor pressure deficit and soil moisture coupling in the 21st century. Journal of Hydrology, 635: 131203, doi: 10.1016/j.jhydrol.2024.131203.
|
|
|
| [10] |
Chen Z Y, Chen D L, Zhao C F, et al. 2020. Influence of meteorological conditions on PM2.5 concentrations across China: A review of methodology and mechanism. Environment International, 139: 105558, doi: 10.1016/j.envint.2020.105558.
|
|
|
| [11] |
Cortes C, Vapnik V N. 1995. Support-vector networks. Machine Learning, 20(3): 273-297.
|
|
|
| [12] |
Dong L, Zhao J, Liu X J, et al. 2019. Responses of vegetation growth to temperature during 1982-2015 in Xinjiang, China. Chinese Journal of Applied Ecology, 30(7): 2165-2170. (in Chinese)
doi: 10.13287/j.1001-9332.201907.023
|
|
|
| [13] |
Du J J, Wei P J, Bahadur A, et al. 2025. The impacts of revegetation on ecosystem services in the extremely degraded alpine grassland of permafrost regions. Sustainability, 17(4): 1512, doi: 10.3390/su17041512.
|
|
|
| [14] |
Fanourakis D, Aliniaeifard S, Sellin A, et al. 2020. Stomatal behavior following mid- or long-term exposure to high relative air humidity: A review. Plant Physiology and Biochemistry, 153: 92-105.
doi: S0981-9428(20)30256-4
pmid: 32485617
|
|
|
| [15] |
Feng X J, Tian J, Wang Y X, et al. 2023. Spatio-temporal variation and climatic driving factors of vegetation coverage in the Yellow River Basin from 2001 to 2020 based on kNDVI. Forests, 14(3): 620, doi: 10.3390/f14030620.
|
|
|
| [16] |
Gao B G, Yang J Y, Chen Z Y, et al. 2023. Causal inference from cross-sectional earth system data with geographical convergent cross mapping. Nature Communications, 14: 5875, doi: 10.1038/s41467-023-41619-6.
pmid: 37735466
|
|
|
| [17] |
Ghanem M E, Kehel Z, Marrou H, et al. 2020. Seasonal and climatic variation of weighted VPD for transpiration estimation. European Journal of Agronomy, 113: 125966, doi: 10.1016/j.eja.2019.125966.
|
|
|
| [18] |
Gong Y, Staudhammer C L, Wiesner S, et al. 2022. Uncertainty in parameterizing a flux-based model of vegetation carbon phenology using ecosystem respiration. Ecosphere, 13(5): e4101, doi: 10.1002/ecs2.4101.
|
|
|
| [19] |
Grace J B, Schoolmaster D R, Guntenspergen G R, et al. 2012. Guidelines for a graph-theoretic implementation of structural equation modeling. Ecosphere, 3(8): 1-44.
|
|
|
| [20] |
Granger C W J. 1969. Investigating causal relations by econometric models and cross-spectral methods. Econometrica, 37(3): 424-438.
|
|
|
| [21] |
Guo H W, Zhu C, Li S, et al. 2019. Manhattan distance based inter-frame weighted prediction algorithm. Journal of Beijing University of Aeronautics and Astronautics, 45(12): 2415-2422. (in Chinese)
|
|
|
| [22] |
Han L Y, Lu L L, Fu P, et al. 2023a. Exploring the seasonality of surface urban heat islands using enhanced land surface temperature in a semi-arid city. Urban Climate, 49: 101455, doi: 10.1016/j.uclim.2023.101455.
|
|
|
| [23] |
Han Y, Lin Y L, Zhou P, et al. 2023b. Assessing dynamic changes, driving mechanisms and predictions of multisource vegetation remote sensing products in Chinese regions. Applied Sciences, 13(9): 5229, doi: 10.3390/app13095229.
|
|
|
| [24] |
Harris R B. 2010. Rangeland degradation on the Qinghai-Tibetan Plateau: A review of the evidence of its magnitude and causes. Journal of Arid Environments, 74(1): 1-12.
|
|
|
| [25] |
Hassani H, Ghodsi M, Huang X, et al. 2021. Is there a causal relationship between oil prices and tourist arrivals? Journal of Applied Statistics, 48(1): 191-202.
doi: 10.1080/02664763.2020.1720625
pmid: 35707238
|
|
|
| [26] |
He L, Yuan Y, He Z W, et al. 2025. Spatiotemporal variations of vegetation NPP based on GF-SG and kNDVI and its response to climate change and human activities: A case study of the Zoigê Plateau. Forests, 16(1): 32, doi: 10.3390/f16010032.
|
|
|
| [27] |
Hua F Y, Wang X Y, Zheng X L, et al. 2016. Opportunities for biodiversity gains under the world's largest reforestation programme. Nature Communications, 7: 12717, doi: 10.1038/ncomms12717.
pmid: 27598524
|
|
|
| [28] |
Huang M T, Piao S L, Sun Y, et al. 2015. Change in terrestrial ecosystem water-use efficiency over the last three decades. Global Change Biology, 21(6): 2366-2378.
doi: 10.1111/gcb.12873
pmid: 25612078
|
|
|
| [29] |
Huang X B, Liu X S, Jin Y H, et al. 2025. Identification and attribution analysis of integrated ecological zones based on the XGBoost-SHAP model: A case study of Chengdu, China. Ecological Indicators, 177: 113787, doi: 10.1016/j.ecolind.2025.113787.
|
|
|
| [30] |
Huete A, Didan K, Miura T, et al. 2002. Overview of the radiometric and biophysical performance of the MODIS vegetation indices. Remote Sensing of Environment, 83(1-2): 195-213.
|
|
|
| [31] |
Kaikkonen L, Parviainen T, Rahikainen M, et al. 2021. Bayesian networks in environmental risk assessment: A review. Integrated Environmental Assessment and Management, 17(1): 62-78.
|
|
|
| [32] |
Keenan T F, Hollinger D Y, Bohrer G, et al. 2013. Increase in forest water-use efficiency as atmospheric carbon dioxide concentrations rise. Nature, 499(7458): 324-327.
|
|
|
| [33] |
Lecun Y, Bengio Y, Hinton G. 2015. Deep learning. Nature, 521(7553): 436-444.
|
|
|
| [34] |
Li D, Wang S F. 2025. Widespread underestimation of ecosystem water use efficiency in CMIP 6 models. Journal of Hydrology, 650: 132558, doi: 10.1016/j.jhydrol.2024.132558.
|
|
|
| [35] |
Li M Y, Cao S, Zhu Z C, et al. 2023a. Spatiotemporally consistent global dataset of the GIMMS Normalized Difference Vegetation Index (PKU GIMMS NDVI) from 1982 to 2022. Earth System Science Data, 15(9): 4181-4203.
|
|
|
| [36] |
Li X, Yu K X, Zhang X, et al. 2023b. Spatial and temporal evolutionary characteristics of vegetation in different geomorphic zones of Loess Plateau and its driving factor analysis. Sustainability, 15(16): 12200, doi: 10.3390/su151612200.
|
|
|
| [37] |
Li X W, Shi L X, Shi Y, et al. 2024a. Exploring interactive and nonlinear effects of key factors on intercity travel mode choice using XGBoost. Applied Geography, 166: 103264, doi: 10.1016/j.apgeog.2024.103264.
|
|
|
| [38] |
Li Y J. 2006. Network topology identification based on Manhattan distance. Computer Science, 33(11): 31-33. (in Chinese)
|
|
|
| [39] |
Li Z, Jiang W G, Peng K F, et al. 2024b. Comparative analysis of land use change prediction models for land and fine wetland types: Taking the wetland cities Changshu and Haikou as examples. Landscape and Urban Planning, 243: 104975, doi: 10.1016/j.landurbplan.2023.104975.
|
|
|
| [40] |
Liu X P, Liang X, Li X, et al. 2017. A future land use simulation model (FLUS) for simulating multiple land use scenarios by coupling human and natural effects. Landscape and Urban Planning, 168: 94-116.
|
|
|
| [41] |
Liu X Y, Wei M, Li Z G, et al. 2022. Multi-scenario simulation of urban growth boundaries with an ESP-FLUS model: A case study of the Min Delta region, China. Ecological Indicators, 135: 108538, doi: 10.1016/j.ecolind.2022.108538.
|
|
|
| [42] |
Liu Z J, Wei W T, Dong Y F, et al. 2025. Monitoring and influencing factors analysis of urban vegetation changes in the Plateau-Mountainous City. Forests, 16(8): 1339, doi: 10.3390/f16081339.
|
|
|
| [43] |
Lundberg S M, Lee S I. 2017. A unified approach to interpreting model predictions. In: Advances in Neural Information Processing Systems. Long Beach: NeurIPS, 4768-4777.
|
|
|
| [44] |
Novick K A, Ficklin D L, Stoy P C, et al. 2016. The increasing importance of atmospheric demand for ecosystem water and carbon fluxes. Nature Climate Change, 6(11): 1023-1027.
|
|
|
| [45] |
Peng S J, Zhang J, Zhang X L, et al. 2022. Conservation of woody species in China under future climate and land-cover changes. Journal of Applied Ecology, 59(1): 141-152.
|
|
|
| [46] |
Piao S L, Wang X H, Park T J, et al. 2019. Characteristics, drivers and feedbacks of global greening. Nature Reviews Earth & Environment, 1(1): 14-27.
|
|
|
| [47] |
Pirani A, Fuglestvedt J S, Byers E, et al. 2024. Scenarios in IPCC assessments: Lessons from AR6 and opportunities for AR7. npj Climate Action, 3(1): 1, doi: 10.1038/s44168-023-00082-1.
|
|
|
| [48] |
Polley H W. 2002. Implications of atmospheric and climatic change for crop yield and water use efficiency. Crop Science, 42(1): 131-140.
pmid: 11756263
|
|
|
| [49] |
Rudin C. 2019. Stop explaining black box machine learning models for high stakes decisions and use interpretable models instead. Nature Machine Intelligence, 1(5): 206-215.
doi: 10.1038/s42256-019-0048-x
pmid: 35603010
|
|
|
| [50] |
Seto K C, Güneralp B, Hutyra L R. 2012. Global forecasts of urban expansion to 2030 and direct impacts on biodiversity and carbon pools. Proceedings of the National Academy of Sciences, 109(40): 16083-16088.
|
|
|
| [51] |
Stepchenko A, Chizhov J. 2015. Applying Markov chains for NDVI time series forecasting of Latvian regions. Information Technology and Management Science, 18(1): 57-61.
|
|
|
| [52] |
Sugihara G, Robert M. 1990. Nonlinear forecasting as a way of distinguishing chaos from measurement error in time series. Nature, 344: 734-741.
|
|
|
| [53] |
Sugihara G, May R, Ye H, et al. 2012. Detecting causality in complex ecosystems. Science, 338(6106): 496-500.
doi: 10.1126/science.1227079
pmid: 22997134
|
|
|
| [54] |
Tong Y, Liu W, Li C G, et al. 2022. County town shrinkage in China: Identification, spatiotemporal variations and the heterogeneity of influencing factors. Journal of Rural Studies, 95: 350-361.
|
|
|
| [55] |
Tucker C J. 1979. Red and photographic infrared linear combinations for monitoring vegetation. Remote Sensing of Environment, 8(2): 127-150.
|
|
|
| [56] |
Wu H F, Zhang J Y, Bao Z X, et al. 2022. The impacts of natural and anthropogenic factors on vegetation change in the Yellow-Huai-Hai River Basin. Frontiers in Earth Science, 10: 959403, doi: 10.3389/feart.2022.959403.
|
|
|
| [57] |
Yadollahi P, Doostfatemeh M, Khalajinia Z, et al. 2025. Perceived social support, marital satisfaction, and resilience in women with abortion experience through structural equation modeling. Scientific Reports, 15: 332, doi: 10.1038/s41598-024-83485-2.
|
|
|
| [58] |
Zhang J, Wei L Q, Wang Y, et al. 2024. County town comprehensive service functions in China: Measurement, spatio-temporal divergence evolution, and heterogeneity of influencing factors. Sustainability, 16(6): 2869, doi: 10.3390/su16072869.
|
|
|
| [59] |
Zhang T, Xu X, Jiang H L, et al. 2022. Widespread decline in winds promoted the growth of vegetation. Science of the Total Environment, 825(615): 153682, doi: 10.1016/j.scitotenv.2022.153682.
|
|
|
| [60] |
Zhu K, Cheng Y F, Zang W Y, et al. 2023. Multiscenario simulation of land-use change in Hubei Province, China based on the Markov-FLUS Model. Land, 12(4): 744, doi: 10.3390/land12040744.
|
|
|
| [61] |
Zhu Z C, Piao S L, Myneni R B, et al. 2016. Greening of the Earth and its drivers. Nature Climate Change, 6: 791-795.
doi: 10.1038/NCLIMATE3004
|
|
|
|
Viewed |
|
|
|
Full text
|
|
|
|
|
Abstract
|
|
|
|
|
Cited |
|
|
|
|
| |
Shared |
|
|
|
|
| |
Discussed |
|
|
|
|