From structure to assembly processes: how salinity regulates soil bacterial communities in arid regions
MOU Na1,2,3, ZHANG Yu1,2,3, MA Jie1,3,*(), LIU Ran1,3, XU Guiqing1,3
1Key Laboratory of Ecological Safety and Sustainable Development in Arid Lands, Xinjiang Institute of Ecology and Geography, Chinese Academy of Sciences, Urumqi 830011, China 2University of Chinese Academy of Sciences, Beijing 100049, China 3Fukang National Field Scientific Observation and Research Station for Desert Ecosystems, Fukang 831505, China
Although salinity functions as a key environmental filter for soil microorganisms, its comprehensive effects on soil microbial community structure and assembly processes remain poorly understood, particularly in arid regions prone to salinization. In this study, soil bacterial communities along a natural salinity gradient at the edge of Ebinur Lake in Northwest China were investigated. Using 16S ribosomal RNA (16S rRNA) sequencing, we examined variations in soil bacterial community structure, co-occurrence patterns, and assembly mechanisms across different soil salinity groups, including lightly salinized soils (LSS), moderately salinized soils (MSS), and heavily salinized soils (HSS). The results showed that soil bacterial diversity varied significantly among salinity groups, with the highest value observed in LSS. Community dissimilarity increased notably with greater variations in salinity. Notably, a systematic shift in soil bacterial composition occurred along the salinity gradient, with salt-sensitive bacterial phyla (e.g., Acidobacteria and Gemmatimonadetes) being progressively replaced by salt-tolerant ones (e.g., Firmicutes and Bacteroidetes). Network analysis underscored that increased salinity led to reduced soil bacterial network complexity and stability. More positive correlations among soil bacteria occurred in HSS, suggesting a potential shift toward cooperative microbial strategies under severe salt stress. Moreover, the assembly processes governing soil bacterial communities transitioned from stochastic process, predominantly in LSS (71.43%) and MSS (80.00%), to deterministic process in HSS (66.66%). In summary, the results emphasize the multifaceted role of soil salinity in shaping soil bacterial communities in arid ecosystems, thereby enhancing the understanding of the impacts of soil salinization on soil microbial dynamics.
Received: 22 January 2026
Published: 31 August 2026
MOU Na, ZHANG Yu, MA Jie, LIU Ran, XU Guiqing. From structure to assembly processes: how salinity regulates soil bacterial communities in arid regions. Journal of Arid Land, 2026, 18(8): 1462-1479.
Fig. 1Layout of the experimental design (a) and representative landscape views of different soil salinity groups (b-d). A1-A9, B1-B9, and C1-C9 represent the sampling sites along the three transects. LSS, lightly salinized soils; MSS, moderately salinized soils; HSS, heavily salinized soils.
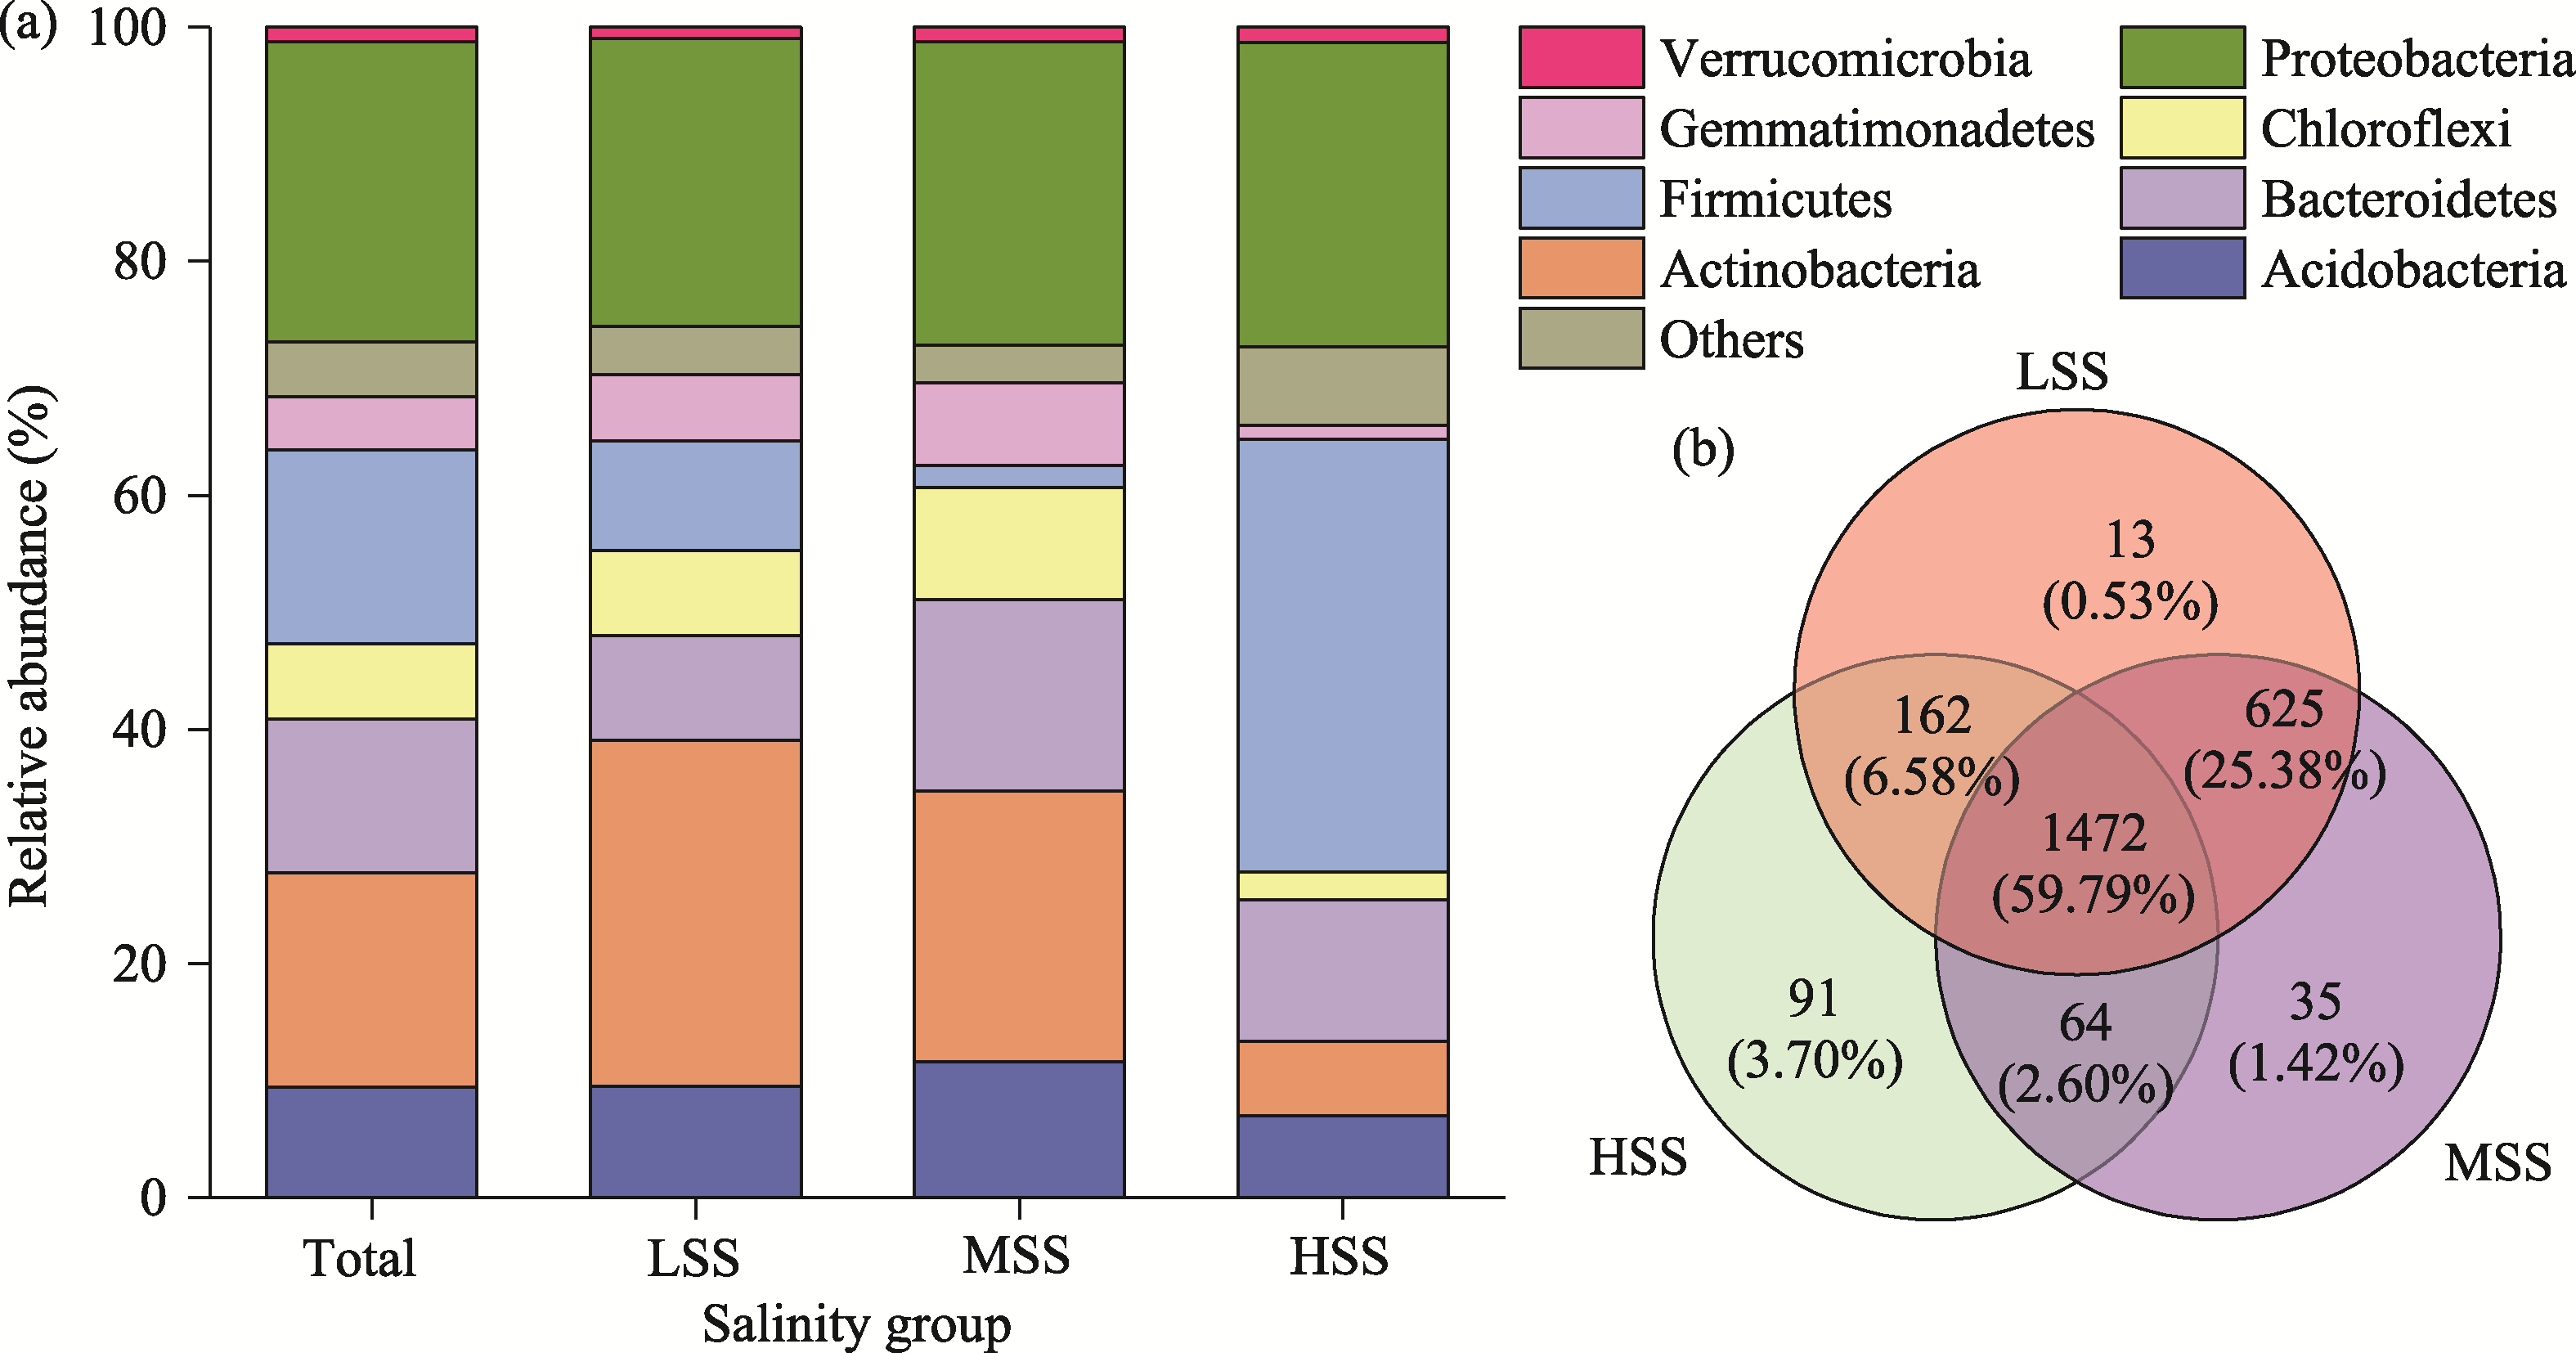
Fig. 2Soil bacterial community composition across three salinity groups. (a), average relative abundance of major bacterial phyla in total soil samples and soils across three salinity groups (LSS, MSS, and HSS); (b), Venn diagram showing shared and unique bacterial operational taxonomic units (OTUs) among the three salinity groups. The number and percentage of shared and unique OTUs are indicated in the Venn diagram.
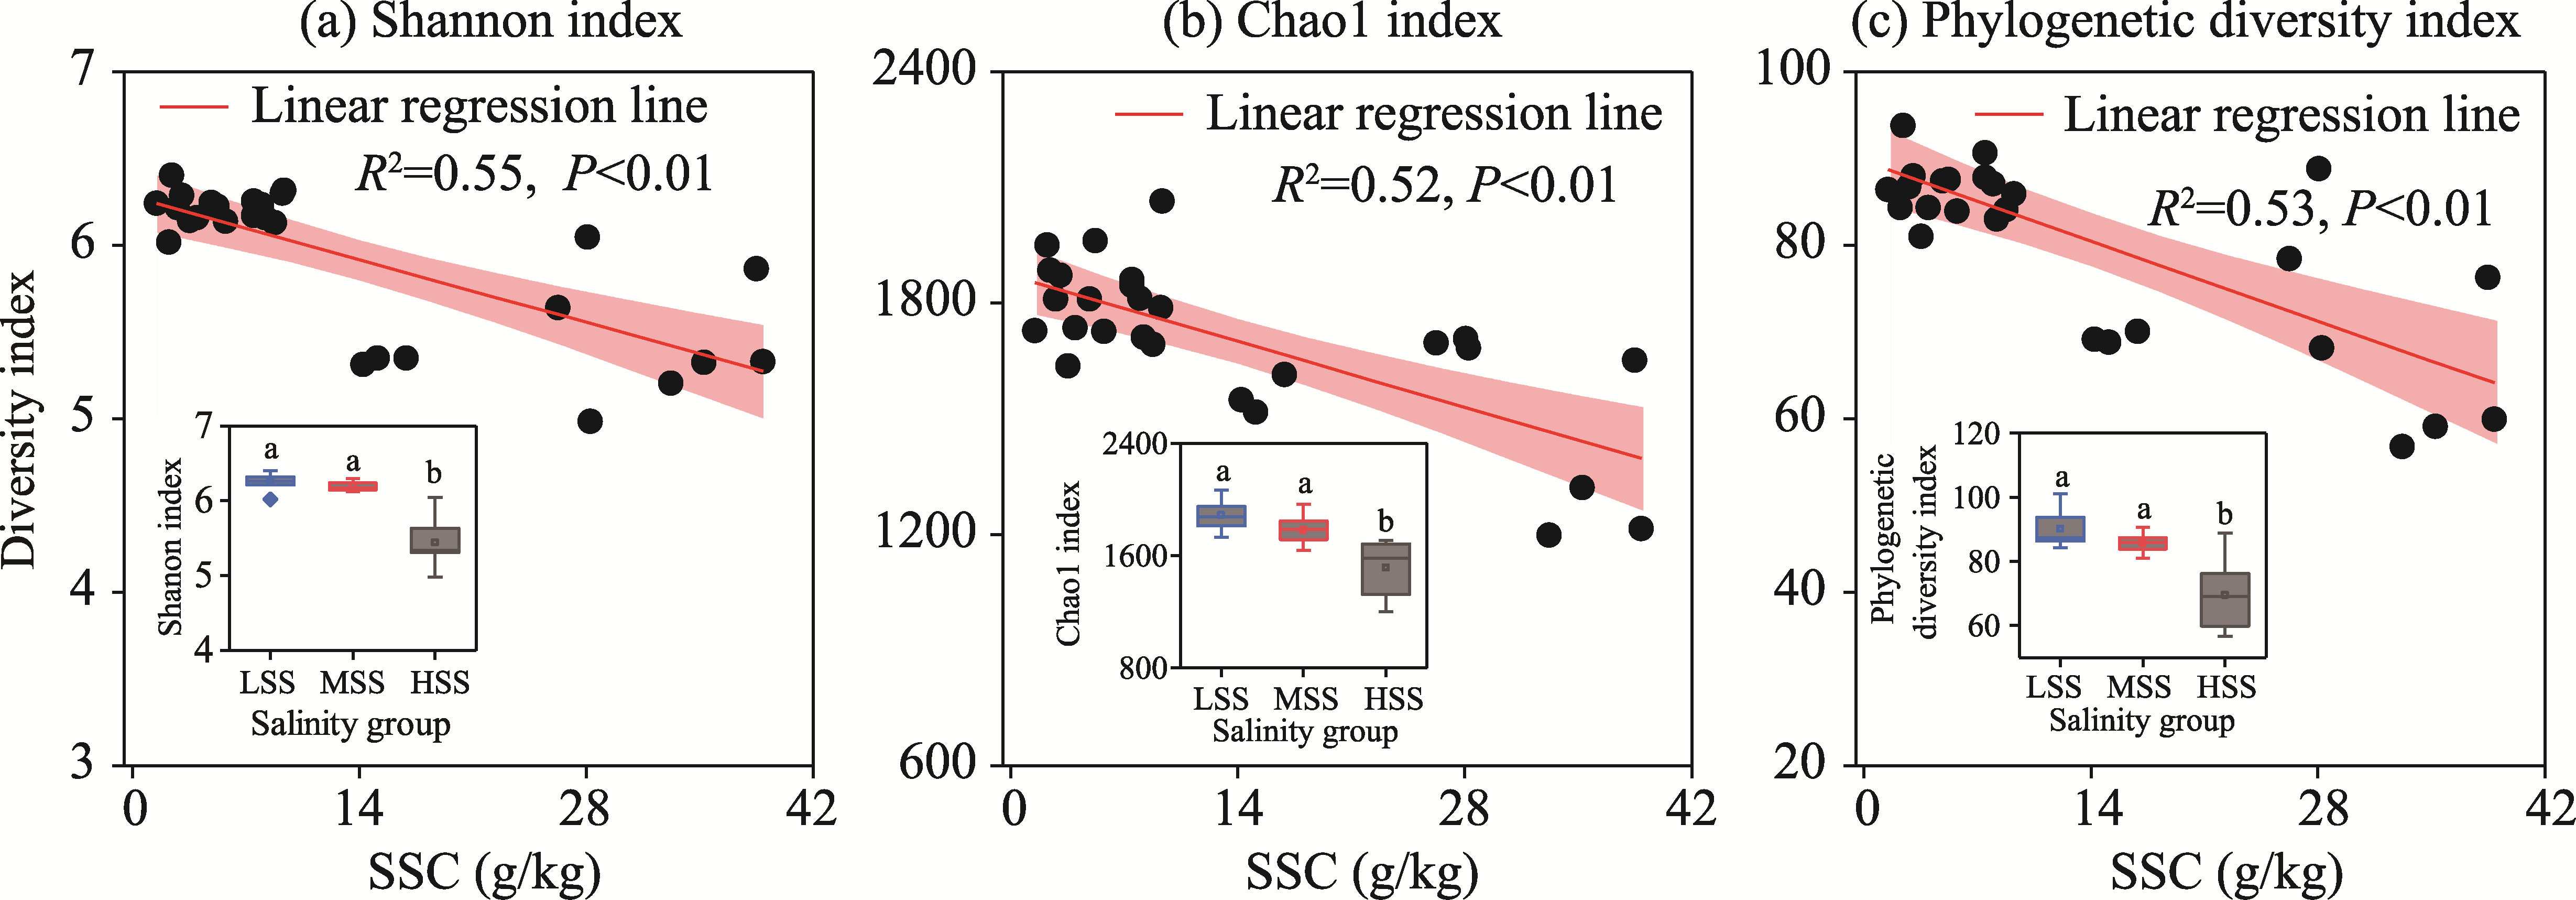
Fig. 3Correlations between soil salt content (SSC) and soil bacterial community diversity indices. (a), Shannon index; (b), Chao1 index; (c), phylogenetic diversity index. R2 indicates the coefficient of determination. The shaded area denote the 95.00% confidence intervals. The subplot within each panel shows the difference in each diversity index across three salinity groups. In each boxplot, the central line indicates the median, and the box bounds the interquartile range (IRQ). Whiskers extend to the most extreme data points within 1.5×IQR. Different lowercase letters above boxplots indicate significant differences at the P<0.05 level using Tukey's post hoc test.
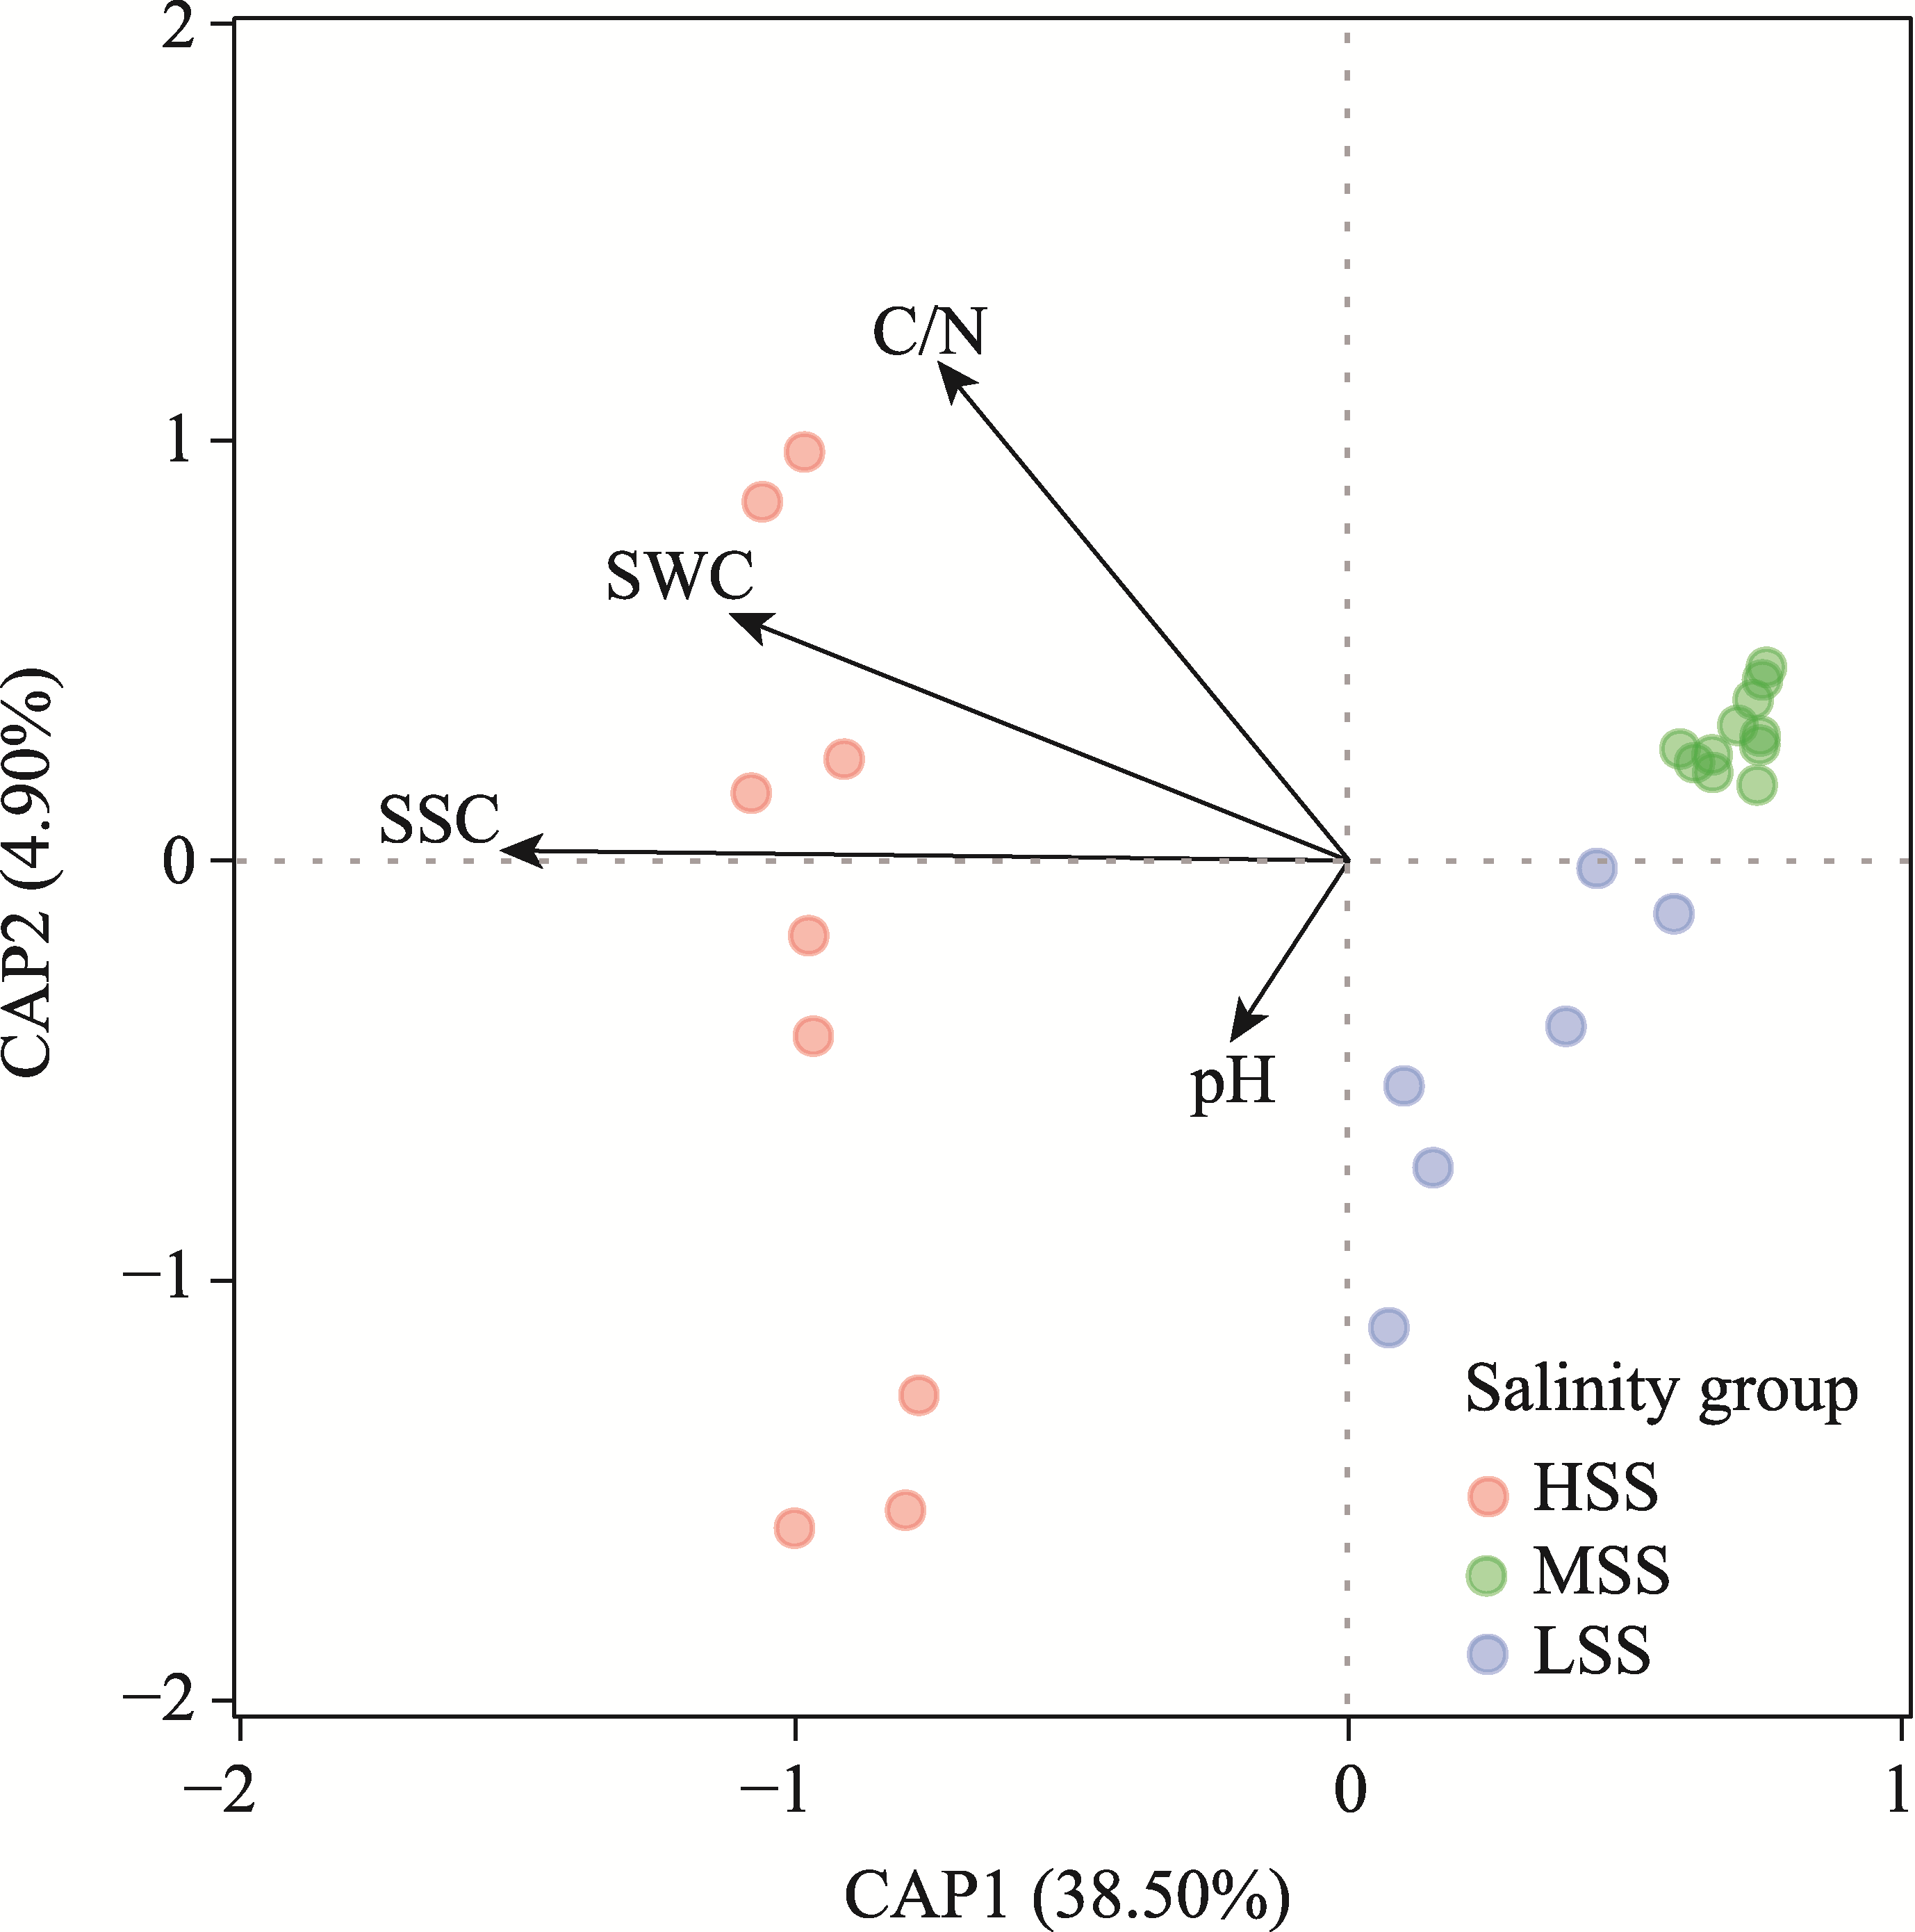
Fig. 4Constrained analysis of principal coordinates (CAP) for assessing the relationship between soil bacterial communities across three salinity groups and main environmental variables. SWC, soil water content; C/N, ratio of soil carbon to nitrogen. CAP1, the first axis of CAP; CAP2, the second axis of CAP.
Salinity group
Node
Link
AD
Random network index#
ACCr
APLr
NDr
Mr
LSS
751
7310
19.47
0.05±0.01
2.57±0.02
5.02±0.15
0.18±0.01
MSS
750
5651
15.07
0.04±0.01
2.74±0.01
5.41±0.51
0.21±0.01
HSS
303
748
4.94
0.02±0.03
3.69±0.02
7.97±0.73
0.43±0.01
Salinity group
Empirical network index
Me
PER (%)
NER (%)
ACCe
APLe
NDe
ADS
LSS
0.70
57.67
42.32
0.52
4.54
10.34
0.03
MSS
0.60
58.29
41.71
0.44
3.44
8.05
0.02
HSS
0.71
68.04
31.95
0.36
4.57
2.00
0.02
Table 1 Topological properties of the random and empirical networks of soil microbial communities across three salinity groups
Fig. 5Co-occurrence networks and stability characteristics of soil bacterial communities across three salinity groups. (a-c), network structure in different salinity groups; (d and e), difference in stability and robustness of soil bacterial co-occurrence networks among salinity groups; (f), topological roles of soil bacteria. In Figure 5a-c, node size is proportional to degree; colors represent soil bacteria at the phylum level. Pink and blue edges indicate positive and negative correlations, respectively. In Figure 5d and e, the network stability was calculated as the absolute value of negative cohesion divided by positive cohesion. Robustness of each network was assessed by the slope of the fitted line between the proportion of removed nodes and the proportion of remaining nodes. In each boxplot, the central line indicates the median, and the box bounds the IQR. Whiskers extend to the most extreme data points within 1.5×IQR. Circles within and outside the box represent individual data points; circles beyond the whiskers are outliers. Different lowercase letters above boxplots indicate significant differences at the P<0.05 level using Tukey's post hoc test.
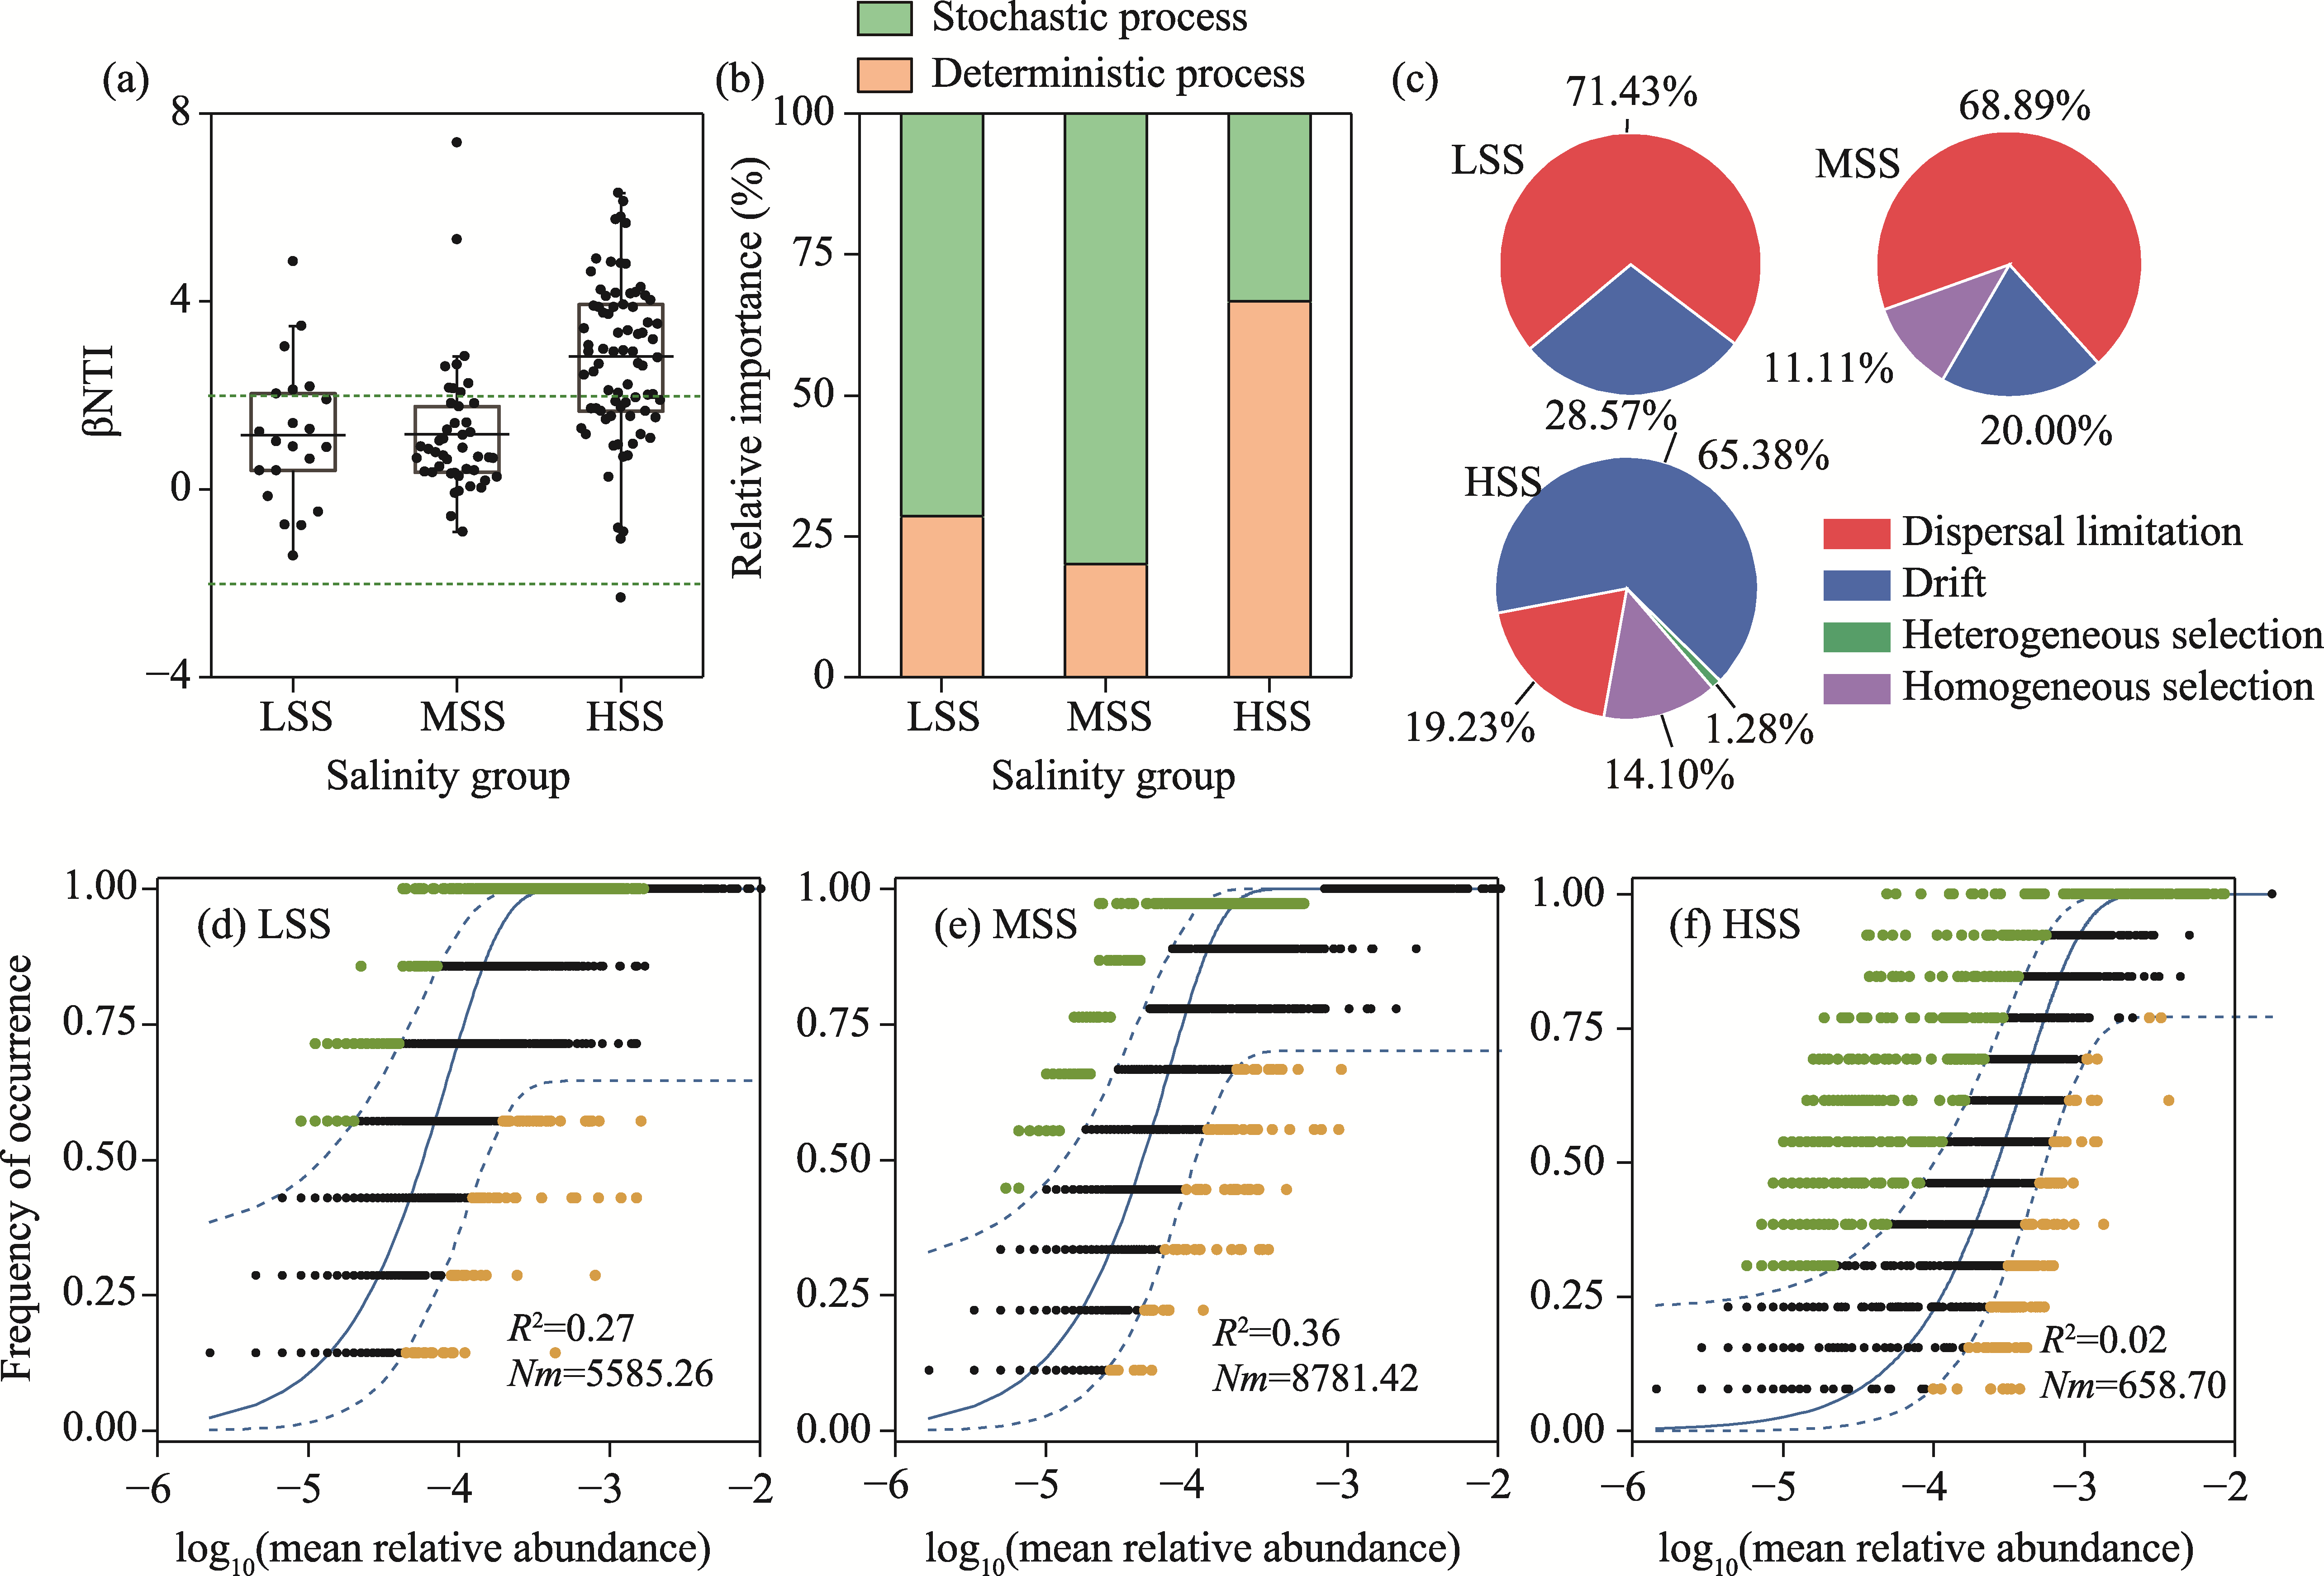
Fig. 6Relative importance of deterministic and stochastic processes in soil bacterial community assembly. (a), variations of the β nearest taxon index (βNTI) in bacterial communities in different soil salinity groups; (b and c), contributions of different ecological processes to soil bacterial community assembly in different soil salinity groups; (d-f), fit of the bacterial neutral community model (NCM) in LSS, MSS, and HSS, respectively. In Figure 6a, the central line in each subplot indicates the median, and the box bounds the IQR. Whiskers extend to the most extreme data points within 1.5×IQR. Circles within and outside the box represent individual data points; circles beyond the whiskers are outliers. In Figure 6d-f, the green dotted lines indicate the reference lines where |βNTI|=2; points falling between them represent the dominance of stochastic process. The best fit of NCM is shown by the blue solid line, and the blue dotted lines indicate the 95% confidence intervals of the model predictions. Green and orange points represent OTUs that occurred more frequently and less frequently than predicted, respectively. R2 indicates the goodness-of-fit of NCM and Nm represents the dispersal rate within communities.
Tamarix ramosissima, Populus euphratica, Apocynum venetum, Phragmites australis, and Nitraria tangutorum
All
5.52±1.12
0.63±0.09
6.57±0.32
33.94±2.52
Table S1 Soil physical-chemical properties and dominant plant species at 27 sampling sites across three salinity groups
Phylum
pH
EC
SOC
TN
SWC
C/N
SSC
Plant coverage
Acidobacteria
-0.22
-0.57**
-0.35
-0.39*
-0.43*
-0.21
-0.57**
-0.48*
Actinobacteria
0.05
-0.75**
-0.72**
-0.73
-0.52**
-0.33
-0.80**
-0.66**
Bacteroidetes
-0.13
-0.02
0.10
0.11
0.06
0.07
0.05
0.21
Chloroflexi
-0.21
0.63
0.43*
0.54
-0.51**
-0.12
-0.51**
-0.33
Cyanobacteria
0.12
0.58**
0.38
0.45*
0.51**
0.10
0.55**
0.33
Firmicutes
0.10
0.63**
0.51*
0.44*
0.56**
0.36
0.63**
0.38
Gemmatimonadetes
-0.22
0.51**
0.50*
0.43*
-0.73**
-0.31
-0.68**
-0.54*
Proteobacteria
0.06
-0.08
-0.04
0.03
0.01
-0.24
-0.08
-0.06
Verrucomicrobia
-0.20
0.08
0.31
0.30
0.12
0.01
0.23
0.13
Table S2 Correlations between the main soil bacterial phyla and environmental variables
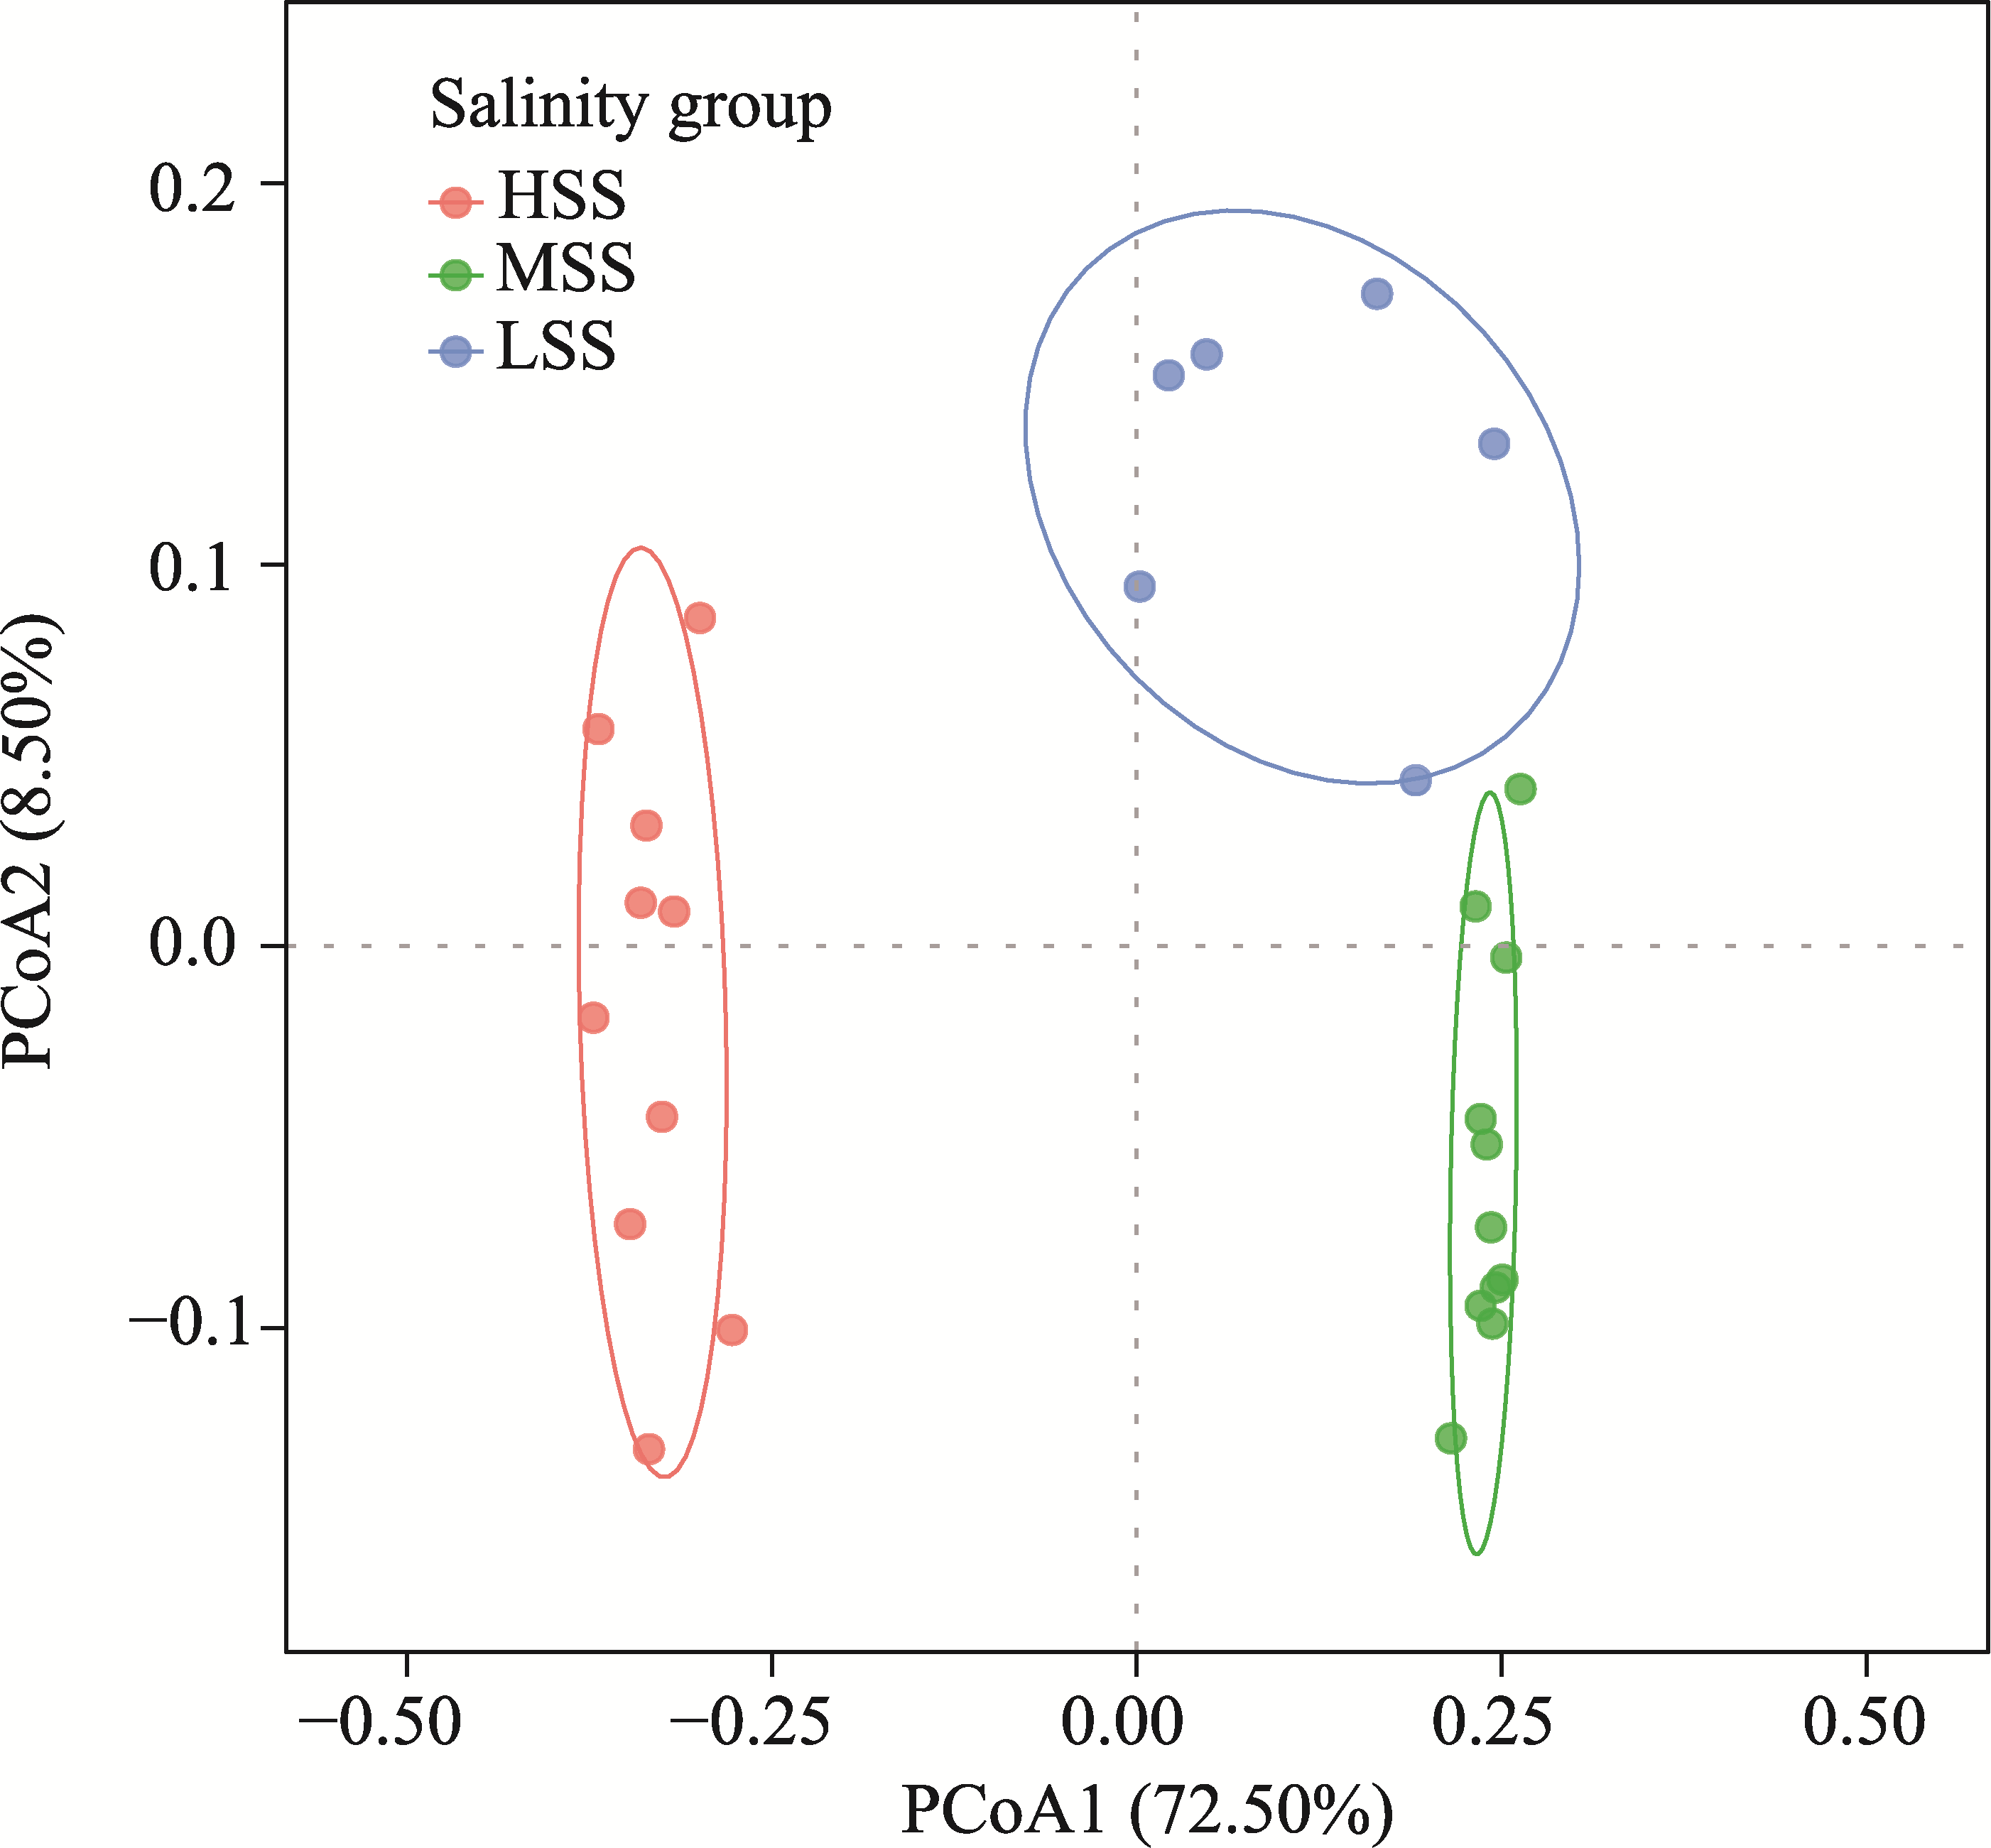
Fig. S1Principal coordinate analysis (PCoA) of soil bacterial communities across three salinity groups based on Bray-Curtis dissimilarity. LSS, lightly salinized soils; MSS, moderately salinized soils; HSS, heavily salinized soils; PCoA 1, the first axis of PCoA; PCoA 2, the second axis of PCoA.
Test method
Statistic
All groups
LSS versus MSS
LSS versus HSS
MSS versus HSS
MRPP
Delta
0.28
0.44
0.57
0.50
A
0.49
0.09
0.18
0.31
P
<0.01
<0.01
<0.01
<0.01
ANOSIM
R
0.78
0.66
0.94
1.00
P
<0.01
<0.01
<0.01
<0.01
PERMANOVA
R2
0.54
0.24
0.38
0.56
P
<0.01
<0.01
<0.01
<0.01
Table S3 Dissimilarity tests of soil bacterial community between different salinity groups
Environmental variable
Mantel test
Partial Mantel test
Mantel's r
P value
Mantel's r
P value
SSC
0.73
<0.01
0.58
<0.01
TN
0.59
<0.01
0.16
0.07
SWC
0.58
<0.01
0.16
0.04
SOC
0.53
<0.01
0.03
0.37
C/N
0.36
<0.01
-0.01
0.48
pH
-0.15
0.99
-0.07
0.85
Table S4 Mantel's correlations between soil bacterial communities and environmental variables
Environmental variable
df
Explained variance
F value
P value
SSC
1
0.84
6.69
<0.01
SWC
1
0.19
1.53
0.05
C/N
1
0.18
1.46
0.17
pH
1
0.13
1.02
0.34
Residual
23
2.78
Axis
df
Explained variance
F value
P value
CAP1
1
2.06
16.29
<0.01
CAP2
1
0.26
2.58
0.05
CAP3
1
0.17
1.38
0.32
CAP4
1
0.08
0.61
0.87
Residual
22
2.78
Table S5 One-way analysis of variance (ANOVA) of the main environmental variables correlated with soil bacterial beta-diversity in constrained analysis of principal coordinates (CAP) with 999 times permutations
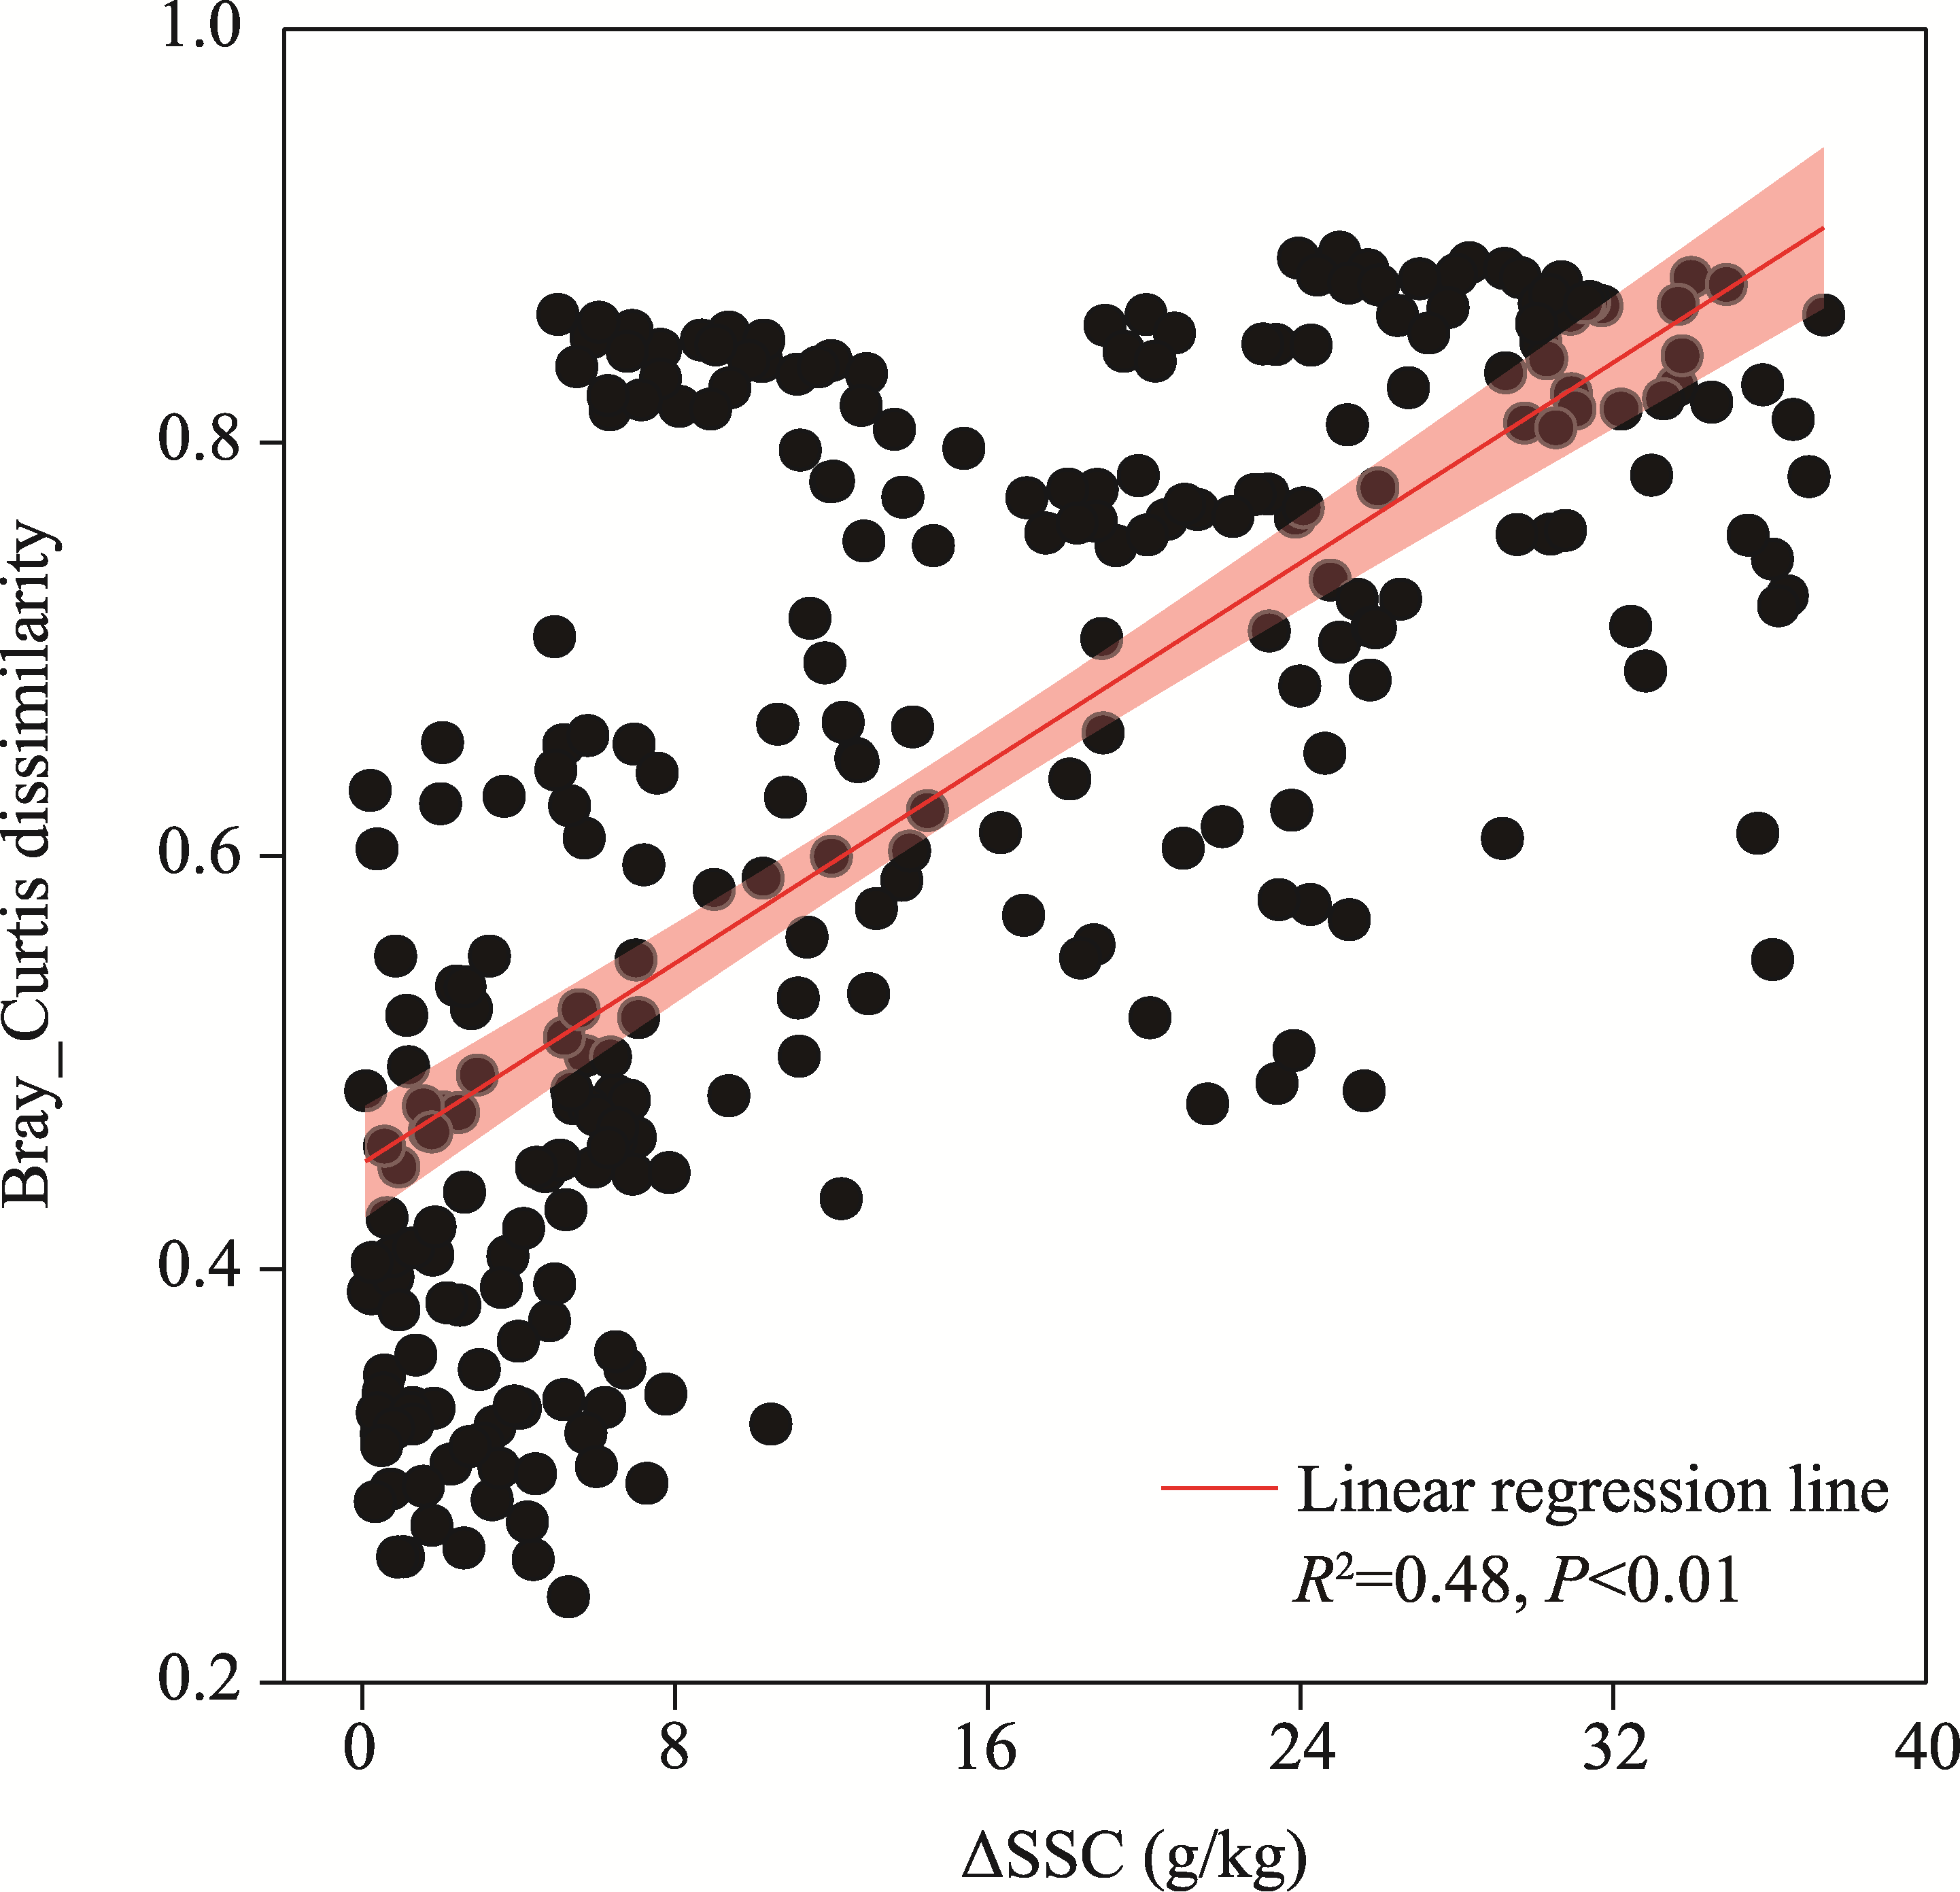
Fig. S2Relationship between differences of soil salt content (ΔSSC) and Bray-Curtis dissimilarity of soil bacterial communities. R2 represents the coefficient of determination. The shaded area denotes the 95.00% confidence intervals.
[1]
Bahram M, Hildebrand F, Forslund S K, et al. 2018. Structure and function of the global topsoil microbiome. Nature, 560: 233-237.
doi: 10.1038/s41586-018-0386-6
[2]
Banerjee S, Baah-Acheamfour M, Carlyle C, et al. 2016. Determinants of bacterial communities in Canadian agroforestry systems. Environmental Microbiology, 18(6): 1805-1816.
doi: 10.1111/1462-2920.12986
pmid: 26184386
[3]
Barberán A, Bates S, Casamayor E, et al. 2012. Using network analysis to explore co-occurrence patterns in soil microbial communities. The ISME Journal, 6: 343-351.
doi: 10.1038/ismej.2011.119
[4]
Bolyen E, Rideout J R, Dillon M R, et al. 2019. Reproducible, interactive, scalable and extensible microbiome data science using QIIME 2. Nature Biotechnology, 37: 852-857.
doi: 10.1038/s41587-019-0209-9
pmid: 31341288
[5]
Canfora L, Lo Papa G, Antisari L, et al. 2015. Spatial microbial community structure and biodiversity analysis in "extreme" hypersaline soils of a semiarid Mediterranean area. Applied Soil Ecology, 93: 120-129.
doi: 10.1016/j.apsoil.2015.04.014
[6]
Chen H H, Ma K Y, Huang Y, et al. 2022. Significant response of microbial community to increased salinity across wetland ecosystems. Geoderma, 415: 115778, doi: 10.1016/2022.115778.
[7]
de Vries F, Griffiths R, Bailey M, et al. 2018. Soil bacterial networks are less stable under drought than fungal networks. Nature Communications, 9(1): 3033, doi: 10.1038/s41467-018-05516-7.
[8]
Delgado-Baquerizo M, Oliverio A, Brewer T, et al. 2018. A global atlas of the dominant bacteria found in soil. Science, 359(6373): 320-325.
doi: 10.1126/science.aap9516
pmid: 29348236
[9]
Delgado-Baquerizo M, Doulcier G, Eldridge D, et al. 2020. Increases in aridity lead to drastic shifts in the assembly of dryland complex microbial networks. Land Degradation & Development, 31(3): 346-355.
doi: 10.1002/ldr.v31.3
[10]
Deng Y, Jiang Y H, Yang Y F, et al. 2012. Molecular ecological network analyses. BMC Bioinformatics, 13(1): 113, doi: 10.1186/1471-2105-13-113.
[11]
Dong X P, Zhang Z H, Lu Y, et al. 2024. Depth-dependent responses of soil bacterial communities to salinity in an arid region. Science of The Total Environment, 949: 175129, doi: 10.1016/2024.175129.
[12]
D'Odorico P, Bhattachan A, Davis K. 2013. Global desertification: Drivers and feedbacks. Advances in Water Resources, 51: 326-344.
doi: 10.1016/j.advwatres.2012.01.013
[13]
Edgar R. 2010. Search and clustering orders of magnitude faster than BLAST. Bioinformatics, 26(19): 2460-2461.
doi: 10.1093/bioinformatics/btq461
pmid: 20709691
[14]
Fang J, Adams J, Liu Z H, et al. 2025. Soil salinity and moisture have contrasting effects on deterministic versus stochastic assembly of bacterial communities in alpine lake shores. Applied Soil Ecology, 211: 106115, doi: 10.1016/j.apsoil.2025.106115.
[15]
Feng W, Zhang Y Q, Lai Z R, et al. 2021. Soil bacterial and eukaryotic co-occurrence networks across a desert climate gradient in northern China. Land Degradation & Development, 32(5): 1938-1950.
doi: 10.1002/ldr.v32.5
[16]
Fierer N, Jackson R. 2006. The diversity and biogeography of soil bacterial communities. Proceedings of the National Academy of Sciences of the United States of America, 103(3): 626-631.
[17]
Fierer N, Leff J, Adams B, et al. 2012. Cross-biome metagenomic analyses of soil microbial communities and their functional attributes. Proceedings of the National Academy of Sciences of the United States of America, 109(52): 21390-21395.
[18]
Freilich S, Kreimer A, Meilijson I, et al. 2010. The large-scale organization of the bacterial network of ecological co-occurrence interactions. Nucleic Acids Research, 38(12): 3857-3868.
doi: 10.1093/nar/gkq118
pmid: 20194113
[19]
Friedman J, Alm E J. 2012. Inferring correlation networks from genomic survey data. PLOS Computational Biology, 8(9): e1002687, doi: 10.1371/journal.pcbi.1002687.
[20]
Fu W, Chen B D, Jansa J, et al. 2022. Contrasting community responses of root and soil dwelling fungi to extreme drought in a temperate grassland. Soil Biology and Biochemistry, 169: 108670, doi: 10.1016/2022.108670.
[21]
Gao C, Xu L, Montoya L, et al. 2022. Co-occurrence networks reveal more complexity than community composition in resistance and resilience of microbial communities. Nature Communications, 13: 3867, doi: 10.1038/s41467-022-31343-y.
pmid: 35790741
[22]
He M Y, Shen C, Peng S, et al. 2024. The influence of soil salinization, induced by the backwater effect of the Yellow River, on microbial community dynamics and ecosystem functioning in arid regions. Environmental Research, 262: 119854, doi: 10.1016/j.envres.2024.119854.
[23]
Hernandez D, David A, Menges E, et al. 2021. Environmental stress destabilizes microbial networks. The ISME Journal, 15: 1722-1734.
doi: 10.1038/s41396-020-00882-x
[24]
Herren C, McMahon K. 2017. Cohesion: a method for quantifying the connectivity of microbial communities. The ISME Journal, 11: 2426-2438.
doi: 10.1038/ismej.2017.91
[25]
Hollister E, Engledow A, Hammett A, et al. 2010. Shifts in microbial community structure along an ecological gradient of hypersaline soils and sediments. The ISME Journal, 4: 829-838.
doi: 10.1038/ismej.2010.3
[26]
Huo X Y, Ren C J, Wang D X, et al. 2023. Microbial community assembly and its influencing factors of secondary forests in Qinling Mountains. Soil Biology and Biochemistry, 184: 109075, doi: 10.1016/j.soilbio.2023.109075.
[27]
Jiao S, Yang Y F, Xu Y Q, et al. 2019. Balance between community assembly processes mediates species coexistence in agricultural soil microbiomes across eastern China. The ISME Journal, 14: 202-216.
doi: 10.1038/s41396-019-0522-9
[28]
Li C C, Jin L, Zhang C, et al. 2023. Destabilized microbial networks with distinct performances of abundant and rare biospheres in maintaining networks under increasing salinity stress. iMeta, 2(1): e79, doi: 10.1002/imt2.79.
[29]
Li X, Wang A C, Wan W J, et al. 2021. High salinity inhibits soil bacterial community mediating nitrogen cycling. Applied and Environmental Microbiology, 87(21): e01366-21, doi: 10.1128/AEM.01366-21.
[30]
Liszka M J, Clark M E, Schneider E, et al. 2012. Nature versus nurture: Developing enzymes that function under extreme conditions. Annual Review of Chemical and Biomolecular Engineering, 3: 77-102.
doi: 10.1146/annurev-chembioeng-061010-114239
pmid: 22468597
[31]
Louca S, Polz M, Mazel F, et al. 2018. Function and functional redundancy in microbial systems. Nature Ecology & Evolution, 2: 936-943.
[32]
Ma B, Wang H Z, Dsouza M, et al. 2016. Geographic patterns of co-occurrence network topological features for soil microbiota at continental scale in eastern China. The ISME Journal, 10: 1891-1901.
doi: 10.1038/ismej.2015.261
[33]
Maestre F, Delgado-Baquerizo M, Jeffries T, et al. 2015. Increasing aridity reduces soil microbial diversity and abundance in global drylands. Proceedings of the National Academy of Sciences of the United States of America, 112(51): 15684-15689.
[34]
Manzoni S, Schimel J, Porporato A. 2012. Responses of soil microbial communities to water stress: results from a meta-analysis. Ecology, 93(4): 930-938.
doi: 10.1890/11-0026.1
pmid: 22690643
[35]
Mo Y Y, Peng F, Gao X F, et al. 2021. Low shifts in salinity determined assembly processes and network stability of microeukaryotic plankton communities in a subtropical urban reservoir. Microbiome, 9: 128, doi: 10.1186/s40168-021-01079-w.
pmid: 34082826
[36]
Needham D, Sachdeva R, Fuhrman J. 2017. Ecological dynamics and co-occurrence among marine phytoplankton, bacteria and myoviruses shows microdiversity matters. The ISME Journal, 11: 1614-1629.
doi: 10.1038/ismej.2017.29
[37]
Neilson J W, Califf K, Cardona C, et al. 2017. Significant impacts of increasing aridity on the arid soil microbiome. mSystems, 2(3): e00195-16, doi: 10.1128/mSystems.00195-16.
[38]
Pan H, Gao H, Peng Z, et al. 2022. Aridity threshold induces abrupt change of soil abundant and rare bacterial biogeography in dryland ecosystems. mSystems, 7: 01309-21, doi: 10.1128/msystems.01309-21.
[39]
Rath K, Rousk J. 2015. Salt effects on the soil microbial decomposer community and their role in organic carbon cycling: A review. Soil Biology and Biochemistry, 81: 108-123.
doi: 10.1016/j.soilbio.2014.11.001
[40]
Rath K, Maheshwari A, Bengtson P, et al. 2016. Comparative toxicities of salts on microbial processes in soil. Applied and Environmental Microbiology, 82(7): 2012-2020.
doi: 10.1128/AEM.04052-15
pmid: 26801570
[41]
Rath K, Maheshwari A, Rousk J. 2017. The impact of salinity on the microbial response to drying and rewetting in soil. Soil Biology and Biochemistry, 108: 17-26.
doi: 10.1016/j.soilbio.2017.01.018
[42]
Rath K, Murphy D, Rousk J. 2019. The microbial community size, structure, and process rates along natural gradients of soil salinity. Soil Biology and Biochemistry, 138: 107607, doi: 10.1016/j.soilbio.2019.107607.
[43]
Shi S J, Nuccio E E, Shi Z J, et al. 2016. The interconnected rhizosphere: High network complexity dominates rhizosphere assemblages. Ecology Letters, 19(8): 926-936.
doi: 10.1111/ele.12630
pmid: 27264635
[44]
Stegen J C, Lin X J, Fredrickson J K, et al. 2013. Quantifying community assembly processes and identifying features that impose them. The ISME Journal, 7: 2069-2079.
doi: 10.1038/ismej.2013.93
[45]
Tedersoo L, Bahram M, Polme S, et al. 2014. Global diversity and geography of soil fungi. Science, 346(6213): 1256688, doi: 10.1126/science.1256688.
[46]
Van Horn D, Okie J, Buelow H, et al. 2014. Soil microbial responses to increased moisture and organic resources along a salinity gradient in a Polar Desert. Applied and Environmental Microbiology, 80(10): 3034-3043.
doi: 10.1128/AEM.03414-13
pmid: 24610850
[47]
Wang H T, Gilbert J, Zhu Y G, et al. 2018. Salinity is a key factor driving the nitrogen cycling in the mangrove sediment. Science of The Total Environment, 631-632: 1342-1349.
doi: 10.1016/j.scitotenv.2018.03.102
[48]
Wang Y G, Li Y, Xiao D N. 2008. Catchment scale spatial variability of soil salt content in agricultural oasis, Northwest China. Environmental Geology, 56: 439-446.
doi: 10.1007/s00254-007-1181-0
[49]
Wei Y X, Chen L J, Feng Q, et al. 2024. Structure and assembly mechanism of soil bacterial community under different soil salt intensities in arid and semiarid regions. Ecological Indicators, 158: 111631, doi: 10.1016/j.ecolind.2024.111631.
[50]
Wu L W, Yang Y F, Chen S, et al. 2016. Long-term successional dynamics of microbial association networks in anaerobic digestion processes. Water Research, 104: 1-10.
doi: S0043-1354(16)30586-3
pmid: 27497626
[51]
Yang D L, Kato H, Kawatsu K, et al. 2022. Reconstruction of a soil microbial network induced by stress temperature. Microbiology Spectrum, 10(5): e02748-22, doi: 10.1128/spectrum.02748-22.
[52]
Yuan M, Guo X, Wu L W, et al. 2021. Climate warming enhances microbial network complexity and stability. Nature Climate Change, 11: 343-348.
doi: 10.1038/s41558-021-00989-9
[53]
Zhang G L, Bai J H, Tebbe C C, et al. 2021. Salinity controls soil microbial community structure and function in coastal estuarine wetlands. Environmental Microbiology, 23(2): 1020-1037.
doi: 10.1111/1462-2920.15281
pmid: 33073448
[54]
Zhang G L, Bai J H, Zhai Y J, et al. 2024. Microbial diversity and functions in saline soils: A review from a biogeochemical perspective. Journal of Advanced Research, 59: 129-140.
doi: 10.1016/j.jare.2023.06.015
[55]
Zhang K P, Shi Y, Cui X Q, et al. 2019. Salinity is a key determinant for soil microbial communities in a desert ecosystem. mSystems, 4(1): e00225-18, doi: 10.1128/msystems.00225-18.
[56]
Zhou J Z, Deng Y, Luo F, et al. 2010. Functional molecular ecological networks. mBio, 1(4): e00169-10, doi: 10.1128/mBio.00169-10.
[57]
Zhou J Z, Deng Y, Luo F, et al. 2011. Phylogenetic molecular ecological network of soil microbial communities in response to elevated CO2. mBio, 2(4): e00122-11, doi: 10.1128/mBio.00122-11.
[58]
Zhou J Z, Ning D L. 2017. Stochastic community assembly: does it matter in Microbial Ecology? Microbiology and Molecular Biology Reviews, 81(4): e00002-17, doi: 10.1128/MMBR.00002-17.
[59]
Zhou X Q, Guo Z Y, Chen C R, et al. 2017. Soil microbial community structure and diversity are largely influenced by soil pH and nutrient quality in 78-year-old tree plantations. Biogeosciences, 14(8): 2101-2111.
doi: 10.5194/bg-14-2101-2017