| Research article |
|

|
|
|
| Effect of stones on the sand saltation threshold during natural sand and dust storms in a stony desert in Tsogt-Ovoo in the Gobi Desert, Mongolia |
Batjargal BUYANTOGTOKH1,2,*( ), Yasunori KUROSAKI1, Atsushi TSUNEKAWA1, Mitsuru TSUBO1, Batdelger GANTSETSEG2, Amarsaikhan DAVAADORJ2, Masahide ISHIZUKA3, Tsuyoshi T SEKIYAMA4, Taichu Y TANAKA4, Takashi MAKI4 ), Yasunori KUROSAKI1, Atsushi TSUNEKAWA1, Mitsuru TSUBO1, Batdelger GANTSETSEG2, Amarsaikhan DAVAADORJ2, Masahide ISHIZUKA3, Tsuyoshi T SEKIYAMA4, Taichu Y TANAKA4, Takashi MAKI4 |
1Arid Land Research Center, Tottori University, Tottori 680-0001, Japan
2Information and Research Institute of Meteorology, Hydrology and Environment, Ulaanbaatar 15160, Mongolia
3Faculty of Engineering and Design, Kagawa University, Takamatsu 761-0396, Japan
4Meteorological Research Institute, Japan Meteorological Agency, Tsukuba 305-0052, Japan |
|
|
|
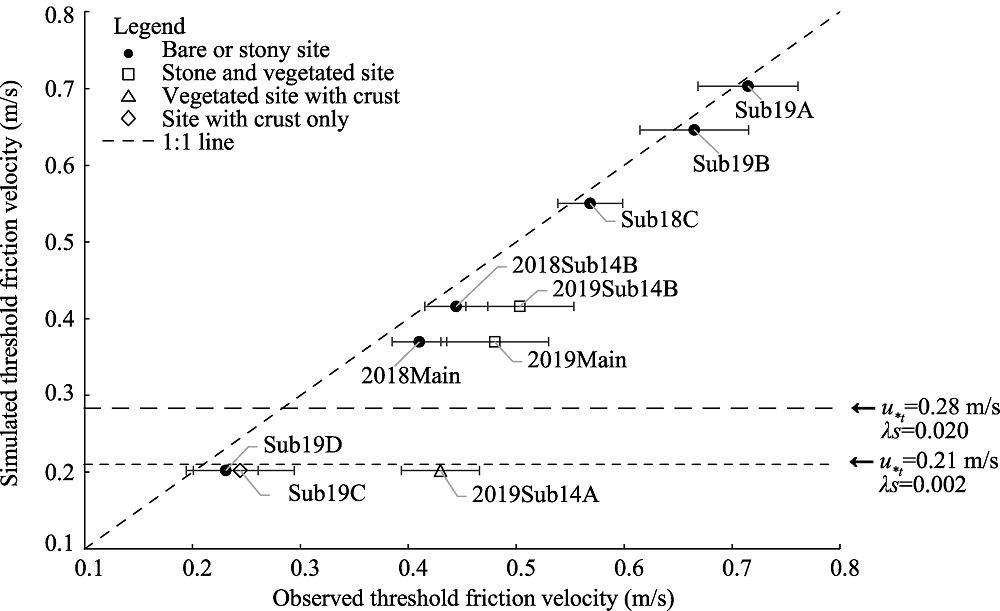
Abstract Non-erodible elements such as stones and vegetation are key to controlling wind erosion and dust emission in drylands. Stony deserts are widely distributed in the Gobi Desert, but the effect of stones on wind erosion and dust emission have not been well studied, except under artificial conditions. In this study, we evaluated the effect of stones on wind erosion and dust emission by measuring the sand saltation threshold in a stony desert in Tsogt-Ovoo in the Gobi Desert, Mongolia, under natural surface conditions during sand and dust storms. We quantified the amount of stones by measuring the roughness density, and determined the threshold friction velocity for sand saltation by measuring wind speed and sand saltation count. Our results showed that the threshold friction velocity increased with the roughness density of stones. In the northern part of the study area, where neither a surface crust nor vegetation was observed, the roughness density of stones was 0.000 in a topographic depression (TD), 0.050 on a northern slope (N.SL), and 0.160 on the northern mountain (N.MT). The mean threshold friction velocity values were 0.23, 0.41, and 0.57 m/s at the TD, N.SL, and N.MT sites, respectively. In the southern part of the study area, the roughness density values of stones were 0.000 and 0.070-0.320 at the TD and southern slope sites, respectively, and the mean threshold friction velocities were 0.23 and 0.45-0.71 m/s, respectively. We further compared the observed threshold friction velocities with simulated threshold friction velocities using Raupach's theoretical roughness correction and the measured roughness density values, and found that Raupach's roughness correction worked very well in the simulation of threshold friction velocity in the stony desert. This means that the results of our stone measurement can be applied to a numerical dust model.
|
|
Received: 21 December 2020
Published: 10 July 2021
|
|
Corresponding Authors:
|
About author: *Batjargal BUYANTOGTOKH (E-mail: buya_9@yahoo.com)
|
| Cite this article:
Batjargal BUYANTOGTOKH, Yasunori KUROSAKI, Atsushi TSUNEKAWA, Mitsuru TSUBO, Batdelger GANTSETSEG, Amarsaikhan DAVAADORJ, Masahide ISHIZUKA, Tsuyoshi T SEKIYAMA, Taichu Y TANAKA, Takashi MAKI. Effect of stones on the sand saltation threshold during natural sand and dust storms in a stony desert in Tsogt-Ovoo in the Gobi Desert, Mongolia. Journal of Arid Land, 2021, 13(7): 653-673.
URL:
http://jal.xjegi.com/10.1007/s40333-021-0072-7 OR http://jal.xjegi.com/Y2021/V13/I7/653
|
|
|
| [1] |
Bagnold R A. 1941. The physics of blown sand and desert dunes. Progress in Physical Geography, 18(1):91-96.
|
|
|
| [2] |
Barchyn T E, Hugenholtz C H. 2011. Comparison of four methods to calculate aeolian sediment transport threshold from field data: Implications for transport prediction and discussion of method evolution. Geomorphology, 129(3-4):190-203.
doi: 10.1016/j.geomorph.2011.01.022
|
|
|
| [3] |
Belnap J, Gillette D A. 1998. Vulnerability of desert biological soil crusts to wind erosion: the influences of crust development, soil texture, and disturbance. Journal of Arid Environments, 39(2):133-142.
doi: 10.1006/jare.1998.0388
|
|
|
| [4] |
Boucher O, Randall D, Artaxo P, et al. 2013. Clouds and aerosols. In: Climate Change 2013: The Physical Science Basis. Contribution of Working Group I to the Fifth Assessment Report of the Intergovernmental Panel on Climate Change. Cambridge: Cambridge University Press, 571-657.
|
|
|
| [5] |
Callot Y, Marticorena B, Bergametti G. 2000. Geomorphologic approach for modelling the surface features of arid environments in a model of dust emissions: application to the Sahara Desert. Geodinamica Acta, 13(5):245-270.
doi: 10.1080/09853111.2000.11105373
|
|
|
| [6] |
Chen S, Huang J, Li J, et al. 2017. Comparison of dust emissions, transport, and deposition between the Taklimakan Desert and Gobi Desert from 2007 to 2011. Science China Earth Sciences, 60(7):1338-1355.
doi: 10.1007/s11430-016-9051-0
|
|
|
| [7] |
Cooke R U. 1970. Stone pavements in deserts. Annals of the Association of American Geographers, 60(3):560-577.
doi: 10.1111/j.1467-8306.1970.tb00741.x
|
|
|
| [8] |
Darmenova K, Sokolik I N, Shao Y, et al. 2009. Development of a physically based dust emission module within the Weather Research and Forecasting (WRF) model: Assessment of dust emission parameterizations and input parameters for source regions in Central and East Asia. Journal of Geophysical Research: Atmospheres, 114(D14), doi: 10.1029/2008JD011236.
|
|
|
| [9] |
Edwards B L, Namikas S L. 2015. Characterizing the sediment bed in terms of resistance to motion: Toward an improved model of saltation thresholds for aeolian transport. Aeolian Research, 19:123-128.
doi: 10.1016/j.aeolia.2015.10.004
|
|
|
| [10] |
Faé G S, Montes F, Bazilevskaya E, et al. 2019. Making soil particle size analysis by laser diffraction compatible with standard soil texture determination methods. Soil Science Society of America Journal, 83(4):1244-1252.
doi: 10.2136/sssaj2018.10.0385
|
|
|
| [11] |
Fécan F, Marticorena B, Bergametti G. 1998. Parametrization of the increase of the aeolian erosion threshold wind friction velocity due to soil moisture for arid and semi-arid areas. Annales Geophysicae, 17:149-157.
doi: 10.1007/s00585-999-0149-7
|
|
|
| [12] |
Foroutan H, Young J, Napelenok S, et al. 2017. Development and evaluation of a physics-based windblown dust emission scheme implemented in the CMAQ modeling system. Journal of Advances in Modeling Earth Systems, 9(1):585-608.
doi: 10.1002/2016MS000823
pmid: 30245776
|
|
|
| [13] |
Gantsetseg B, Ishizuka M, Kurosaki Y, et al. 2017. Topographical and hydrological effects on meso-scale vegetation in desert steppe, Mongolia. Journal of Arid Land, 9(1):132-142.
doi: 10.1007/s40333-016-0090-z
|
|
|
| [14] |
Gillette D A. 1978. Tests with a portable wind tunnel for determining wind erosion threshold velocities. Atmospheric Environment, 12(12):2309-2313.
|
|
|
| [15] |
Gillette D A, Adams J, Endo A, et al. 1980. Threshold velocities for input of soil particles into the air by desert soils. Journal of Geophysical Research: Oceans, 85(C10):5621-5630.
|
|
|
| [16] |
Gillette D A, Adams J, Muhs D, et al. 1982. Threshold friction velocities and rupture moduli for crusted desert soils for the input of soil particles into the air. Journal of Geophysical Research: Oceans, 87(C11):9003-9015.
|
|
|
| [17] |
Gillette D A. 1988. Threshold friction velocities for dust production for agricultural soils. Journal of Geophysical Research: Atmospheres, 93(D10):12645-12662.
doi: 10.1029/JD093iD10p12645
|
|
|
| [18] |
Gillette D A, Herrick J E, Herbert G A. 2006. Wind characteristics of mesquite streets in the northern Chihuahuan Desert, New Mexico, USA. Environmental Fluid Mechanics, 6(3):241-275.
doi: 10.1007/s10652-005-6022-7
|
|
|
| [19] |
Gillies J A, Lancaster N, Nickling W G, et al. 2000. Field determination of drag forces and shear stress partitioning effects for a desert shrub (Sarcobatus vermiculatus, greasewood). Journal of Geophysical Research: Atmospheres, 105(D20):24871-24880.
doi: 10.1029/2000JD900431
|
|
|
| [20] |
Gillies J A, Nickling W G, King J. 2007. Shear stress partitioning in large patches of roughness in the atmospheric inertial sublayer. Boundary-Layer Meteorology, 122(2):367-396.
doi: 10.1007/s10546-006-9101-5
|
|
|
| [21] |
Greeley R, Iversen J D. 1985. Wind as a geological process on Earth, Mars, Venus and Titan. Cambridge: Cambridge University Press, 333.
|
|
|
| [22] |
Greeley R, Gaddis L, Lancaster N, et al. 1991. Assessment of aerodynamic roughness via airborne radar observations. In: Aeolian Grain Transport. Vienna: Springer, 77-88.
|
|
|
| [23] |
Hébrard E, Listowski C, Coll P, et al. 2012. An aerodynamic roughness length map derived from extended Martian rock abundance data. Journal of Geophysical Research: Planets, 117(E4), doi: 10.1029/2011JE003942.
|
|
|
| [24] |
Ishizuka M, Mikami M, Yamada Y, et al. 2009. Threshold friction velocities of saltation sand particles for different soil moisture conditions in the Taklimakan Desert. Sola, 5:184-187.
doi: 10.2151/sola.2009-047
|
|
|
| [25] |
Ishizuka M, Mikami M, Yamada Y, et al. 2012. Does ground surface soil aggregation affect transition of the wind speed threshold for saltation and dust emission? SOLA, 8:129-132.
doi: 10.2151/sola.2012-032
|
|
|
| [26] |
Iversen J D, Wang W P, Rasmussen K R, et al. 1990. The effect of a roughness element on local saltation transport. Journal of Wind Engineering and Industrial Aerodynamics, 36:845-854.
doi: 10.1016/0167-6105(90)90081-M
|
|
|
| [27] |
Kang J Y, Yoon S C, Shao Y, et al. 2011. Comparison of vertical dust flux by implementing three dust emission schemes in WRF/Chem. Journal of Geophysical Research: Atmospheres, 116(D9), doi: 10.1029/2010JD014649.
|
|
|
| [28] |
King J, Nickling W G, Gillies J A. 2005. Representation of vegetation and other nonerodible elements in aeolian shear stress partitioning models for predicting transport threshold. Journal of Geophysical Research: Earth Surface, 110(F4), doi: 10.1029/2004JF000281.
|
|
|
| [29] |
Kurosaki Y, Mikami M. 2007. Threshold wind speed for dust emission in East Asia and its seasonal variations. Journal of Geophysical Research: Atmospheres, 112(D17), doi: 10.1029/2006JD007988.
|
|
|
| [30] |
Kurosaki Y, Shinoda M, Mikami M. 2011a. What caused a recent increase in dust outbreaks over East Asia? Geophysical Research Letters, 38(11), doi: 10.1029/2011GL047494.
|
|
|
| [31] |
Kurosaki Y, Shinoda M, Mikami M, et al. 2011b. Effects of soil and land surface conditions in summer on dust outbreaks in the following Spring in a Mongolian Grassland. SOLA, 7:69-72.
doi: 10.2151/sola.2011-018
|
|
|
| [32] |
Lancaster N, Baas A. 1998. Influence of vegetation cover on sand transport by wind: field studies at Owens Lake, California. Earth Surface Processes and Landforms: The Journal of the British Geomorphological Group, 23(1):69-82.
|
|
|
| [33] |
Laurent B, Marticorena B, Bergametti G, et al. 2005. Simulation of the mineral dust emission frequencies from desert areas of China and Mongolia using an aerodynamic roughness length map derived from the POLDER/ADEOS 1 surface products. Journal of Geophysical Research: Atmospheres, 110(D18), doi: 10.1029/2004JD005013.
|
|
|
| [34] |
Lee H, Park S H. 2020. Stepwise assessment of different saltation theories in comparison with field observation data. Atmosphere, 11(1):10, doi: 10.3390/atmos11010010.
doi: 10.3390/atmos11010010
|
|
|
| [35] |
Li G, Zhang J, Herrmann H J, et al. 2020. Study of aerodynamic grain entrainment in aeolian transport. Geophysical Research Letters, 47(11): e2019GL086574.
|
|
|
| [36] |
Li Z, Wu S, Dale J, et al. 2008. Wind tunnel experiments of air flow patterns over nabkhas modeled after those from the Hotan River basin, Xinjiang, China (I): non-vegetated. Frontiers of Earth Science in China, 2(3):333-339.
doi: 10.1007/s11707-008-0019-8
|
|
|
| [37] |
Lopez M V, Sabre M, Gracia R, et al. 1998. Tillage effects on soil surface conditions and dust emission by wind erosion in semiarid Aragon (NE Spain). Soil and Tillage Research, 45(1-2):91-105.
doi: 10.1016/S0167-1987(97)00066-4
|
|
|
| [38] |
Marshall J K. 1971. Drag measurements in roughness arrays of varying density and distribution. Agricultural Meteorology, 8:269-292.
doi: 10.1016/0002-1571(71)90116-6
|
|
|
| [39] |
Marticorena B, Bergametti G. 1995. Modeling the atmospheric dust cycle: 1. Design of a soil-derived dust emission scheme. Journal of Geophysical Research: Atmospheres, 100(D8):16415-16430.
doi: 10.1029/95JD00690
|
|
|
| [40] |
Marticorena B, Bergametti G, Gillette D, et al. 1997a. Factors controlling threshold friction velocity in semiarid and arid areas of the United States. Journal of Geophysical Research: Atmospheres, 102(D19):23277-23287.
doi: 10.1029/97JD01303
|
|
|
| [41] |
Marticorena B, Bergametti G, Aumont B, et al. 1997b. Modeling the atmospheric dust cycle: 2. Simulation of Saharan dust sources. Journal of Geophysical Research: Atmospheres, 102(D4):4387-4404.
doi: 10.1029/96JD02964
|
|
|
| [42] |
Marticorena B, Chazette P, Bergametti G, et al. 2004. Mapping the aerodynamic roughness length of desert surfaces from the POLDER/ADEOS bi-directional reflectance product. International Journal of Remote Sensing, 25(3):603-626.
doi: 10.1080/0143116031000116976
|
|
|
| [43] |
Marticorena B, Kardous M, Bergametti G, et al. 2006. Surface and aerodynamic roughness in arid and semiarid areas and their relation to radar backscatter coefficient. Journal of Geophysical Research: Earth Surface, 111(F3), doi: 10.1029/2006JF000462.
|
|
|
| [44] |
Mazzoli A, Moriconi G. 2014. Particle size, size distribution and morphological evaluation of glass fiber reinforced plastic (GRP) industrial by-product. Micron, 67:169-178.
doi: S0968-4328(14)00151-6
pmid: 25195092
|
|
|
| [45] |
Mu H, Otani S, Shinoda M, et al. 2013. Long-term effects of livestock loss caused by dust storm on Mongolian inhabitants: a survey 1 year after the dust storm. Yonago Acta Medica, 56(1):39-42.
|
|
|
| [46] |
Natsagdorj L, Jugder D, Chung Y S. 2003. Analysis of dust storms observed in Mongolia during 1937-1999. Atmospheric Environment, 37(9-10):1401-1411.
doi: 10.1016/S1352-2310(02)01023-3
|
|
|
| [47] |
Onishi K, Otani S, Yoshida A, et al. 2015. Adverse health effects of Asian dust particles and heavy metals in Japan. Asia Pacific Journal of Public Health, 27(2): NP1719-NP1726.
|
|
|
| [48] |
Otsu N. 1979. A threshold selection method from gray-level histograms. IEEE Transactions on Systems, Man, and Cybernetics, 9(1):62-66.
doi: 10.1109/TSMC.1979.4310076
|
|
|
| [49] |
Raupach M R. 1992. Drag and drag partition on rough surfaces. Boundary-Layer Meteorology, 60(4):375-395.
doi: 10.1007/BF00155203
|
|
|
| [50] |
Raupach M R, Gillette D A, Leys J F. 1993. The effect of roughness elements on wind erosion threshold. Journal of Geophysical Research: Atmospheres, 98(D2):3023-3029.
doi: 10.1029/92JD01922
|
|
|
| [51] |
Schlichting H. 1936. Experimental investigation of the problem of surface roughness. In: National Advisory Committee for Aeronautics Collection. National Advisory Committee for Aeronautics, 1-34.
|
|
|
| [52] |
Shao Y, Raupach M R, Findlater P A. 1993. Effect of saltation bombardment on the entrainment of dust by wind. Journal of Geophysical Research: Atmospheres, 98(D7):12719-12726.
doi: 10.1029/93JD00396
|
|
|
| [53] |
Shao Y, Lu H. 2000. A simple expression for wind erosion threshold friction velocity. Journal of Geophysical Research: Atmospheres, 105(D17):22437-22443.
doi: 10.1029/2000JD900304
|
|
|
| [54] |
Shao Y. 2004. Simplification of a dust emission scheme and comparison with data. Journal of Geophysical Research: Atmospheres, 109(D10), doi: 10.1029/2003JD004372.
|
|
|
| [55] |
Shao Y. 2008. Physics and Modelling of Wind Erosion. Dordrecht: Springer, 18-20.
|
|
|
| [56] |
Shao Y, Ishizuka M, Mikami M, et al. 2011. Parameterization of size-resolved dust emission and validation with measurements. Journal of Geophysical Research: Atmospheres, 116(D8), doi: 10.1029/2010JD014527.
|
|
|
| [57] |
Shao Y, Nickling W, Bergametti G, et al. 2015. A tribute to Michael R. Raupach for contributions to aeolian fluid dynamics. Aeolian Research, 19:37-54.
doi: 10.1016/j.aeolia.2015.09.004
|
|
|
| [58] |
Tan L, Zhang W, Qu J, et al. 2013. Aeolian sand transport over gobi with different gravel coverages under limited sand supply: A mobile wind tunnel investigation. Aeolian Research, 11:67-74.
doi: 10.1016/j.aeolia.2013.10.003
|
|
|
| [59] |
Tan L, Zhang W, An Z, et al. 2019. The effect of roughness density of gobi beds on the entrainment of sediment by wind: A wind tunnel study. Journal of Wind Engineering and Industrial Aerodynamics, 190:183-189.
doi: 10.1016/j.jweia.2019.05.002
|
|
|
| [60] |
Udo K. 2009. Field measurement of seasonal wind-blown sand flux using high-frequency sampling instrumentation. Journal of Coastal Research, SI(56):148-152.
|
|
|
| [61] |
Wang X, Xia D, Wang T, et al. 2008. Dust sources in arid and semiarid China and southern Mongolia: Impacts of geomorphological setting and surface materials. Geomorphology, 97(3-4):583-600.
doi: 10.1016/j.geomorph.2007.09.006
|
|
|
| [62] |
Webb N P, Chappell A, LeGrand S L, et al. 2020. A note on the use of drag partition in aeolian transport models. Aeolian Research, 42:100560, doi: 10.1016/j.aeolia.2019.100560.
doi: 10.1016/j.aeolia.2019.100560
|
|
|
| [63] |
Wu C, Lin Z, Liu X. 2020. Global dust cycle and uncertainty in CMIP5 models. Atmospheric Chemistry and Physics Discussions, 2020: 1-52.
|
|
|
| [64] |
Wu J, Kurosaki Y, Shinoda M, et al. 2016. Regional characteristics of recent dust occurrence and its controlling factors in East Asia. SOLA, 12:187-191.
doi: 10.2151/sola.2016-038
|
|
|
| [65] |
Wu J, Kurosaki Y, Du C. 2020. Evaluation of climatic and anthropogenic impacts on dust erodibility: A case study in Xilingol Grassland, China. Sustainability, 12(2):629, doi: 10.3390/su12020629.
doi: 10.3390/su12020629
|
|
|
| [66] |
Xi X, Sokolik I N. 2015. Seasonal dynamics of threshold friction velocity and dust emission in Central Asia. Journal of Geophysical Research: Atmospheres, 120(4):1536-1564.
doi: 10.1002/jgrd.v120.4
|
|
|
| [67] |
Yan Y, Xu X, Xin X, et al. 2011. Effect of vegetation coverage on aeolian dust accumulation in a semiarid steppe of northern China. Catena, 87(3):351-356.
doi: 10.1016/j.catena.2011.07.002
|
|
|
| [68] |
Yang Y L, Victor S, Lu Q. 2002. Global Alarm: Dust and Sandstorms from the World's Drylands. New York: United Nations Pubns, 346.
|
|
|
| [69] |
Zhang J, Teng Z, Huang N, et al. 2016. Surface renewal as a significant mechanism for dust emission. Atmospheric Chemistry and Physics, 16(24):15517-15528.
doi: 10.5194/acp-16-15517-2016
|
|
|
| [70] |
Zhang K, Zhang W, Tan L, et al. 2015. Effects of gravel mulch on aeolian transport: a field wind tunnel simulation. Journal of Arid Land, 7(3):296-303.
doi: 10.1007/s40333-015-0121-1
|
|
|
| [71] |
Zhang W, Tan L, Zhang G, et al. 2014. Aeolian processes over gravel beds: Field wind tunnel simulation and its application atop the Mogao Grottoes, China. Aeolian Research, 15:335-344.
doi: 10.1016/j.aeolia.2014.07.001
|
|
|
|
Viewed |
|
|
|
Full text
|
|
|
|
|
Abstract
|
|
|
|
|
Cited |
|
|
|
|
| |
Shared |
|
|
|
|
| |
Discussed |
|
|
|
|