| Research article |
|


|
|
|
| Relationship between ecological stoichiometry and plant community diversity in the upper reaches of Tarim River, northwestern China |
ZHAO Jingjing1,2, GONG Lu1,2,*( ), CHEN Xin1,2 ), CHEN Xin1,2 |
1 College of Resources and Environment Science, Xinjiang University, Urumqi 830046, China
2 Key Laboratory of Oasis Ecology, Xinjiang University, Urumqi 830046, China |
|
|
|
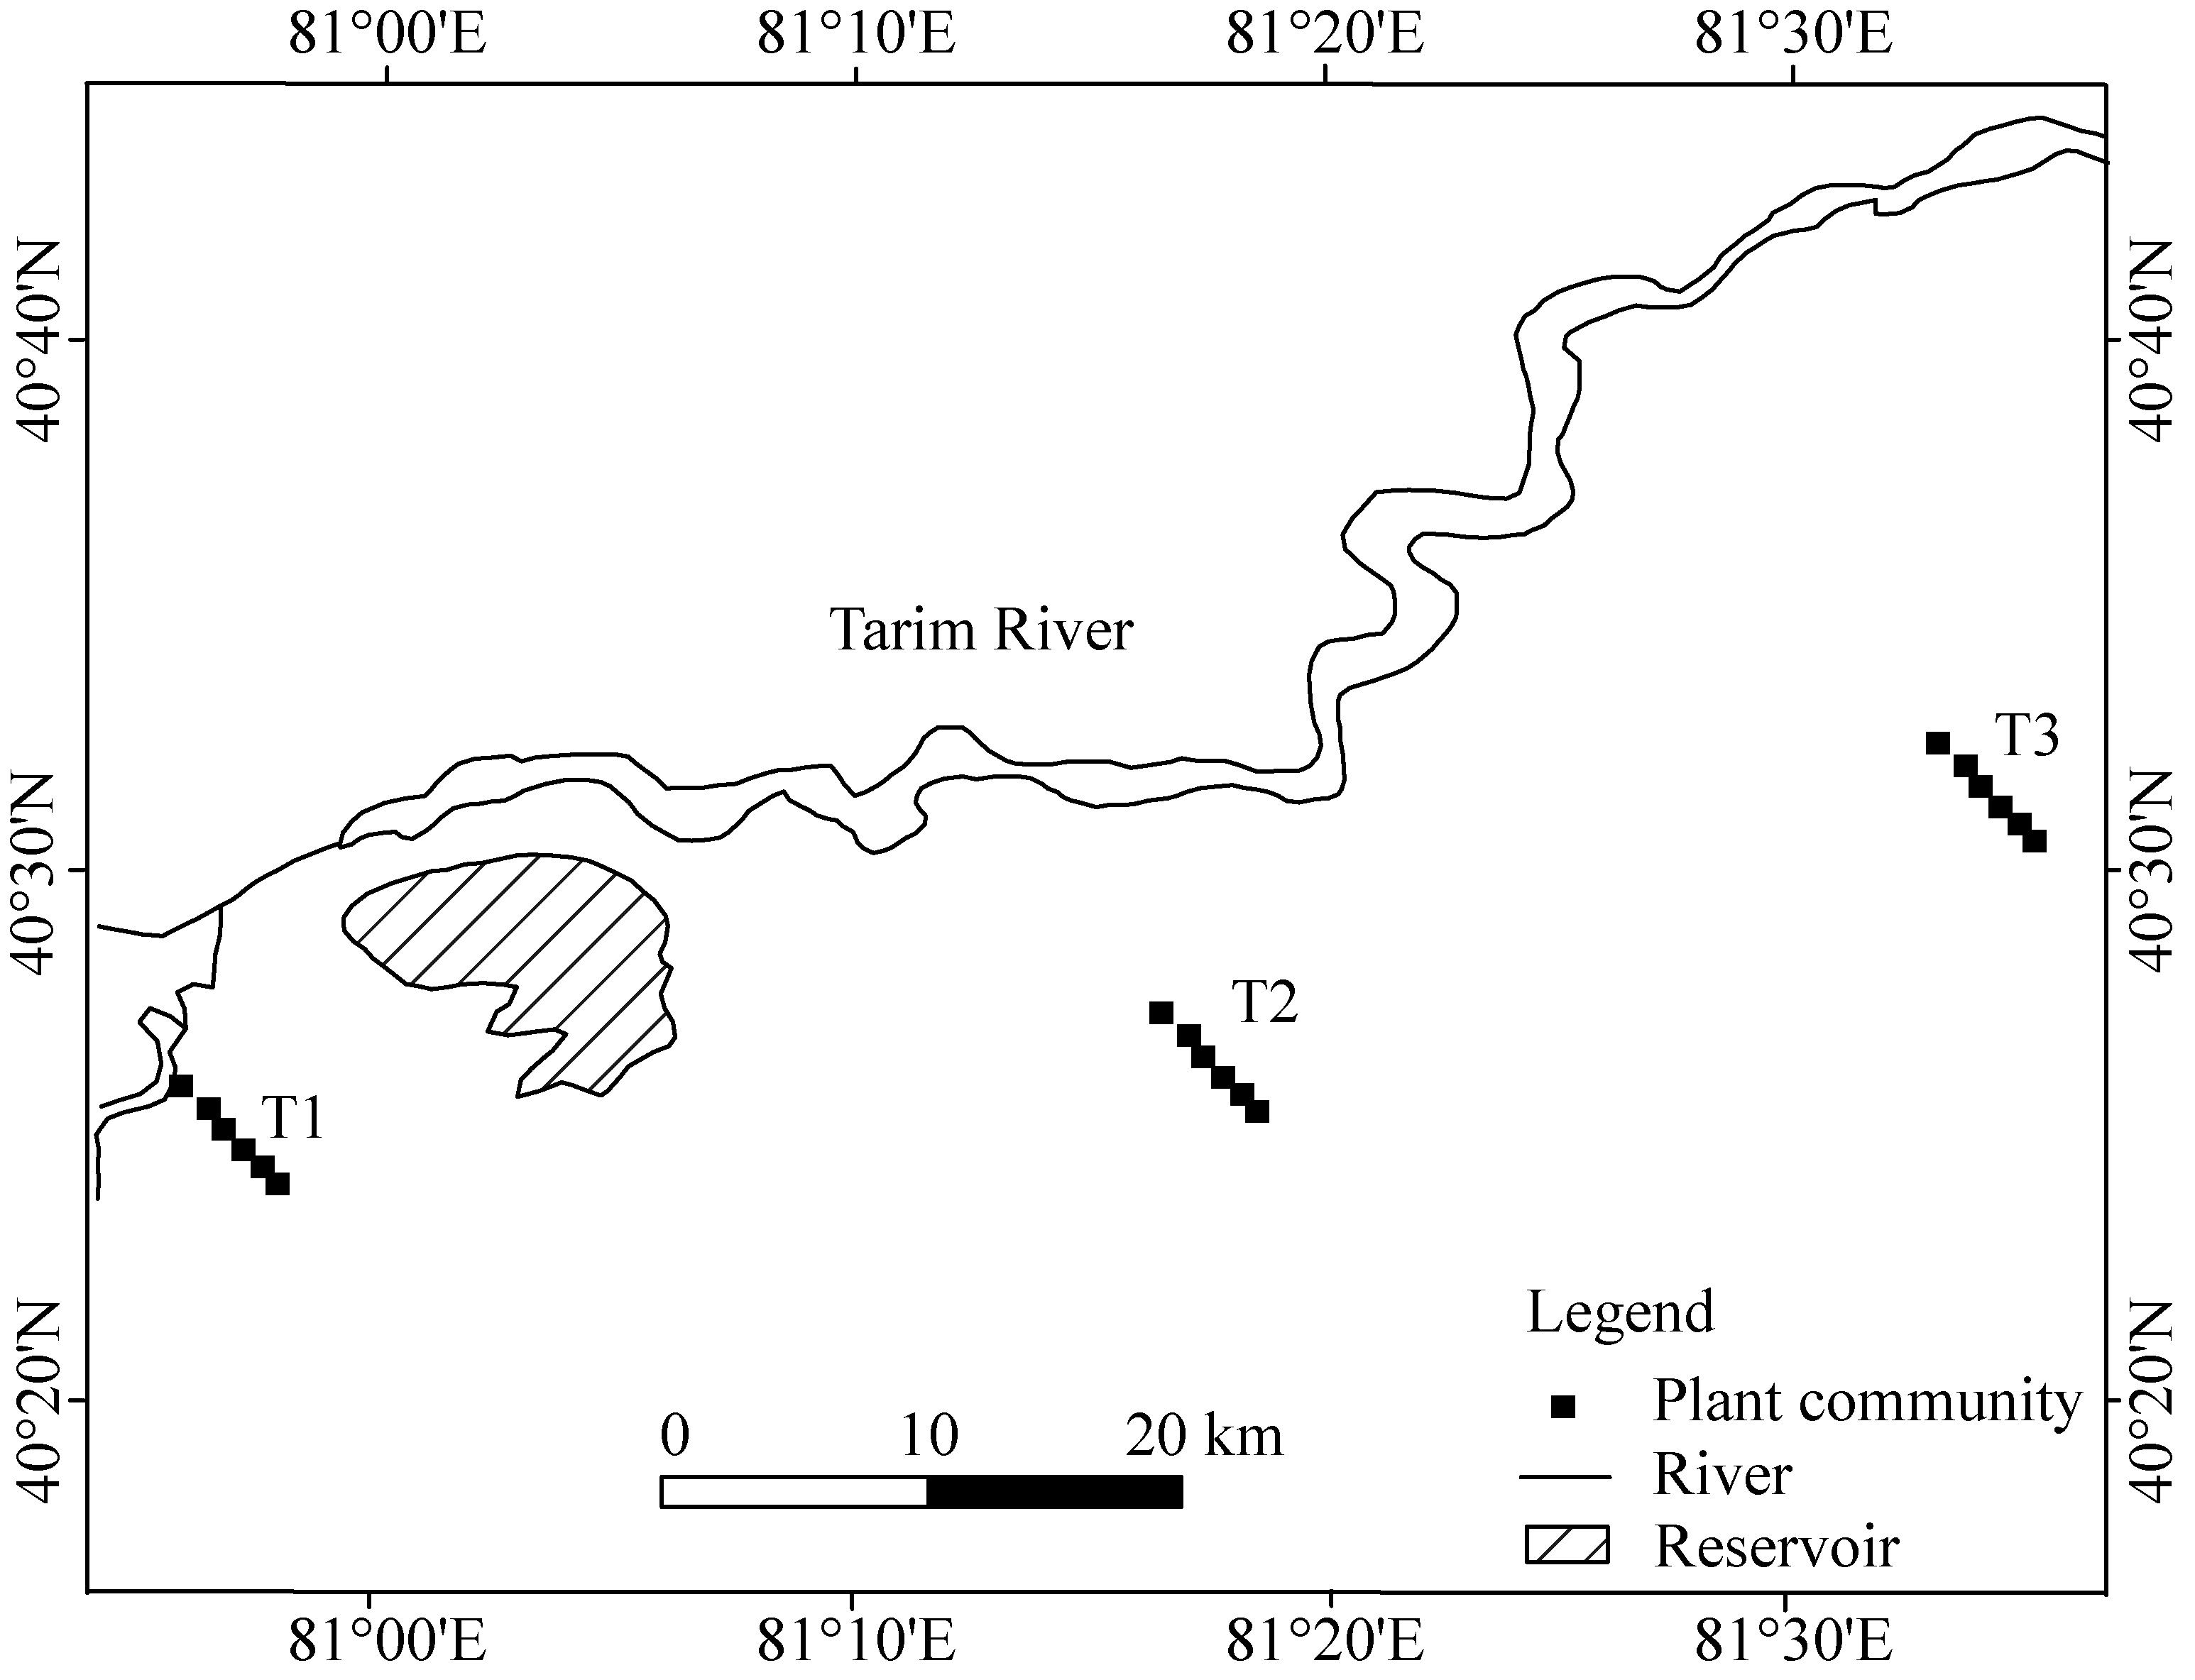
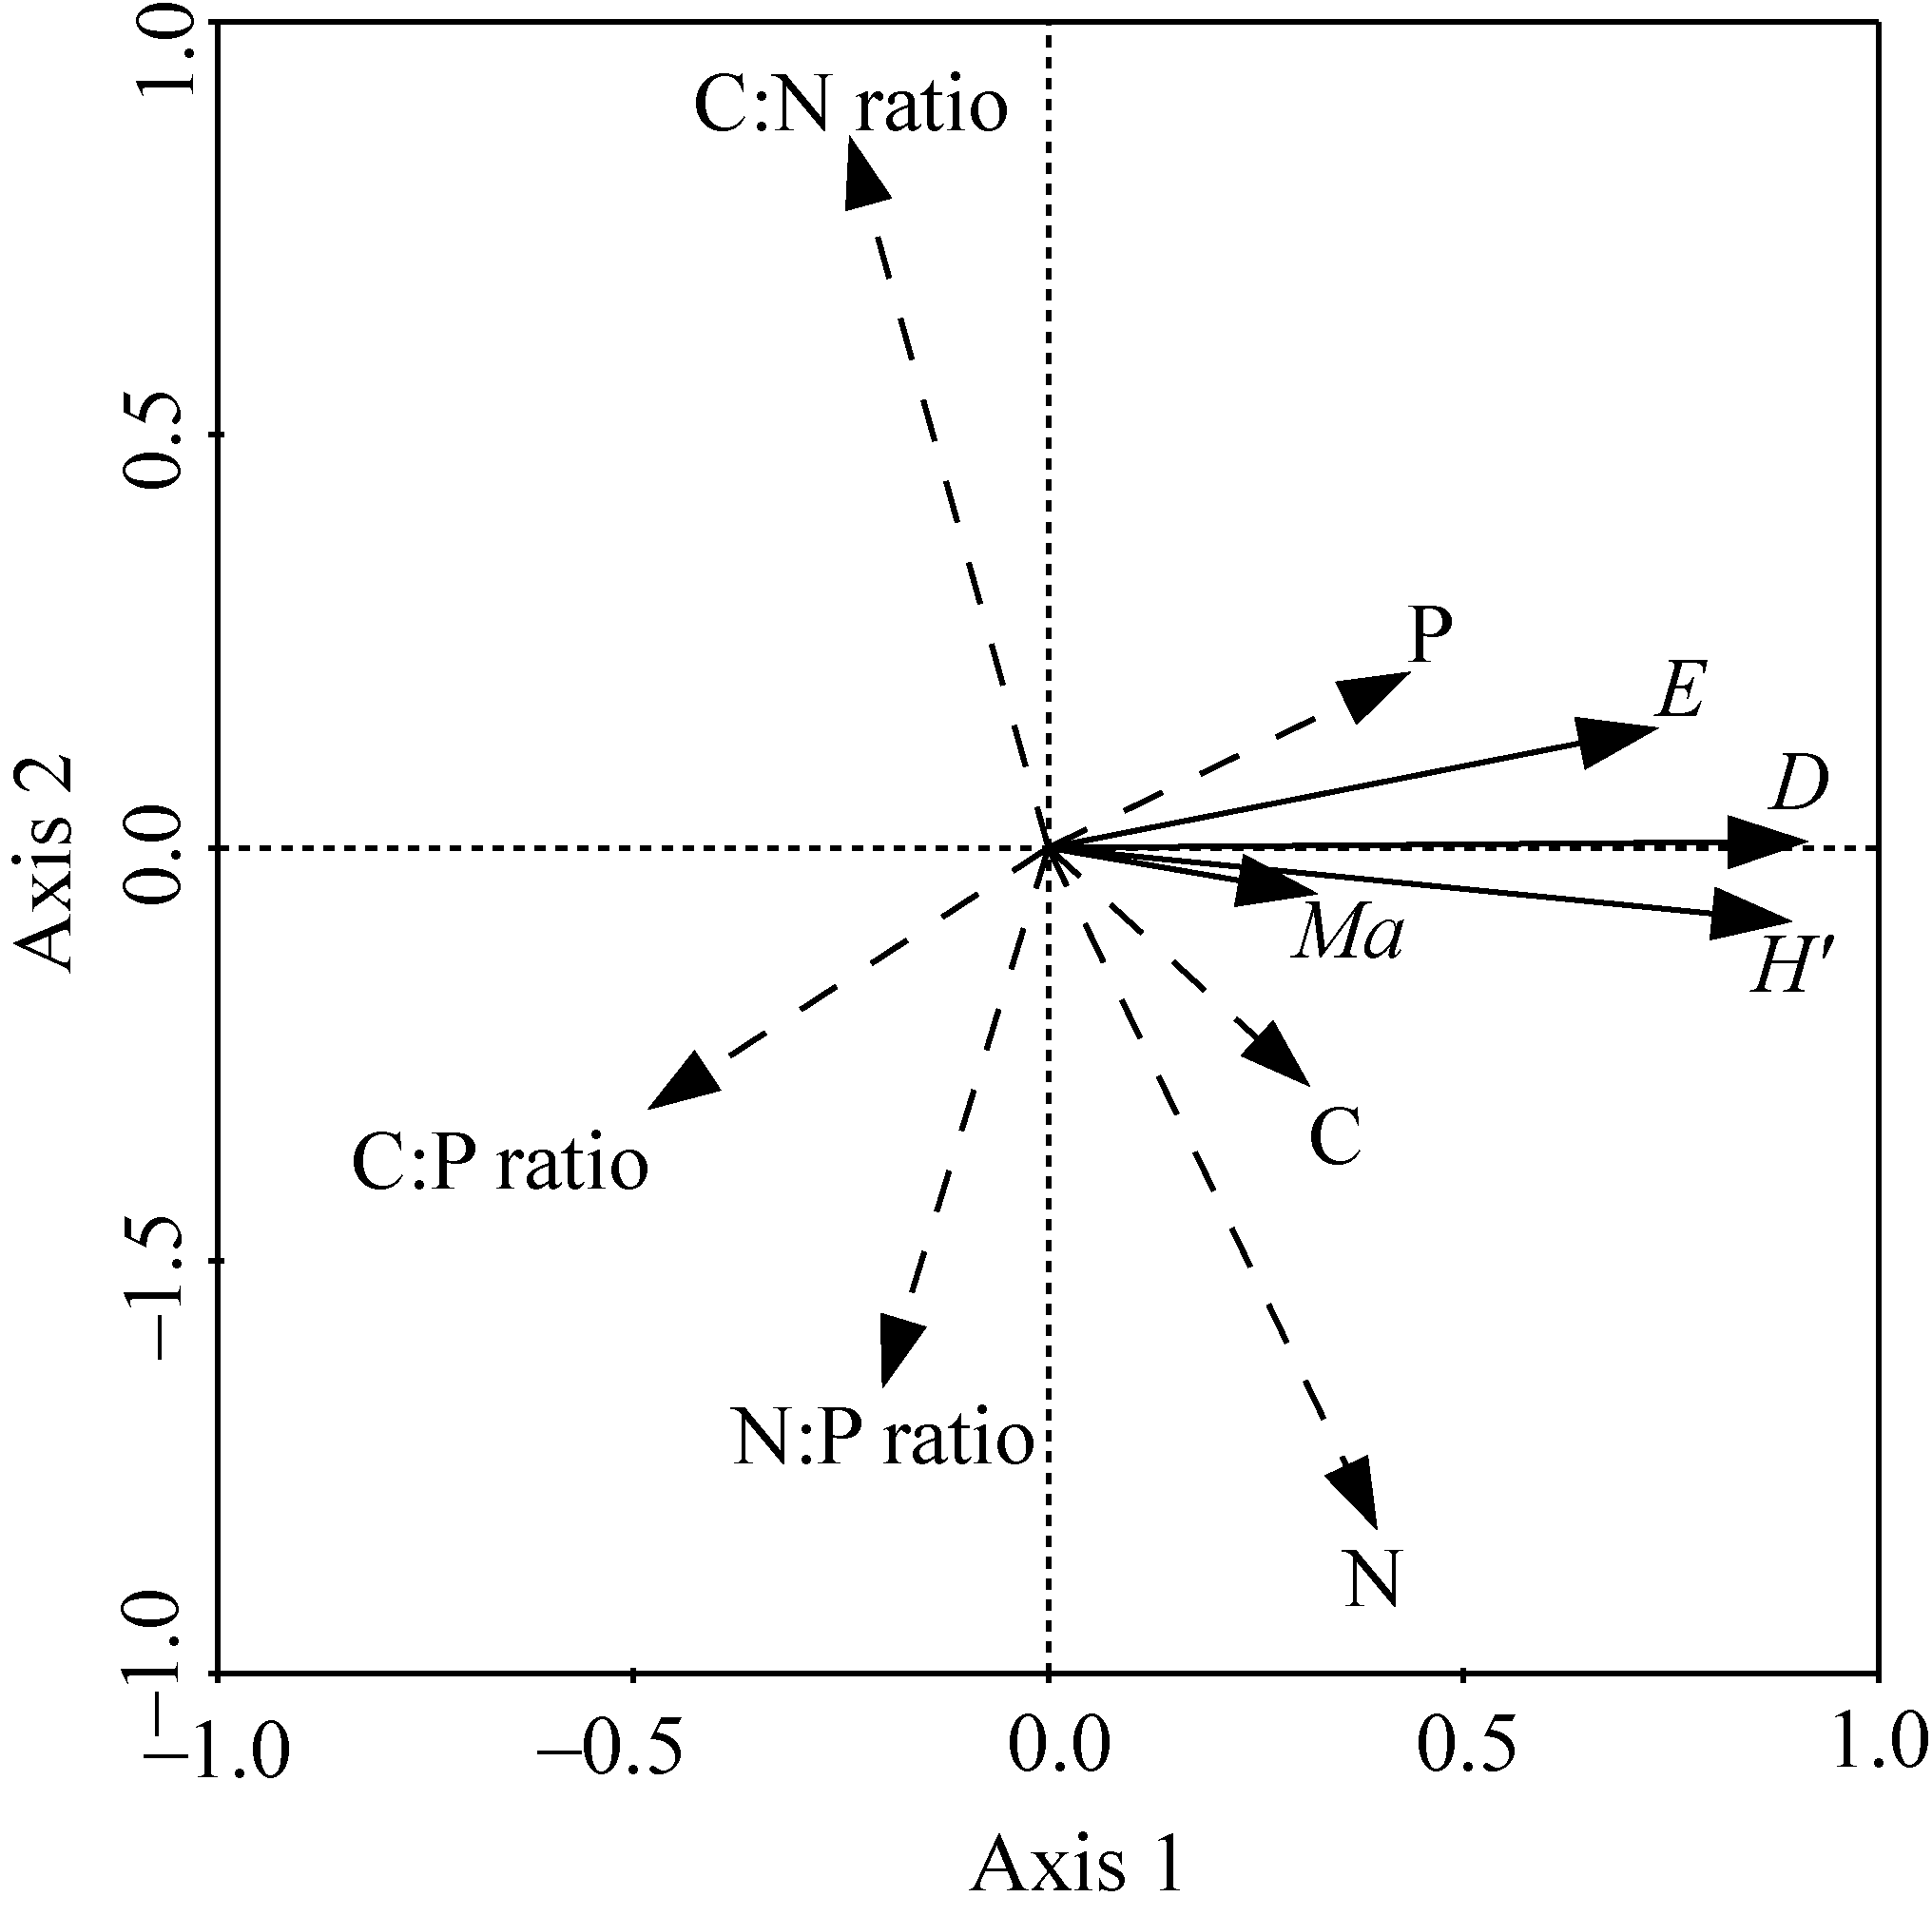
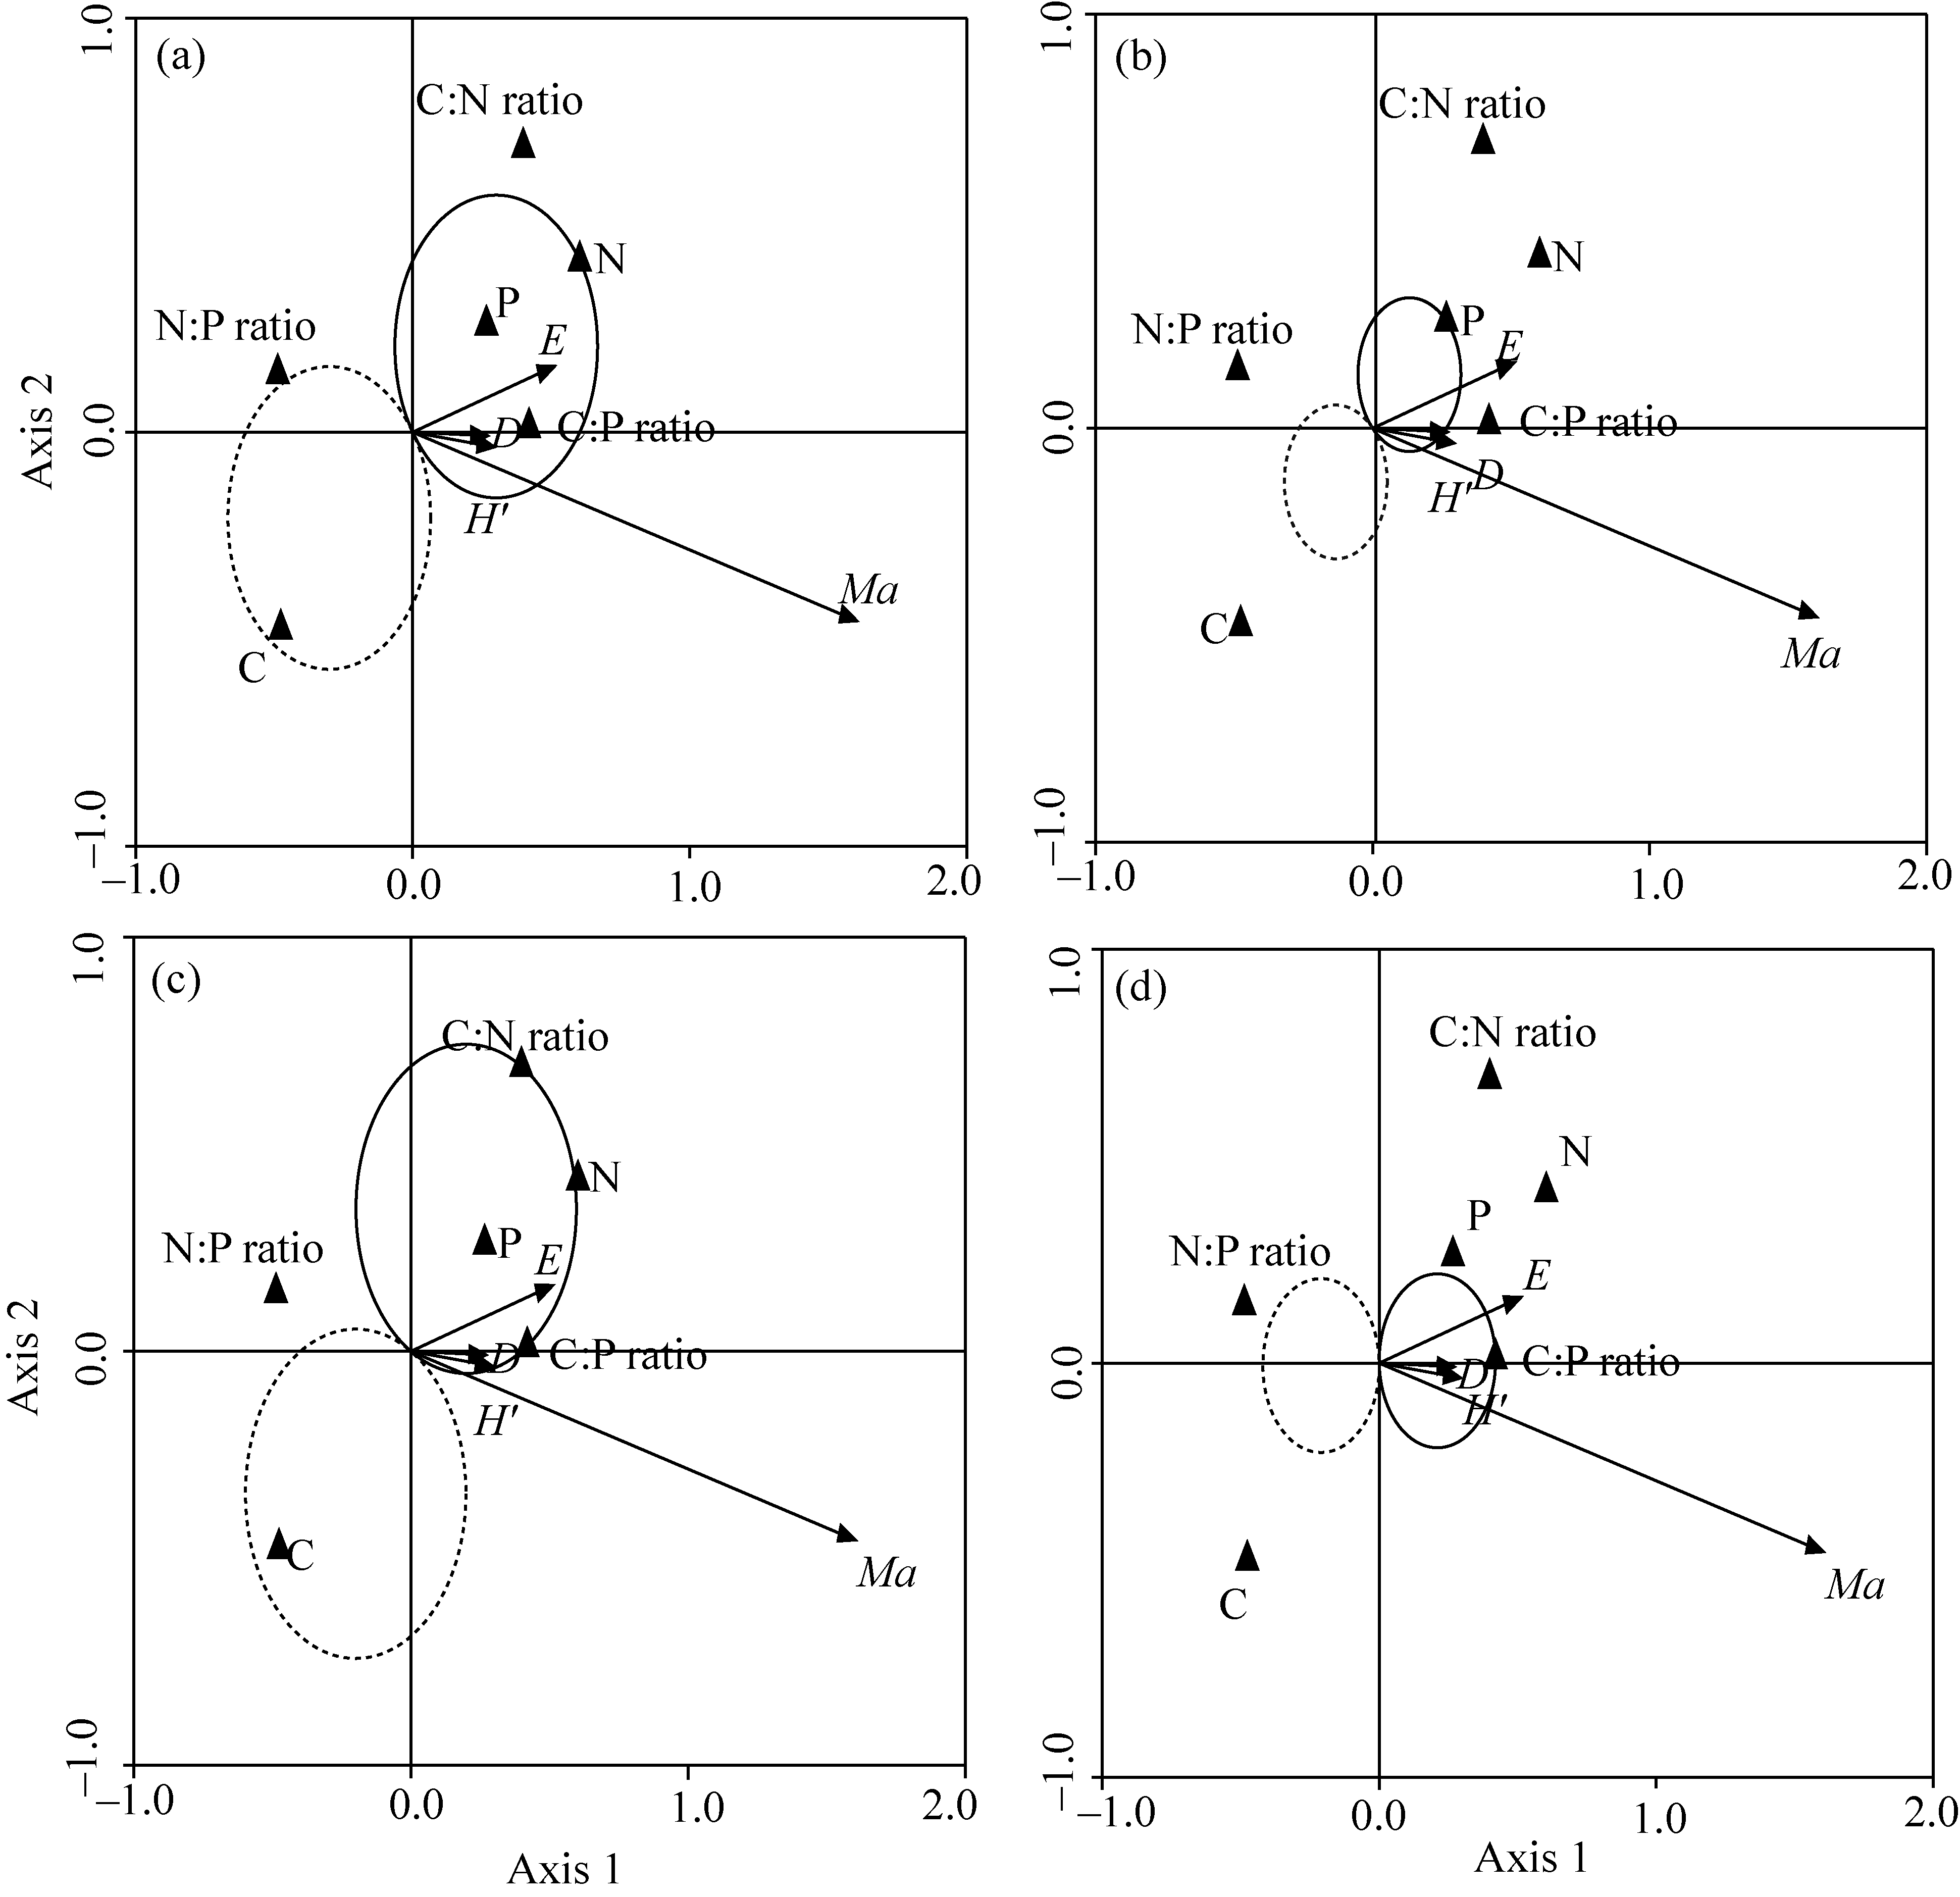
Abstract Changes in ecological stoichiometry reflect nitrogen (N), phosphorus (P) and both N and P limitations in a plant community, which in turn affect plant diversity of the community. However, the relationship between plant community diversity and ecological stoichiometry has not yet been fully researched in arid and semi-arid regions. Ecological stoichiometry and plant community diversity indices of eighteen communities in the upper reaches of Tarim River, northwestern China, were analyzed by multivariate analysis of variance in 2016. The correlation between ecological stoichiometry and plant community diversity was assessed by redundancy analysis (RDA). Results indicated that the Margalef index was significantly correlated with carbon (C) and P concentrations, the Simpson index and Shannon-Weaner index were significantly correlated with plant C concentration, and the Pielou index was significantly correlated with plant C and N concentrations. Moreover, C:N and C:P ratios had significant impacts on plant community diversity. Our results highlight the importance of ecological stoichiometry in driving plant community diversity in the upper reaches of Tarim River, northwestern China.
|
|
Received: 25 December 2018
Published: 10 March 2020
|
|
Corresponding Authors:
|
| About author: *Corresponding author: GONG Lu (E-mail: gonglu721@163.com) |
|
|
| [1] |
Allen A P, Gillooly J F. 2009. Towards an integration of ecological stoichiometry and the metabolic theory of ecology to better understand nutrient cycling. Ecology Letter, 12(5): 369-384.
doi: 10.1111/j.1461-0248.2009.01302.x
pmid: 19379132
|
|
|
| [2] |
Bao S N. 2000. Soil Agrochemical Analysis. Beijing: China Agricultural Press, 20-38. (in Chinese)
|
|
|
| [3] |
Behera S K, Mishra A K, Sahu N, et al. 2012. The study of microclimate in response to different plant community association in tropical moist deciduous forest from northern India. Biodiversity and Conservation, 21(5): 1159-1176.
doi: 10.1007/s10531-012-0230-5
|
|
|
| [4] |
Bell D W, Denham S, Smith E M, et al. 2018. Temporal variability in ecological stoichiometry and material exchange in a tidally dominated estuary (North Inlet, South Carolina) and the impact on community nutrient status. Estuaries and Coasts, 41(8): 2223-2239.
doi: 10.1007/s12237-018-0430-7
|
|
|
| [5] |
Bu C N, Wang Y, Ge C H, et al. 2017. Dissimilatory nitrate reduction to ammonium in the Yellow River Estuary: Rates, abundance, and community diversity. Scientific Reports, 7(1): 6830-6853.
doi: 10.1038/s41598-017-06404-8
pmid: 28754970
|
|
|
| [6] |
Bustos-Segura C, Poelman E H, Reichelt M, et al. 2017. Intraspecific chemical diversity among neighbouring plants correlates positively with plant size and herbivore load but negatively with herbivore damage. Ecology Letters, 20(1): 87-97.
doi: 10.1111/ele.12713
pmid: 28000435
|
|
|
| [7] |
Cao Y, Chen Y M. 2017. Ecosystem C:N:P stoichiometry and carbon storage in plantations and a secondary forest on the Loess Plateau, China. Ecological Engineering, 105: 125-132.
doi: 10.1016/j.ecoleng.2017.04.024
|
|
|
| [8] |
Castellanos A E, Llano-Sotelo J M, Machado-Encinas L I, et al. 2018. Foliar C, N, and P stoichiometry characterize successful plant ecological strategies in the Sonoran Desert. Plant Ecology, 219(7): 775-788.
doi: 10.1007/s11258-018-0833-3
|
|
|
| [9] |
Chen Y. 2013. Habitat suitability modeling of amphibian species in southern and central China: environmental correlates and potential richness mapping. Science China Life Sciences, 56(5): 476-484.
doi: 10.1007/s11427-013-4475-3
pmid: 23633079
|
|
|
| [10] |
Conti G, Díaz S. 2013. Plant functional diversity and carbon storage-an empirical test in semi-arid forest ecosystems. Journal of Ecology, 101(1): 18-28.
doi: 10.1111/1365-2745.12012
|
|
|
| [11] |
Elser J J, Fagan W F, Denno R F, et al. 2000. Nutritional constraints in terrestrial and freshwater food webs. Nature, 408(6812): 578-580.
doi: 10.1038/35046058
pmid: 11117743
|
|
|
| [12] |
Elser J J, Bracken M E S, Cleland E E, et al. 2007. Global analysis of nitrogen and phosphorus limitation of primary producers in freshwater, marine and terrestrial ecosystems. Ecology Letters, 10(12): 1135-1142.
doi: 10.1111/j.1461-0248.2007.01113.x
pmid: 17922835
|
|
|
| [13] |
Elser J J, Sterner R W, Gorokhova E, et al. 2010. Biological stoichiometry from genes to ecosystems. Ecology Letters, 3(6): 540-550.
doi: 10.1046/j.1461-0248.2000.00185.x
|
|
|
| [14] |
Frenken T, Wierenga J, Gsell A S, et al. 2017. Changes in N:P supply ratios affect the ecological stoichiometry of a toxic cyanobacterium and its fungal parasite. Frontiers in Microbiology, 8(1015): 115-126.
doi: 10.3389/fmicb.2017.01015
pmid: 28634476
|
|
|
| [15] |
Freudenberger L, Hobson P R, Schluck M, et al. 2012. A global map of the functionality of terrestrial ecosystems. Ecological Complexity, 12(1): 13-22.
doi: 10.1016/j.ecocom.2012.08.002
|
|
|
| [16] |
Frost P C, Stelzer R S, Lamberti G A, et al. 2002. Ecological stoichiometry of trophic interactions in the benthos: Understanding the role of C:N:P ratios in lentic and lotic habitats. Journal of the North American Benthological Society, 21(4): 515-528.
doi: 10.2307/1468427
|
|
|
| [17] |
Gong L, He G, Liu W G. 2016. Long-term cropping effects on agricultural sustainability in Alar Oasis of Xinjiang, China. Sustainability, 8(1): 61-78.
doi: 10.3390/su8010061
|
|
|
| [18] |
Grażyna P, Ostrowska A. 2018. Nutrient demand and elemental stoichiometry of plants in wetland ecosystems in the Biebrza Valley, Poland. Journal of Elementology, 23(3): 887-899.
|
|
|
| [19] |
Haddad N M, Crutsinger G M, Gross K, et al. 2011. Plant diversity and the stability of foodwebs. Ecology Letters, 14(1): 42-46.
doi: 10.1111/j.1461-0248.2010.01548.x
|
|
|
| [20] |
Halvorson H M, Sperfeld E, Evans-White M A. 2017. Quantity and quality limit detritivore growth: mechanisms revealed by ecological stoichiometry and co-limitation theory. Ecology, 98(12): 2995-3002.
doi: 10.1002/ecy.2026
pmid: 28902394
|
|
|
| [21] |
Heyburn J, Mckenzie P, Crawley M J, et al. 2017. Effects of grassland management on plant C:N:P stoichiometry: implications for soil element cycling and storage. Ecosphere, 8(10): 156-177.
|
|
|
| [22] |
Hsu J C. 1996. Multiple Comparisons. New York: Springer, 56-66.
|
|
|
| [23] |
Huang J, Yu H, Liu J, et al. 2018. Phosphorus addition changes belowground biomass and C:N:P stoichiometry of two desert steppe plants under simulated N deposition. Scientific Reports, 8: 3400.
doi: 10.1038/s41598-018-21565-w
pmid: 29467375
|
|
|
| [24] |
Kerkhoff A J, Enquist B J, Elser J J, et al. 2005. Plant allometry, stoichiometry and the temperature-dependence of primary productivity. Global Ecology and Biogeography, 14(6): 585-598.
doi: 10.1111/j.1466-822X.2005.00187.x
|
|
|
| [25] |
Li Y G, Zhou X B, Zhang Y M. 2019. Shrub modulates the stoichiometry of moss and soil in desert ecosystems, China. Journal of Arid Land, 11(4): 579-594.
doi: 10.1007/s40333-019-0057-y
|
|
|
| [26] |
Liu J, Liang S C, Liu F H, et al. 2005. Invasive alien plant species in China: regional distribution patterns. Diversity and Distributions, 11(4): 341-347.
doi: 10.1016/j.jenvman.2019.03.061
pmid: 30927576
|
|
|
| [27] |
Liu Z F, Fu B J, Zheng X X, et al. 2010. Plant biomass, soil water content and soil N:P ratio regulating soil microbial functional diversity in a temperate steppe: A regional scale study. Soil Biology and Biochemistry, 42(3): 445-450.
doi: 10.1016/j.soilbio.2009.11.027
|
|
|
| [28] |
Liu Z Y, Baoyin T, Sun J, et al. 2018. Plant sizes mediate mowing-induced changes in nutrient stoichiometry and allocation of a perennial grass in semi-arid grassland. Ecology and Evolution, 8(6): 3109-3118.
doi: 10.1002/ece3.3866
pmid: 29607010
|
|
|
| [29] |
Makino W, Cotner J B, Sterner R W, et al. 2003. Are bacteria more like plants or animals? Growth rate and resource dependence of bacterial C:N:P stoichiometry. Functional Ecology, 17(1): 121-130.
doi: 10.1046/j.1365-2435.2003.00712.x
|
|
|
| [30] |
Merritt D M, Nilsson C, Jansson R. 2010. Consequences of propagule dispersal and river fragmentation for riparian plant community diversity and turnover. Ecological Monographs, 80(4): 609-626.
doi: 10.1890/09-1533.1
|
|
|
| [31] |
Moorthi S D, Schmitt J A, Ryabov A, et al. 2016. Unifying ecological stoichiometry and metabolic theory to predict production and trophic transfer in a marine planktonic food web. Philosophical Transactions of the Royal Society B Biological Sciences, 371(1694): 1-10.
doi: 10.1098/rstb.2015.0270
pmid: 27114573
|
|
|
| [32] |
Naeem S, Li S. 1997. Biodiversity enhances ecosystem reliability. Nature, 390(6659): 507-509.
doi: 10.1038/37348
|
|
|
| [33] |
Pelini S L, Diamond S E, Nichols L M, et al. 2014. Geographic differences in effects of experimental warming on ant species diversity and community composition. Ecosphere, 5(10): 1-12.
|
|
|
| [34] |
Plach J M, Macrae M L, Ali G A, et al. 2017. Supply and transport limitations on phosphorus losses from agricultural fields in the lower great lakes region, Canada. Journal of Environmental Quality, 47(1): 96-105.
doi: 10.2134/jeq2017.06.0234
pmid: 29415113
|
|
|
| [35] |
Qu F Z, Meng L, Yu J B, et al. 2017. Influences of micro-geomorphology on the stoichiometry of C, N and P in chenier island soils and plants in the Yellow River Delta, China. PloS ONE, 12(12): e0189431.
doi: 10.1371/journal.pone.0189431
pmid: 29236766
|
|
|
| [36] |
Reich P B, Hobbie S E, Lee T, et al. 2006. Nitrogen limitation constrains sustainability of ecosystem response to CO2. Nature, 440(7086): 922-925.
doi: 10.1038/nature04486
pmid: 16612381
|
|
|
| [37] |
Saitta A, Anslan S, Bahram M, et al. 2018. Tree species identity and diversity drive fungal richness and community composition along an elevational gradient in a Mediterranean ecosystem. Mycorrhiza, 28(1): 39-47.
doi: 10.1007/s00572-017-0806-8
pmid: 29110091
|
|
|
| [38] |
Sardans J, Rivas-Ubach A, Peñuelas J. 2011. Factors affecting nutrient concentration and stoichiometry of forest trees in Catalonia (NE Spain). Forest Ecology and Management, 262(11): 2024-2034.
doi: 10.1016/j.foreco.2011.08.019
|
|
|
| [39] |
Seastedt T R, Vaccaro L. 2001. Plant species richness, productivity, and nitrogen and phosphorus limitations across a snowpack gradient in alpine tundra, Colorado, U.S.A. Arctic Antarctic & Alpine Research, 33(1): 100-106.
|
|
|
| [40] |
Shang B, Feng Z, Li P, et al. 2018. Elevated ozone affects C, N and P ecological stoichiometry and nutrient resorption of two poplar clones. Environmental Pollution, 234: 136-144.
doi: 10.1016/j.envpol.2017.11.056
pmid: 29175475
|
|
|
| [41] |
Snyder W E, Snyder G B, Finke D L, et al. 2006. Predator biodiversity strengthens herbivore suppression. Ecology Letters, 9(7): 789-796.
doi: 10.1111/j.1461-0248.2006.00922.x
pmid: 16796568
|
|
|
| [42] |
Soufbaf M, Fathipour Y, Hui C. 2017. Artificial diversity of plant-insect communities and modern crop stoichiometry in small closed patches in greenhouse. Journal of Agricultural Science and Technology, 19(6): 1291-1302.
|
|
|
| [43] |
Sperfeld E, Wagner N D, Halvorson H M, et al. 2017. Bridging ecological stoichiometry and nutritional geometry with homeostasis concepts and integrative models of organism nutrition. Functional Ecology, 31(2): 286-296.
doi: 10.1111/fec.2017.31.issue-2
|
|
|
| [44] |
Sures B, Knopf K, Würtz J, et al. 1999. Richness and diversity of parasite communities in European eels Anguilla anguilla of the River Rhine, Germany, with special reference to helminth parasites. Parasitology, 119(3): 323-330.
doi: 10.1017/s0031182099004655
pmid: 10503258
|
|
|
| [45] |
Tao Y, Wu G L, Zhang Y M, et al. 2016. Leaf N and P stoichiometry of 57 plant species in the Karamori Mountain Ungulate Nature Reserve, Xinjiang, China. Journal of Arid Land, 8(6): 935-947.
doi: 10.1007/s40333-016-0019-6
|
|
|
| [46] |
Tilman D, Wedin D, Knops J. 1996. Productivity and sustainability influenced by biodiversity in grassland ecosystems. Nature, 379(6567): 718-720.
doi: 10.1038/379718a0
|
|
|
| [47] |
Tuboi C, Hussain S A. 2018. Plant community structure of the floating meadows of a hypereutrophic wetland in the Indo-Burma biodiversity hotspot. Aquatic Botany, 150: 71-81.
doi: 10.1016/j.aquabot.2018.06.006
|
|
|
| [48] |
Vilela D S, Ferreira R G, Del-Claro K. 2016. The Odonata community of a Brazilian vereda: seasonal patterns, species diversity and rarity in a palm swamp environment. Bioscience Journal, 32(2): 486-495.
doi: 10.1002/1521-4141(200202)32:2<486::AID-IMMU486>3.0.CO;2-U
pmid: 11828365
|
|
|
| [49] |
Xiang Y L, Xiang Y X, Wang L P, et al. 2018. Effects of sewage sludge modified by coal gasification slag and electron beam irradiation on the growth of Alhagi sparsifolia Shap. and transfer of heavy metals. Environmental Science and Pollution Research, 25(12): 11636-11645.
doi: 10.1007/s11356-018-1253-6
pmid: 29429113
|
|
|
| [50] |
Yachi S, Loreau M. 1999. Biodiversity and ecosystem productivity in a fluctuating environment: the insurance hypothesis. Proceedings of the National Academy of Sciences of the United States of America, 96(4): 1463-1471.
|
|
|
| [51] |
Yan E R, Wang X H. 2008. N:P stoichiometry in secondary succession in evergreen broad-leaved forest, Tiantong, East China. Journal of Plant Ecology, 32(1): 13-22. (in Chinese)
|
|
|
| [52] |
Yan W, Zhong Y, Zheng S, et al. 2016. Linking plant leaf nutrients/stoichiometry to water use efficiency on the Loess Plateau in China. Ecological Engineering, 87(12): 124-131.
doi: 10.1016/j.ecoleng.2015.11.034
|
|
|
| [53] |
Yan Z B, Kim N, Han X W, et al. 2015. Effects of nitrogen and phosphorus supply on growth rate, leaf stoichiometry, and nutrient resorption of Arabidopsis thaliana. Plant and Soil, 388(1-2): 147-155.
doi: 10.1007/s11104-014-2316-1
|
|
|
| [54] |
Yan Z, Han W X, Peñuelas J, et al. 2016. Phosphorus accumulates faster than nitrogen globally in freshwater ecosystems under anthropogenic impacts. Ecology Letters, 19(10): 1237-1246.
doi: 10.1111/ele.12658
pmid: 27501082
|
|
|
| [55] |
Yang Y, Liu B R, An S S. 2018. Ecological stoichiometry in leaves, roots, litters and soil among different plant communities in a desertified region of Northern China. Catena, 166: 328-338.
doi: 10.1016/j.catena.2018.04.018
|
|
|
| [56] |
Yang Y H, Chen Y N, Li W L. 2009. Relationship between soil properties and plant diversity in a desert riparian forest in the lower reaches of the Tarim River, Xinjiang, China. Arid Land Research and Management, 23(4): 283-296.
doi: 10.1080/15324980903231991
|
|
|
| [57] |
Yang Y H, Luo Y. 2011. Carbon: nitrogen stoichiometry in forest ecosystems during stand development. Global Ecology and Biogeography, 20(2): 354-361.
doi: 10.1111/j.1466-8238.2010.00602.x
|
|
|
| [58] |
Yu H, Fan J, Harris W, et al. 2017a. Relationships between below-ground biomass and foliar N:P stoichiometry along climatic and altitudinal gradients of the Chinese grassland transect. Plant Ecology, 218(6): 661-667.
doi: 10.1007/s11258-017-0719-9
|
|
|
| [59] |
Yu H, Fan J, Li Y. 2017b. Foliar carbon, nitrogen, and phosphorus stoichiometry in a grassland ecosystem along the Chinese grassland transect. Acta Ecologica Sinica, 37(3): 133-139. (in Chinese)
doi: 10.1016/j.chnaes.2017.06.005
|
|
|
| [60] |
Zechmeister-Boltenstern S, Keiblinger K M, Mooshammer M, et al. 2015. The application of ecological stoichiometry to plant-microbial-soil organic matter transformations. Ecological Monographs, 85(2): 133-155.
doi: 10.1890/14-0777.1
|
|
|
| [61] |
Zeng Q, Lal R, Chen Y, et al. 2017. Soil, leaf and root ecological stoichiometry of Caragana korshinskii on the Loess Plateau of China in relation to plantation age. PloS ONE, 12(1): e0168890.
doi: 10.1371/journal.pone.0168890
pmid: 28076357
|
|
|
| [62] |
Zhang B, Gui D W, Gao X P, et al. 2018. Controlling soil factor in plant growth and salt tolerance of leguminous plant Alhagi sparsifolia Shap. in saline deserts, Northwest China. Contemporary Problems of Ecology, 11(1): 111-121.
doi: 10.1134/S199542551801002X
|
|
|
| [63] |
Zhang C H, Willis C G, Klein J A, et al. 2017. Recovery of plant species diversity during long-term experimental warming of a species-rich alpine meadow community on the Qinghai-Tibet Plateau. Biological Conservation, 213: 218-224.
doi: 10.1016/j.biocon.2017.07.019
|
|
|
| [64] |
Zhang J, Zhao N, Liu C, et al. 2017. C:N:P stoichiometry in China's forests: From organs to ecosystems. Functional Ecology, 55(10): 33-68.
doi: 10.1371/journal.pone.0116391
pmid: 25664764
|
|
|
| [65] |
Zhang Q, Bell L W, Shen Y, et al. 2018. Indices of forage nutritional yield and water use efficiency amongst spring-sown annual forage crops in north-west China. European Journal of Agronomy, 93(5): 1-10.
doi: 10.1016/j.eja.2017.11.003
|
|
|
| [66] |
Zhao Y J, Liu B, Zhang W G, et al. 2010. Effects of plant and influent C:N:P ratio on microbial diversity in pilot-scale constructed wetlands. Ecological Engineering, 36(4): 441-449.
doi: 10.1016/j.ecoleng.2009.11.011
|
|
|
|
Viewed |
|
|
|
Full text
|
|
|
|
|
Abstract
|
|
|
|
|
Cited |
|
|
|
|
| |
Shared |
|
|
|
|
| |
Discussed |
|
|
|
|