| Research article |
|


|
|
|
| Assessment of river basin habitat quality and its relationship with disturbance factors: A case study of the Tarim River Basin in Northwest China |
HE Bing, CHANG Jianxia*( ), GUO Aijun*(), WANG Yimin, WANG Yan, LI Zhehao ), GUO Aijun*(), WANG Yimin, WANG Yan, LI Zhehao |
| State Key Laboratory of Eco-hydraulics in Northwest Arid Region of China, Xi'an University of Technology, Xi'an 710048, China |
|
|
|
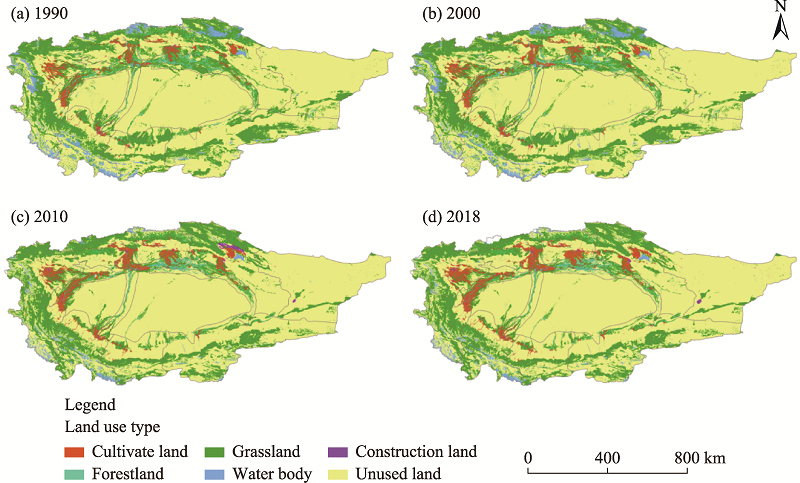
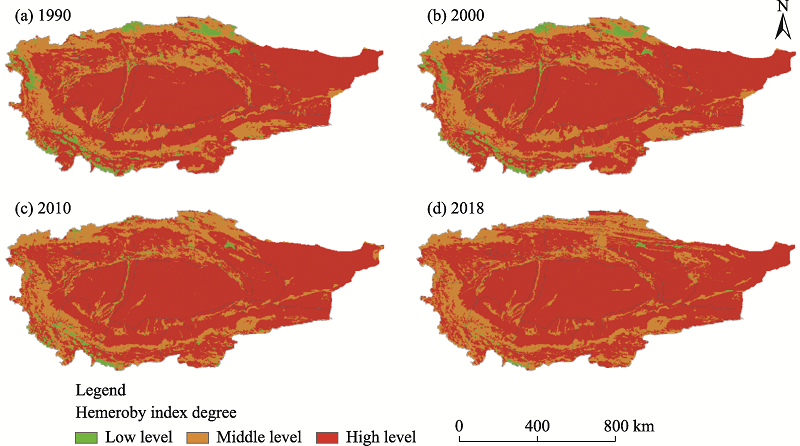
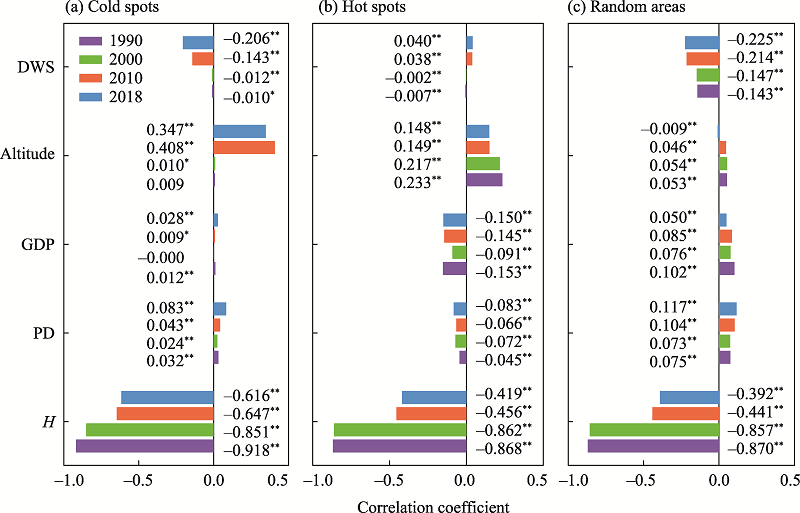
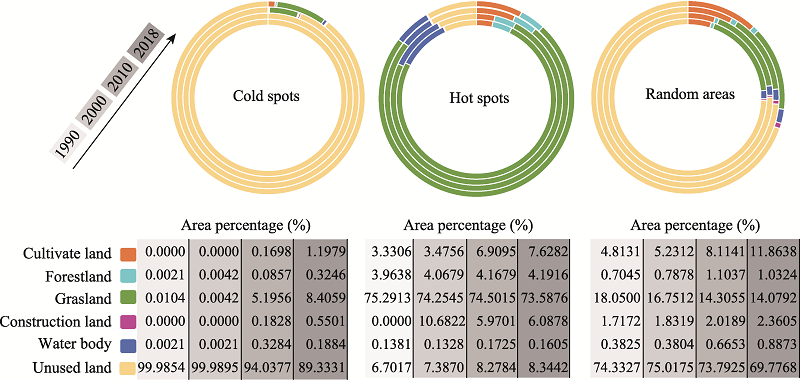
Abstract The status of regional biodiversity is determined by habitat quality. The effective assessment of habitat quality can help balance the relationship between economic development and biodiversity conservation. Therefore, this study used the InVEST model to conduct a dynamic evaluation of the spatial and temporal changes in habitat quality of the Tarim River Basin in southern Xinjiang Uygur Autonomous Region of China by calculating the degradation degree levels for habitat types that were caused by threat factors from 1990 to 2018 (represented by four periods of 1990, 2000, 2010 and 2018). Specifically, we used spatial autocorrelation analysis and Getis-Ord G* i analysis to divide the study area into three heterogeneous units in terms of habitat quality: cold spot areas, hot spot areas and random areas. Hemeroby index, population density, gross domestic product (GDP), altitude and distance from water source (DWS) were then chosen as the main disturbance factors. Linear correlation and spatial regression models were subsequently used to analyze the influences of disturbance factors on habitat quality. The results demonstrated that the overall level of habitat quality in the TRB was poor, showing a continuous degradation state. The intensity of the negative correlation between habitat quality and Hemeroby index was proven to be strongest in cold spot areas, hot spot areas and random areas. The spatial lag model (SLM) was better suited to spatial regression analysis due to the spatial dependence of habitat quality and disturbance factors in heterogeneous units. By analyzing the model, Hemeroby index was found to have the greatest impact on habitat quality in the studied four periods (1990, 2000, 2010 and 2018). The research results have potential guiding significance for the formulation of reasonable management policies in the TRB as well as other river basins in arid areas.
|
|
Received: 28 May 2021
Published: 28 February 2022
|
|
Corresponding Authors:
*CHANG Jianxia (E-mail: chxiang@xaut.edu.cn);GUO Aijun (E-mail: aijunguo619@gmail.com)
|
|
|
| [1] |
Aneseyee A B, Noszczyk T, Elias T E. 2020. The InVEST habitat quality model associated with land use/cover changes: A qualitative case study of the Winike Watershed in the Omo-Gibe Basin, Southwest Ethiopia. Remote Sensing, 12(7):1103, doi: 10.3390/rs12071103.
doi: 10.3390/rs12071103
|
|
|
| [2] |
Anselin L. 1988. Spatial Econometrics: Methods and Models. California: Springer Netherlands, 119-136.
|
|
|
| [3] |
Anselin L. 2005. Exploring Spatial Data with GeoDa TM: A Workbook. Spatial Analysis Laboratory, Department of Geography, University of Illinois, USA. http://www.sal.uiuc.edu/stuff/stuff-sum/pdf/geodaworkbook.pdf .
|
|
|
| [4] |
Areendran G B D, Mehebub S, Kiranmay S, et al. 2021. Assessment and prediction of carbon sequestration using Markov Chain and InVEST model in Sariska Tiger Reserve, India. Journal of Cleaner Production, 278, doi: 10.1016/j.jclepro.2020.123333.
doi: 10.1016/j.jclepro.2020.123333
|
|
|
| [5] |
Balasooriya B L W K, Samson R, Mbikwa R, et al. 2008. Biomonitoring of urban habitat quality by anatomical and chemical leaf characteristics. Environmental and Experimental Botany, 65(2-3):386-394.
doi: 10.1016/j.envexpbot.2008.11.009
|
|
|
| [6] |
Chen A, Zhu B, Chen L, et al. 2010. Dynamic changes of landscape pattern and eco-disturbance degree in Shuangtai estuary wetland of Liaoning Province, China. Chinese Journal of Applied Ecology, 21(5):1120-1128. (in Chinese)
|
|
|
| [7] |
Chen Y, Li Z, Li W, et al. 2016. Water and ecological security: dealing with hydroclimatic challenges at the heart of China's Silk Road. Environmental Earth Sciences, 75(10):881, doi: 10.1007/s12665-016-5385-z.
doi: 10.1007/s12665-016-5385-z
|
|
|
| [8] |
Chen Y, Xu C, Chen Y,, et al. 2013. Progress, challenges and prospects of eco-hydrological studies in the Tarim River Basin of Xinjiang, China. Environmental Management, 51(1):138-153.
doi: 10.1007/s00267-012-9823-8
|
|
|
| [9] |
Chu L, Sun T, Wang T, et al. 2018. Evolution and prediction of landscape pattern and habitat quality based on CA-Markov and InVEST model in Hubei Section of Three Gorges Reservoir Area (TGRA). Sustainability, 10(11):1-28.
doi: 10.3390/su10020001
|
|
|
| [10] |
Coates P S, Casazza M L, Ricca M A, et al. 2016. Integrating spatially explicit indices of abundance and habitat quality: an applied example for greater sage-grouse management. Journal of Applied Ecology, 53(1):83-95.
pmid: 26877545
|
|
|
| [11] |
Costa G C, Nogueira C, Machado R B, et al. 2010. Sampling bias and the use of ecological niche modeling in conservation planning: a field evaluation in a biodiversity hotspot. Biodiversity and Conservation, 19(3):883-899.
doi: 10.1007/s10531-009-9746-8
|
|
|
| [12] |
Dai L, Li S, Lewis B J, et al. 2018. The influence of land use change on the spatial-temporal variability of habitat quality between 1990 and 2010 in Northeast China. Journal of Forestry Research, 30(1409), doi: 10.1007/s11676-018-0771-x.
doi: 10.1007/s11676-018-0771-x
|
|
|
| [13] |
Fellman J B, Hood E, Dryer E, et al. 2017. Stream physical characteristics impact habitat quality for Pacific Salmon in two temperate coastal watersheds. PLoS ONE, 10(7):e0132652, doi: 10.1371/journal.pone.0132652.
doi: 10.1371/journal.pone.0132652
|
|
|
| [14] |
Getis A, Ord J K. 1992. The analysis of spatial association by use of distance statistics. Geographical Analysis, 24(3):189-206.
doi: 10.1111/gean.1992.24.issue-3
|
|
|
| [15] |
Han R, Feng C, Xu N, et al. 2020. Spatial heterogeneous relationship between ecosystem services and human disturbances: A case study in Chuandong, China. Science of the Total Environment, 721:137818, doi: 10.1016/j.scitotenv.2020.137818.
doi: 10.1016/j.scitotenv.2020.137818
|
|
|
| [16] |
Hill M O, Roy D B, Thompson K. 2002. Hemeroby, urbanity and ruderality: bioindicators of disturbance and human impact. Journal of Applied Ecology, 39(5):708-720.
doi: 10.1046/j.1365-2664.2002.00746.x
|
|
|
| [17] |
Hillard E M, Nielsen C K, Groninger J W. 2017. Swamp rabbits as indicators of wildlife habitat quality in bottomland hardwood forest ecosystems. Ecological Indicators, 79(8):47-53.
doi: 10.1016/j.ecolind.2017.03.024
|
|
|
| [18] |
Hu X, Hong W, Qiu R, et al. 2015. Geographic variations of ecosystem service intensity in Fuzhou City, China. Science of the Total Environment, 512-513:215-226.
doi: 10.1016/j.scitotenv.2015.01.035
|
|
|
| [19] |
Huang L. 2020. Temporal and spatial variation of landscape biodiversity in Yarkant River Basin. MSc Thesis. Shihezi: Shihezi University. (in Chinese)
|
|
|
| [20] |
Isbell F, Reich P B, Tilman D, et al. 2013. Nutrient enrichment, biodiversity loss, and consequent declines in ecosystem productivity. Proceedings of the National Academy of Sciences, 110(29):11911-11916.
|
|
|
| [21] |
Leh M D K, Matlock M D, Cummings E C, et al. 2013. Quantifying and mapping multiple ecosystem services change in West Africa. Agriculture, Ecosystems and Environment, 165:6-18.
doi: 10.1016/j.agee.2012.12.001
|
|
|
| [22] |
Ling H, Guo B, Zhang G, et al. 2018. Evaluation of the ecological protective effect of the "large basin" comprehensive management system in the Tarim River basin, China. Science of the Total Environment, 650:1696-1706.
doi: 10.1016/j.scitotenv.2018.09.327
|
|
|
| [23] |
Liu F, Xu E. 2020. Comparison of spatial-temporal evolution of habitat quality between Xinjiang Corps and Non-corps Region based on land use. Chinese Journal of Applied Ecology, 37(7):2341-2351. (in Chinese)
|
|
|
| [24] |
Liu H, Li Z, Bai Y. 2006. Landscape simulating of habitat quality change for oriental white stork in Naoli River Watershed. Acta Ecologica Sinica, 26(12):4007-4013. (in Chinese)
|
|
|
| [25] |
Ma K M, Qin Y Q. 1998. Biodiversity conservation and its research progress. Chinese Journal of Applied and Environmental Biology, 4(1):96-100. (in Chinese)
|
|
|
| [26] |
Maes J, Paracchini M L, Zulian M L, et al. 2012. Synergies and trade-offs between ecosystem service supply, biodiversity, and habitat conservation status in Europe. Biological Conservation, 155:1-12.
doi: 10.1016/j.biocon.2012.06.016
|
|
|
| [27] |
Miller J R, Groom M, Hess G R, et al. 2010. Biodiversity conservation in local planning. Conservation Biology the Journal of the Society for Conservation Biology, 23(1):53-63.
doi: 10.1111/cbi.2008.23.issue-1
|
|
|
| [28] |
Rey S J. 2010. Spatial Empirics for Economic Growth and Convergence. Geographical Analysis, 33(3):195-214.
doi: 10.1111/gean.2001.33.issue-3
|
|
|
| [29] |
Sharp R, Tallis H T, Ricketts T, et al. 2016. InVEST 2.4.4 User's Guide. The Natural Capital Project, Stanford. [2021-12-13]. https://naturalcapitalproject.stanford.edu/software/invest .
|
|
|
| [30] |
Sherrouse B C, Semmens D J, Clement J M. 2014. An application of Social Values for Ecosystem Services (SolVES) to three national forests in Colorado and Wyoming. Ecological Indicators, 36:68-79.
doi: 10.1016/j.ecolind.2013.07.008
|
|
|
| [31] |
Sun C, Ma Y, Lu G. 2021. Response of ecosystem service value to land use/cover change in the northern slope economic belt of the Tianshan Mountains, Xinjiang, China. Journal of Arid Land, 13(10):1026-1040.
doi: 10.1007/s40333-021-0082-5
|
|
|
| [32] |
Sun X, Zhou Q. 2010. Primary study of freshwater ecoregionalization in China. Acta Scientiae Circumstantiae, 30(2):415-423. (in Chinese)
|
|
|
| [33] |
Sun X, Jiang Z, Liu F, et al. 2019. Monitoring spatio-temporal dynamics of habitat quality in Nansihu Lake basin, eastern China, from 1980 to 2015. Ecological Indicators, 102:716-723.
doi: 10.1016/j.ecolind.2019.03.041
|
|
|
| [34] |
Tan K, Wang X, Gao H. 2011. Analysis of ecological effects of comprehensive treatment in the Tarim River Basin using remote sensing data. Mining Science and Technology, 21(4):519-524.
|
|
|
| [35] |
Terrado M, Sabater S, Acuna V. 2016a. Identifying regions vulnerable to habitat degradation under future irrigation scenarios. Environmental Research Letters, 11(11):114025, doi: 10.1088/1748-9326/11/11/ 114025.
doi: 10.1088/1748-9326/11/11/ 114025
|
|
|
| [36] |
Terrado M, Sabater S, Chaplin-Kramer B, et al. 2016b. Model development for the assessment of terrestrial and aquatic habitat quality in conservation planning. Science of the Total Environment, 540:63-70.
doi: 10.1016/j.scitotenv.2015.03.064
|
|
|
| [37] |
Vellend M, Lilley P L, Starzomski B M. 2008. Using subsets of species in biodiversity surveys. Journal of Applied Ecology, 45(1):161-169.
doi: 10.1111/j.1365-2664.2007.01413.x
|
|
|
| [38] |
Wang B, Cheng W, Lan S. 2021. Impact of land use changes on habitat quality in Altay region. Journal of Resources and Ecology, 12(6):715-728.
|
|
|
| [39] |
Wang G, Chang C, Han D, et al. 2020. Temporal-spatial changes of landscape pattern and habitat quality in Laotieshan Nature Reserve. Acta Ecologica Sinica, 40(6):1910-1922. (in Chinese)
|
|
|
| [40] |
Wang H, Xu Y, Liu C, et al. 2019. Response of habitat quality to land use change based on geographical weighted regression. Acta Scientiarum Naturalium Universitatis Pekinensis, 55(3):509-518. (in Chinese)
|
|
|
| [41] |
Wu L, Sun C, Fan F. 2021. Estimating the characteristic spatiotemporal variation in habitat quality using the InVESTmodel—A case study from Guangdong-Hong Kong-Macao Greater Bay Area. Remote Sensing, 13(5):1008, doi: 10.3390/rs13051008.
doi: 10.3390/rs13051008
|
|
|
| [42] |
Xinjiang Uygur Autonomous Region Bureau of Statistics. 1990- 2018. Xinjiang Statistical Yearbook. Beijing: China Statistics Press. (in Chinese)
|
|
|
| [43] |
Xu C, Chen Y, Chen Y,, et al. 2013. Responses of surface runoff to climate change and human activities in the arid region of central Asia: a case study in the Tarim River basin, China. Environmental Management, 51(4):926-938.
doi: 10.1007/s00267-013-0018-8
|
|
|
| [44] |
Xue L, Zhang H, Yang C, et al. 2017. Quantitative assessment of hydrological alteration caused by irrigation projects in the Tarim River Basin, China. Scientific Reports, 7(1):4291, doi: 10.1038/s41598-017-04583-y.
doi: 10.1038/s41598-017-04583-y
|
|
|
| [45] |
Xue L, Wang J, Zhang L, et al. 2019. Spatiotemporal analysis of ecological vulnerability and management in the Tarim River Basin, China. Science of the Total Environment, 649:876-888.
doi: 10.1016/j.scitotenv.2018.08.321
|
|
|
| [46] |
Yang S, Zhao W, Liu Y, et al. 2018. Influence of land use change on the ecosystem service trade-offs in the ecological restoration area: Dynamics and scenarios in the Yanhe watershed, China. Science of the Total Environment, 644:556-566.
doi: 10.1016/j.scitotenv.2018.06.348
|
|
|
| [47] |
Yu G, DisseM , Huang H, et al. 2016. River network evolution and fluvial process responses to human activity in a hyper-arid environment—Case of the Tarim River in Northwest China. CATENA, 147:96-109.
doi: 10.1016/j.catena.2016.06.038
|
|
|
| [48] |
Yu G, Li Z, Huang H, et al. 2017. Human impacts on fluvial processes in a very arid environment: case of Tarim River in China. Advances in Water Science, 28(2):183-192. (in Chinese)
|
|
|
| [49] |
Zhang X, Song W, Lang Y, et al. 2020. Land use changes in the coastal zone of China's Hebei Province and the corresponding impacts on habitat quality. Land Use Policy, 99:104957, doi: 10.1016/j.landusepol.2020.104957.
doi: 10.1016/j.landusepol.2020.104957
|
|
|
| [50] |
Zhang Y, Xu J, Zhuang P. 2011. The spatial relationship of tourist distribution in Chinese cities. Tourism Geographies, 13(1):75-90.
doi: 10.1080/14616688.2010.529931
|
|
|
| [51] |
Zhang Y, Liu Y, Zhang Y,, et al. 2018. On the spatial relationship between ecosystem services and urbanization: A case study in Wuhan, China. Science of the Total Environment, 637:780-790.
|
|
|
| [52] |
Zheng Y, Zhang P, Tang T, et al. 2018. The effects of land use change on habitat quality in Changli County based on InVEST model. Chinese Journal of Agricultural Resources and Regional Planning, 39(7):121-128.
|
|
|
|
Viewed |
|
|
|
Full text
|
|
|
|
|
Abstract
|
|
|
|
|
Cited |
|
|
|
|
| |
Shared |
|
|
|
|
| |
Discussed |
|
|
|
|